- Alum Rock homes for sale
- Burbank homes for sale
- Cambrian Park homes for sale
- Campbell homes for sale
- Cupertino homes for sale
- East Foothills homes for sale
- Fruitdale homes for sale
- Los Altos homes for sale
- Los Altos Hills homes for sale
- Los Gatos homes for sale
- Loyola homes for sale
- Menlo Park homes for sale
- Milpitas homes for sale
- Monte Sereno homes for sale
- Mountain View homes for sale
- San Jose homes for sale
- Santa Clara homes for sale
- Saratoga homes for sale
- Sunnyvale homes for sale
- West Santa Clara homes for sale
95051, CA - homes for sale
105 of 105 results displayed
- Open Sat, 1 to 4pmNew
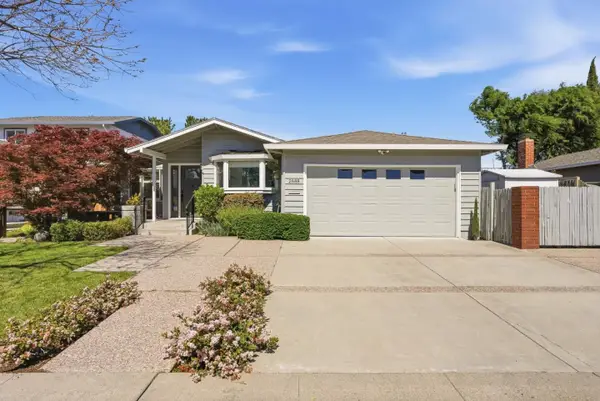
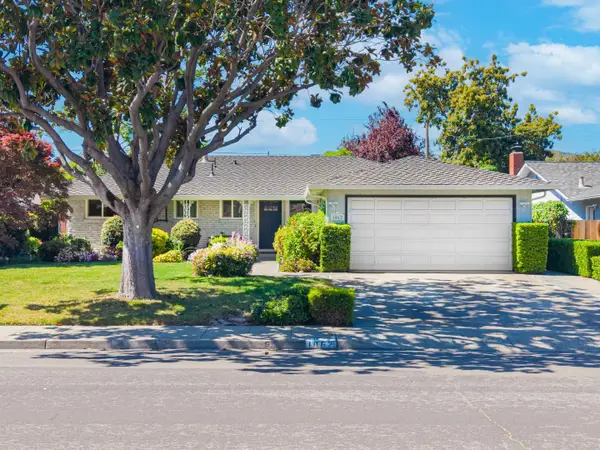
 $2,198,888Active3 beds 2 baths1,594 sq. ft.
1759 Higgins Avenue, Santa Clara, CA 95051
MLS# ML82040994Listed by: ROI REAL ESTATE - New
 $728,888Active2 beds 2 baths1,062 sq. ft.
1400 Bowe Avenue #1709, Santa Clara, CA 95051
MLS# ML82040637Listed by: COMPASS - New
 $1,600,000Active3 beds 2 baths1,653 sq. ft.
2621 Monticello Way, Santa Clara, CA 95051
MLS# ML82040536Listed by: REAL ESTATE EBROKER INC - New
 $425,000Active1 beds 1 baths622 sq. ft.
980 Kiely Boulevard #225, Santa Clara, CA 95051
MLS# ML82040112Listed by: MOMENTUM REALTY - New
 $1,698,000Active3 beds 3 baths1,800 sq. ft.
1043 Helen, Santa Clara, CA 95051
MLS# ML82040509Listed by: COMPASS - New
 $769,888Active2 beds 2 baths1,062 sq. ft.
1400 Bowe Avenue #1707, Santa Clara, CA 95051
MLS# ML82038564Listed by: NEXTHOME LIFESTYLES - New
 $1,848,000Active3 beds 2 baths1,248 sq. ft.
3003 Millar Avenue, Santa Clara, CA 95051
MLS# ML82038896Listed by: KELLER WILLIAMS THRIVE - New
 $698,000Active2 beds 2 baths1,360 sq. ft.
3715 Terstena Place #206, Santa Clara, CA 95051
MLS# ML82039817Listed by: COMPASS - New
 $2,290,000Active3 beds 2 baths1,675 sq. ft.
2688 Elliot Street, Santa Clara, CA 95051
MLS# ML82040354Listed by: VALLEY VINE REALTY - New
 $799,000Active2 beds 2 baths1,456 sq. ft.
3715 Terstena Place #307, Santa Clara, CA 95051
MLS# ML82039686Listed by: COMPASS - New
 $2,200,000Active3 beds 3 baths1,534 sq. ft.
1727 Andrea Pl, Santa Clara, CA 95051
MLS# 41128504Listed by: RE/MAX CROSSROADS - New
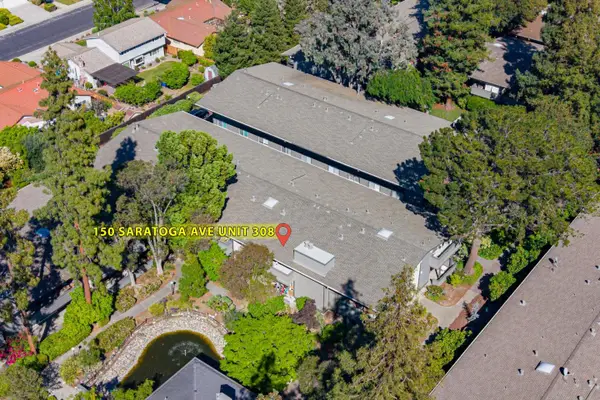 $680,000Active2 beds 2 baths1,260 sq. ft.
150 Saratoga Avenue #308, Santa Clara, CA 95051
MLS# ML82040220Listed by: COLDWELL BANKER REALTY - New
 $2,888,000Active4 beds 3 baths1,816 sq. ft.
141 Muir Avenue, Santa Clara, CA 95051
MLS# ML82040162Listed by: INTERO REAL ESTATE SERVICES - New
 $999,888Active3 beds 3 baths1,803 sq. ft.
3679 Brach Way, Santa Clara, CA 95051
MLS# ML82040122Listed by: KELLER WILLIAMS REALTY-SILICON VALLEY - New
 $1,780,000Active3 beds 2 baths1,078 sq. ft.
2177 Santa Cruz Avenue, Santa Clara, CA 95051
MLS# ML82040113Listed by: SH HOMES - New
 $588,000Active2 beds 2 baths1,097 sq. ft.
3029 Kaiser Drive #Unit A, Santa Clara, CA 95051
MLS# ML82040065Listed by: MAXREAL - New
 $2,198,888Active3 beds 2 baths1,166 sq. ft.
2645 Rebeiro Avenue, Santa Clara, CA 95051
MLS# ML82035907Listed by: BAYVIEW RESIDENTIAL BROKERAGE - New
 $3,300,000Active3 beds 3 baths2,316 sq. ft.
216 Rodonovan Drive, Santa Clara, CA 95051
MLS# ML82040026Listed by: CHRISTIE'S INTERNATIONAL REAL ESTATE SERENO - New
 $2,490,000Active3 beds 3 baths1,677 sq. ft.
1062 Waterbird Way, Santa Clara, CA 95051
MLS# ML82038777Listed by: COLDWELL BANKER REALTY - New
 $2,895,000Active4 beds 3 baths2,160 sq. ft.
2758 Glorietta Circle, Santa Clara, CA 95051
MLS# ML82040009Listed by: KW BAY AREA ESTATES - New
 $2,459,888Active3 beds 2 baths1,643 sq. ft.
3453 Geneva Drive, Santa Clara, CA 95051
MLS# ML82039831Listed by: SILICON VALLEY RESIDENTIAL BROKERAGE INC  $1,698,000Pending3 beds 2 baths1,108 sq. ft.
714 Hamilton Lane, Santa Clara, CA 95051
MLS# ML82039617Listed by: COLDWELL BANKER REALTY $649,888Active2 beds 2 baths874 sq. ft.
835 Bing Drive #24, Santa Clara, CA 95051
MLS# ML82039473Listed by: KELLER WILLIAMS REALTY-SILICON VALLEY $2,199,000Active3 beds 4 baths1,800 sq. ft.
1083 Ed Roth Terrace, Sunnyvale, CA 94086
MLS# ML82038840Listed by: INTERO REAL ESTATE SERVICES $1,988,888Pending4 beds 2 baths1,568 sq. ft.
1000 Wood Duck Avenue, Santa Clara, CA 95051
MLS# ML82039431Listed by: REAL ESTATE EXPERTS ERA POWERED $2,139,888Pending4 beds 3 baths1,874 sq. ft.
3417 Cooper Drive, Santa Clara, CA 95051
MLS# ML82038914Listed by: KW ADVISORS $2,200,000Active3 beds 2 baths1,425 sq. ft.
2420 Fordham Drive, Santa Clara, CA 95051
MLS# ML82039067Listed by: KELLER WILLIAMS THRIVE $1,190,000Active2 beds 3 baths1,205 sq. ft.
2913 Noyce Place #217, Santa Clara, CA 95051
MLS# ML82039343Listed by: COMPASS $2,500,000Active4 beds 2 baths1,396 sq. ft.
702 Flannery, Santa Clara, CA 95051
MLS# CRPW26058350Listed by: HOME SAVER REALTY $1,299,000Active2 beds 3 baths1,510 sq. ft.
3578 Rambla Place #303, Santa Clara, CA 95051
MLS# ML82039189Listed by: REAL BROKERAGE TECHNOLOGIES $664,800Active2 beds 2 baths956 sq. ft.
978 Kiely Boulevard #E, Santa Clara, CA 95051
MLS# ML82039166Listed by: KELLER WILLIAMS REALTY-SILICON VALLEY $1,688,000Active3 beds 2 baths1,078 sq. ft.
3050 Santa Maria Avenue, Santa Clara, CA 95051
MLS# ML82039170Listed by: COLDWELL BANKER REALTY $1,850,000Active4 beds 4 baths1,998 sq. ft.
3553 Meyer Place, Santa Clara, CA 95051
MLS# ML82039177Listed by: COMPASS- Open Thu, 3 to 5pm
 $1,499,000Active3 beds 1 baths1,086 sq. ft.
1753 Laine Avenue, Santa Clara, CA 95051
MLS# 225146533Listed by: REAL BROKER  $725,000Pending2 beds 2 baths1,062 sq. ft.
1400 Bowe Avenue #1404, Santa Clara, CA 95051
MLS# ML82039111Listed by: ROI REAL ESTATE $1,499,000Active2 beds 3 baths1,424 sq. ft.
3089 El Camino Real #13, Santa Clara, CA 95051
MLS# 41127493Listed by: TOLL BROTHERS REAL ESTATE,INC $1,249,800Pending3 beds 3 baths1,399 sq. ft.
2410 S Park Lane, Santa Clara, CA 95051
MLS# ML82038654Listed by: KELLER WILLIAMS THRIVE $585,000Active1 beds 1 baths735 sq. ft.
835 Bing Drive #29, Santa Clara, CA 95051
MLS# ML82038965Listed by: COMPASS $1,600,000Active4 beds 3 baths1,873 sq. ft.
3069 Agate Drive, Santa Clara, CA 95051
MLS# ML82034928Listed by: EPIQUE REALTY $649,000Active2 beds 2 baths956 sq. ft.
952 Kiely Boulevard #H, Santa Clara, CA 95051
MLS# ML82038514Listed by: COMPASS $2,085,000Pending5 beds 3 baths2,142 sq. ft.
2895 Warburton Avenue, Santa Clara, CA 95051
MLS# ML82034488Listed by: COLDWELL BANKER REALTY- Open Sun, 1:30 to 4:30pm
 $1,698,000Active4 beds 3 baths1,924 sq. ft.
3390 Eichers Place #102, Santa Clara, CA 95051
MLS# ML82038505Listed by: COMPASS  $2,498,800Active4 beds 2 baths1,409 sq. ft.
1150 Kiely Boulevard, Santa Clara, CA 95051
MLS# ML82038460Listed by: BAY AREA REALTY INVESTMENT $1,300,000Pending3 beds 2 baths1,136 sq. ft.
2955 Gala Court, Santa Clara, CA 95051
MLS# ML82038319Listed by: MAXREAL $2,098,888Pending3 beds 2 baths1,505 sq. ft.
774 Ridge Road, Santa Clara, CA 95051
MLS# ML82037745Listed by: KW BAY AREA ESTATES $1,868,888Pending3 beds 2 baths1,145 sq. ft.
2711 Toledo Avenue, Santa Clara, CA 95051
MLS# ML82038296Listed by: ROI REAL ESTATE $1,090,000Active2 beds 3 baths1,209 sq. ft.
2755 Ball Place #2, Santa Clara, CA 95051
MLS# ML82038259Listed by: COLDWELL BANKER REALTY $2,388,000Pending4 beds 3 baths1,610 sq. ft.
1991 Santa Inez Court, Santa Clara, CA 95051
MLS# ML82037354Listed by: COMPASS $2,999,888Active4 beds 3 baths1,842 sq. ft.
2121 Francis Avenue, Santa Clara, CA 95051
MLS# ML82037536Listed by: ALLIANCE BAY REALTY $1,590,000Pending3 beds 2 baths1,396 sq. ft.
2535 Crystal Drive, Santa Clara, CA 95051
MLS# ML82033445Listed by: OWN $1,980,000Pending3 beds 2 baths1,374 sq. ft.
3435 Notre Dame Drive, Santa Clara, CA 95051
MLS# ML82037939Listed by: AEZ INVESTMENT, INC. $1,468,000Active2 beds 3 baths1,432 sq. ft.
3578 Rambla Place #726, Santa Clara, CA 95051
MLS# ML82037810Listed by: BAY WISE REALTY $2,788,888Pending4 beds 2 baths1,687 sq. ft.
534 Flannery Street, Santa Clara, CA 95051
MLS# ML82037530Listed by: KELLER WILLIAMS THRIVE $1,880,000Active3 beds 2 baths1,237 sq. ft.
3175 Colfax Court, Santa Clara, CA 95051
MLS# ML82036543Listed by: GIANT REALTY INC. $1,389,938Active3 beds 3 baths1,544 sq. ft.
3079 El Camino Real #208, Santa Clara, CA 95051
MLS# 41126136Listed by: TOLL BROTHERS REAL ESTATE,INC $1,488,000Active3 beds 3 baths1,703 sq. ft.
3578 Rambla Pl #430, Santa Clara, CA 95051
MLS# 41126096Listed by: KELLER WILLIAMS TRI-VALLEY $2,499,000Active4 beds 3 baths2,162 sq. ft.
587 Cambridge Drive, Santa Clara, CA 95051
MLS# ML82037203Listed by: KELLER WILLIAMS THRIVE $1,098,000Pending2 beds 3 baths1,268 sq. ft.
2930 Boyter Place #112, Santa Clara, CA 95051
MLS# ML82037317Listed by: COMPASS $1,690,000Active3 beds 4 baths1,727 sq. ft.
2927 Kaiser Drive, Santa Clara, CA 95051
MLS# ML82037229Listed by: GAEA REALTY $728,000Active2 beds 2 baths1,062 sq. ft.
1400 Bowe Avenue #1702, Santa Clara, CA 95051
MLS# ML82037108Listed by: SCOPE REAL ESTATE $1,699,000Active3 beds 2 baths1,212 sq. ft.
3478 San Marcos Way, Santa Clara, CA 95051
MLS# 426105788Listed by: SUEN, PETER $748,000Active2 beds 2 baths1,248 sq. ft.
3705 Terstena Place #201, Santa Clara, CA 95051
MLS# ML82036857Listed by: COLDWELL BANKER REALTY $548,000Pending1 beds 1 baths727 sq. ft.
3725 Terstena Place #144, Santa Clara, CA 95051
MLS# ML82036765Listed by: CHRISTIE'S INTERNATIONAL REAL ESTATE SERENO- Open Thu, 5:30 to 6:30pm
 $725,000Active2 beds 2 baths962 sq. ft.
835 Bing Drive #21, Santa Clara, CA 95051
MLS# ML82035377Listed by: KELLER WILLIAMS THRIVE  $799,900Active2 beds 2 baths1,360 sq. ft.
3715 Terstena Place #110, Santa Clara, CA 95051
MLS# ML82036604Listed by: ALLIANCE BAY REALTY $685,000Active2 beds 2 baths992 sq. ft.
960 Kiely Boulevard #F, Santa Clara, CA 95051
MLS# ML82036528Listed by: GIANT REALTY INC. $1,188,000Active2 beds 3 baths1,268 sq. ft.
2933 Lamory Place #111, Santa Clara, CA 95051
MLS# ML82036522Listed by: COLDWELL BANKER REALTY $1,990,000Active5 beds 4 baths1,922 sq. ft.
2514 Parkland Court, Santa Clara, CA 95051
MLS# ML82036439Listed by: MONA REAL ESTATE GROUP $1,661,194Active3 beds 3 baths1,655 sq. ft.
3093 El Camino Real #6, Santa Clara, CA 95051
MLS# 41125299Listed by: TOLL BROTHERS REAL ESTATE,INC $1,988,888Pending3 beds 2 baths1,494 sq. ft.
2898 Barkley Avenue, Santa Clara, CA 95051
MLS# ML82036327Listed by: PMZ REAL ESTATE $730,000Active3 beds 2 baths1,113 sq. ft.
3320 Lochinvar Avenue #56, Santa Clara, CA 95051
MLS# ML82033644Listed by: COMPASS $1,880,000Active4 beds 4 baths2,440 sq. ft.
1705 Lawrence Road, Santa Clara, CA 95051
MLS# ML82035426Listed by: COMPASS $2,499,000Active4 beds 5 baths2,990 sq. ft.
3488 Toomey Place, Santa Clara, CA 95051
MLS# ML82032508Listed by: KELLER WILLIAMS THRIVE $1,750,000Active3 beds 2 baths1,207 sq. ft.
2631 Monroe, Santa Clara, CA 95051
MLS# IG26015088Listed by: COLDWELL BANKER REALTY $1,540,000Active2 beds 3 baths1,541 sq. ft.
3089 El Camino Real #7, Santa Clara, CA 95051
MLS# 41123472Listed by: TOLL BROTHERS REAL ESTATE,INC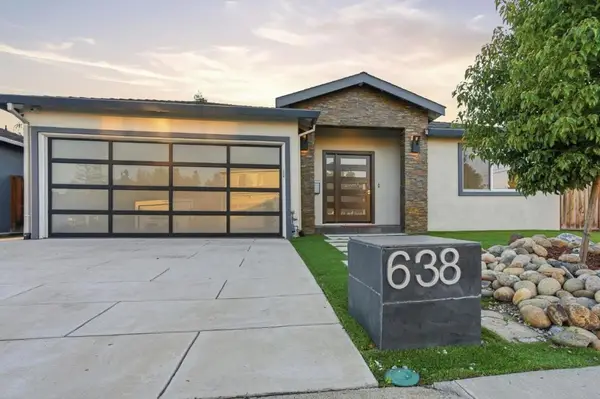 $2,798,000Pending4 beds 3 baths1,717 sq. ft.
638 Enos Court, Santa Clara, CA 95051
MLS# ML82030400Listed by: KELLER WILLIAMS THRIVE $788,888Active2 beds 2 baths1,012 sq. ft.
221 Kiely Boulevard #B, Santa Clara, CA 95051
MLS# ML82038930Listed by: COLDWELL BANKER REALTY $1,799,000Pending4 beds 2 baths1,608 sq. ft.
3024 Machado Avenue, Santa Clara, CA 95051
MLS# ML82031954Listed by: REALTY ONE GROUP INFINITY $1,499,000Active3 beds 3 baths1,838 sq. ft.
1031 Las Palmas Drive, Santa Clara, CA 95051
MLS# ML82031963Listed by: KELLER WILLIAMS THRIVE $1,498,000Pending4 beds 5 baths1,940 sq. ft.
2909 Corvin Drive #139, Santa Clara, CA 95051
MLS# ML82028065Listed by: KELLER WILLIAMS THRIVE $705,550Active2 beds 2 baths1,137 sq. ft.
121 Buckingham Drive #25, Santa Clara, CA 95051
MLS# ML82030861Listed by: KW BAY AREA ESTATES $1,624,000Pending3 beds 3 baths1,655 sq. ft.
3089 El Camino Real #5, Santa Clara, CA 95051
MLS# 41120349Listed by: TOLL BROTHERS REAL ESTATE,INC $1,788,000Pending3 beds 4 baths1,861 sq. ft.
3522 Eastin Place, Santa Clara, CA 95051
MLS# ML82030447Listed by: GAEA REALTY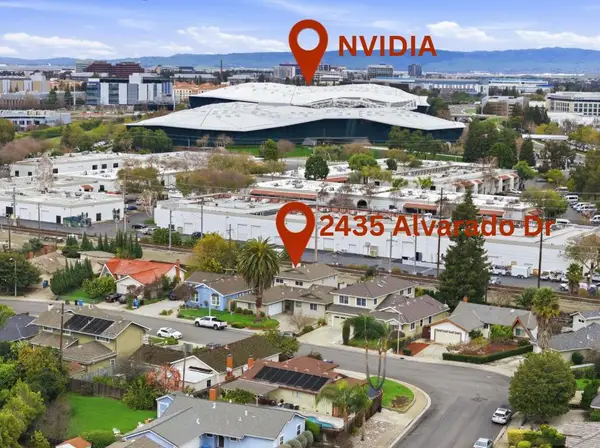 $1,795,000Pending5 beds 3 baths2,716 sq. ft.
2435 Alvarado Drive, Santa Clara, CA 95051
MLS# ML82030364Listed by: ROI REAL ESTATE $449,999Active1 beds 1 baths678 sq. ft.
1730 Halford Ave #152, Santa Clara, CA 95051
MLS# 41116398Listed by: REALTY++ $999,800Active4 beds 3 baths1,564 sq. ft.
1101 Pomeroy Avenue, Santa Clara, CA 95051
MLS# ML82023802Listed by: INTERO REAL ESTATE SERVICES $1,899,999Active4 beds 2 baths1,855 sq. ft.
1496 Mcpherson Street, Santa Clara, CA 95051
MLS# ML82038072Listed by: KELLER WILLIAMS REALTY-SILICON VALLEY $1,624,995Pending3 beds 3 baths1,655 sq. ft.
3089 El Camino Real #9, Santa Clara, CA 95051
MLS# 41114756Listed by: TOLL BROTHERS REAL ESTATE,INC $1,413,769Pending2 beds 2 baths1,415 sq. ft.
3079 El Camino Real #101, Santa Clara, CA 95051
MLS# 41114653Listed by: TOLL BROTHERS REAL ESTATE,INC $2,175,000Pending6 beds 4 baths2,581 sq. ft.
2854 Regnart Way, Santa Clara, CA 95051
MLS# ML82024372Listed by: KELLER WILLIAMS REALTY-SILICON VALLEY $1,638,995Pending3 beds 4 baths1,797 sq. ft.
3079 El Camino Real #205, Santa Clara, CA 95051
MLS# 41113868Listed by: TOLL BROTHERS REAL ESTATE,INC $345,000Pending1 beds 1 baths690 sq. ft.
Address Withheld By Seller, Santa Clara, CA 95051
MLS# ML81441447Listed by: INTERO REAL ESTATE SERVICES $970,000Pending3 beds 2 baths1,724 sq. ft.
Address Withheld By Seller, Santa Clara, CA 95051
MLS# ML81452997Listed by: CONGRESS REALTY, INC. $3,198,000Active9 beds -- baths4,032 sq. ft.
2831 Malabar Avenue, Santa Clara, CA 95051
MLS# ML81994545Listed by: COLDWELL BANKER REALTY $1,688,888Pending4 beds 2 baths1,916 sq. ft.
1170 White Drive, Santa Clara, CA 95051
MLS# ML81987265Listed by: REALTY ONE GROUP AMERICAN $1,868,000Active2 beds 1 baths3,342 sq. ft.
1355 Calabazas Court, Santa Clara, CA 95051
MLS# ML81959122Listed by: MAXREAL- $801,705Pending4 beds 2 baths1,455 sq. ft.
Address Withheld By Seller, Santa Clara, CA 95051
MLS# ML81448991Listed by: HOUSEPAD  $1,308,000Pending4 beds 3 baths1,461 sq. ft.
Address Withheld By Seller, Santa Clara, CA 95051
MLS# ML81470086Listed by: REAL ESTATE ADVANTAGE GROUP $1,988,888Pending-- beds -- baths1,830 sq. ft.
3530 Bennett Avenue, Santa Clara, CA 95051
MLS# ML81908305Listed by: ABODE REAL ESTATE $508,888Pending2 beds 2 baths949 sq. ft.
Address Withheld By Seller, Santa Clara, CA 95051
MLS# ML81450152Listed by: FORREST GEE, BROKER- $1,999,888Active5 beds 3 baths2,116 sq. ft.
736 Pomeroy Avenue, Santa Clara, CA 95051
MLS# ML81881112Listed by: EXP REALTY OF CALIFORNIA INC.  $350,000Active1 beds 1 baths440 sq. ft.
942 Kiely Boulevard #G, Santa Clara, CA 95051
MLS# ML81894454Listed by: COLDWELL BANKER REALTY $1,899,950Active4 beds 3 baths1,860 sq. ft.
Address Withheld By Seller, Santa Clara, CA 95051
MLS# ML81896146Listed by: INTERO REAL ESTATE SERVICES $1,500,000Active3 beds 3 baths1,254 sq. ft.
Address Withheld By Seller, Santa Clara, CA 95051
MLS# ML81713269Listed by: RICHARD G MATUSICH & ASSOC. $4,399Active4 beds 2 baths1,584 sq. ft.
2900 Miles Drive, Santa Clara, CA 95051
MLS# ML81902888Listed by: REALTY ONE GROUP INFINITY
Local realty services provided by:CENTURY 21 Experience, CENTURY 21 Sierra Properties, CENTURY 21 Select Real Estate, Inc., CENTURY 21 Baldini Real Estate, Inc.
The information being provided by California Regional MLS (Southern California) is for the consumer's personal, non-commercial use and may not be used for any purpose other than to identify prospective properties consumer may be interested in purchasing. Any information relating to real estate for sale referenced on this web site comes from the Internet Data Exchange (IDX) program of the California Regional MLS (Southern California). CENTURY 21 Experience is not a Multiple Listing Service (MLS), nor does it offer MLS access. This website is a service of CENTURY 21 Experience, a broker participant of California Regional MLS (Southern California). This web site may reference real estate listing(s) held by a brokerage firm other than the broker and/or agent who owns this web site.
The accuracy of all information, regardless of source, including but not limited to open house information, square footages and lot sizes, is deemed reliable but not guaranteed and should be personally verified through personal inspection by and/or with the appropriate professionals. The data contained herein is copyrighted by California Regional MLS (Southern California) and is protected by all applicable copyright laws. Any unauthorized dissemination of this information is in violation of copyright laws and is strictly prohibited.
Copyright 2021 California Regional MLS (Southern California). All rights reserved.
MetroList MLS 2026. This information is being provided by MetroList MLS. All measurements and calculations of area are approximate. Information provided by Seller/Other sources, not verified by Broker. All interested persons should independently verify accuracy of information. Provided properties may or may not be listed by the office/agent presenting the information. Data Updated: March 28, 2026. Information being provided is for consumers' personal, non-commercial use and may not be used for any purpose other than to identify prospective properties consumers may be interested in purchasing. Information deemed reliable but not guaranteed. Any offer of compensation is made only to Participants of MLS where the subject listing is filed and in accordance with such MLS's regulations or rules.
The information being provided by San Francisco Association of REALTORS is for the consumer's personal, non-commercial use and may not be used for any purpose other than to identify prospective properties consumer may be interested in purchasing. Any information relating to real estate for sale referenced on this web site comes from the Internet Data Exchange (IDX) program of the San Francisco Association of REALTORS. This web site may reference real estate listing(s) held by a brokerage firm other than the broker and/or agent who owns this web site. The accuracy of all information, regardless of source, including but not limited to open house information, square footages and lot sizes, is deemed reliable but not guaranteed and should be personally verified through personal inspection by and/or with the appropriate professionals. The data contained herein is copyrighted by San Francisco Association of REALTORS and is protected by all applicable copyright laws. Any unauthorized dissemination of this information is in violation of copyright laws and is strictly prohibited.
Popular searches near 95051
Popular neighborhoods near 95051
- Birdland, Sunnyvale homes for sale
- Blackford, San Jose homes for sale
- Community Center, Sunnyvale homes for sale
- Cory, San Jose homes for sale
- East Murphy, Sunnyvale homes for sale
- Heritage District, Sunnyvale homes for sale
- Loma Linda, San Jose homes for sale
- Mitty, San Jose homes for sale
- Ortega, Sunnyvale homes for sale
- Ponderosa, Sunnyvale homes for sale
- Ponderosa Park, Sunnyvale homes for sale
- Rancho Rinconada, Cupertino homes for sale
- Raynor, Sunnyvale homes for sale
- San Miguel, Sunnyvale homes for sale
- Santa Clara East Central, Santa Clara homes for sale
- Santa Clara North Central, Santa Clara homes for sale
- Santa Clara South 101, Santa Clara homes for sale
- Santa Clara Southeast, Santa Clara homes for sale
- Santa Clara Southwest, Santa Clara homes for sale
- Santa Clara West Central, Santa Clara homes for sale
Counties near Santa Clara, 95051
- Alameda County homes for sale
- Calaveras County homes for sale
- Contra Costa County homes for sale
- Marin County homes for sale
- Merced County homes for sale
- Monterey County homes for sale
- Napa County homes for sale
- Sacramento County homes for sale
- San Benito County homes for sale
- San Francisco County homes for sale
- San Joaquin County homes for sale
- San Mateo County homes for sale
- Santa Clara County homes for sale
- Santa Cruz County homes for sale
- Solano County homes for sale
- Sonoma County homes for sale
- Stanislaus County homes for sale
- Yolo County homes for sale
Protect your home and budget from life's surprises with an Assurant Home Warranty, backed by a partner that supports you through every step of homeownership. Explore Plans.
©2026 Century 21 Real Estate LLC. All rights reserved. CENTURY 21®, the CENTURY 21 Logo and C21® are service marks owned by Century 21 Real Estate LLC. Century 21 Real Estate LLC fully supports the principles of the Fair Housing Act and the Equal Opportunity Act. Each office is independently owned and operated. Listing information is deemed reliable but not guaranteed accurate.