- Avalon homes for sale
- Beesleys Point homes for sale
- Cape May Court House homes for sale
- Corbin City homes for sale
- Dennisville homes for sale
- Marmora homes for sale
- Middle homes for sale
- Ocean City homes for sale
- Ocean View homes for sale
- Palermo homes for sale
- Petersburg homes for sale
- Sea Isle City homes for sale
- Seaville homes for sale
- South Seaville homes for sale
- Stone Harbor homes for sale
- Strathmere homes for sale
- Swainton homes for sale
- Tuckahoe homes for sale
- Upper Township homes for sale
- Woodbine homes for sale
08243, NJ - homes for sale
5 of 5 results displayed
- Open Sat, 11am to 2pm
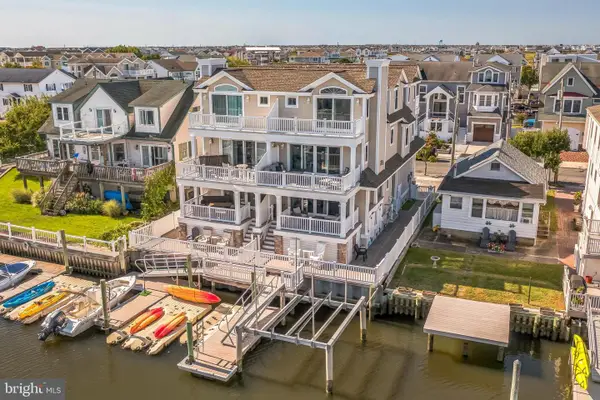
 $2,595,000Active5 beds 5 baths2,335 sq. ft.
115 45th Street, Sea Isle City, NJ 08243
MLS# 260594Listed by: C. A. MCCANN & SONS - Open Sat, 11am to 2pm
 $2,995,000Active4 beds 6 baths2,305 sq. ft.
309 45th Pl #west, SEA ISLE CITY, NJ 08243
MLS# NJCM2006844Listed by: GOLDCOAST SOTHEBYS INTERNATIONAL REALTY - Open Sat, 11am to 2pm
 $2,995,000Active4 beds 5 baths2,305 sq. ft.
309 45th Place, Sea Isle City, NJ 08243
MLS# 260356Listed by: GOLDCOAST SOTHEBY'S INTERNATIONAL REALTY - Open Sat, 11am to 2pm
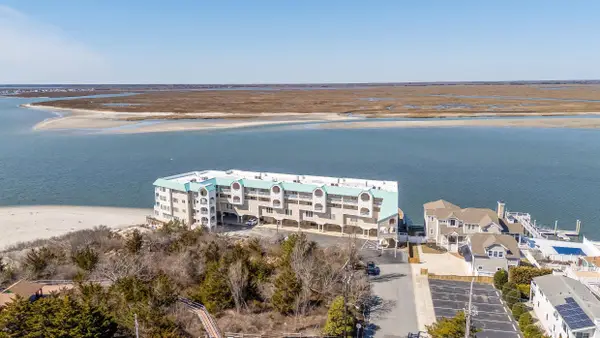
 $1,499,000Active3 beds 2 baths1,564 sq. ft.
9400 Roberts Ave Ave #104, Sea Isle City, NJ 08243
MLS# 599759Listed by: KELLER WILLIAMS REALTY JERSEY SHORE-SEA ISLE CITY - Open Sat, 11am to 2pm
 $1,499,000Active3 beds 2 baths1,564 sq. ft.
9400 Roberts Avenue, Sea Isle City, NJ 08243
MLS# 252513Listed by: KELLER WILLIAMS REALTY JERSEY SHORE - SIC
Local realty services provided by:CENTURY 21 Affiliated, CENTURY 21 Home Team Realty, CENTURY 21 Action Plus Realty
Popular searches near 08243
Popular neighborhoods near 08243
- 18th - 34th, Ocean City homes for sale
- Bay Area, Ocean City homes for sale
- Central, Ocean City homes for sale
- Chelsea, Atlantic City homes for sale
- Chelsea Heights, Atlantic City homes for sale
- Downtown, Atlantic City homes for sale
- Duck Town, Atlantic City homes for sale
- Gardens, Ocean City homes for sale
- Gold Coast, Ocean City homes for sale
- Lagoon Island, Atlantic City homes for sale
- Lower Chelsea, Atlantic City homes for sale
- Merion Park, Ocean City homes for sale
- Monroe Park, Atlantic City homes for sale
- Mount Pleasant, Pleasantville homes for sale
- North End, Ocean City homes for sale
- OC Homes, Ocean City homes for sale
- Riviera, Ocean City homes for sale
- South End, Ocean City homes for sale
- Venice Park, Atlantic City homes for sale
- Waterfront District, Pleasantville homes for sale
Counties near Sea Isle City, 08243
- Atlantic County homes for sale
- Burlington County homes for sale
- Camden County homes for sale
- Cape May County homes for sale
- Caroline County homes for sale
- Cecil County homes for sale
- Chester County homes for sale
- Cumberland County homes for sale
- Delaware County homes for sale
- Gloucester County homes for sale
- Kent County homes for sale
- Mercer County homes for sale
- New Castle County homes for sale
- Ocean County homes for sale
- Philadelphia County homes for sale
- Queen Anne's County homes for sale
- Salem County homes for sale
- Sussex County homes for sale
- Wicomico County homes for sale
- Worcester County homes for sale
Protect your home and budget from life's surprises with an Assurant Home Warranty, backed by a partner that supports you through every step of homeownership. Explore Plans.
©2026 Century 21 Real Estate LLC. All rights reserved. CENTURY 21®, the CENTURY 21 Logo and C21® are service marks owned by Century 21 Real Estate LLC. Century 21 Real Estate LLC fully supports the principles of the Fair Housing Act and the Equal Opportunity Act. Each office is independently owned and operated. Listing information is deemed reliable but not guaranteed accurate.