- Alderwood Manor homes for sale
- Bothell homes for sale
- Bothell homes for sale
- Bothell East homes for sale
- Bothell West homes for sale
- Brier homes for sale
- Edmonds homes for sale
- Esperance homes for sale
- Kenmore homes for sale
- Kirkland homes for sale
- Lake Forest Park homes for sale
- Larch Way homes for sale
- Lynnwood homes for sale
- Martha Lake homes for sale
- Meadowdale homes for sale
- Mountlake Terrace homes for sale
- North Lynnwood homes for sale
- Shoreline homes for sale
- Woodinville homes for sale
- Woodway homes for sale
98155, WA - homes for sale
100 of 100 results displayed
- New
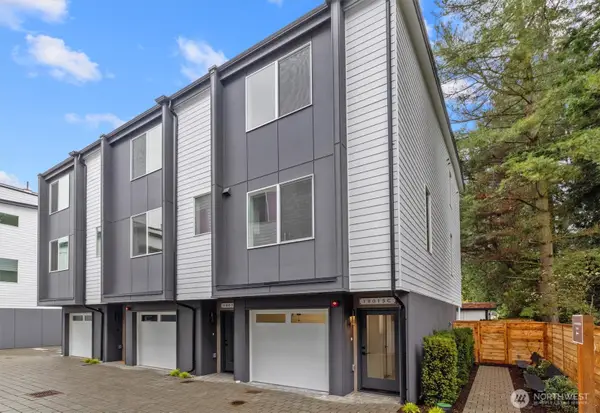
 $782,000Active3 beds 1 baths1,320 sq. ft.
1557 NE 171st Street, Shoreline, WA 98155
MLS# 2495989Listed by: EXP REALTY
- New
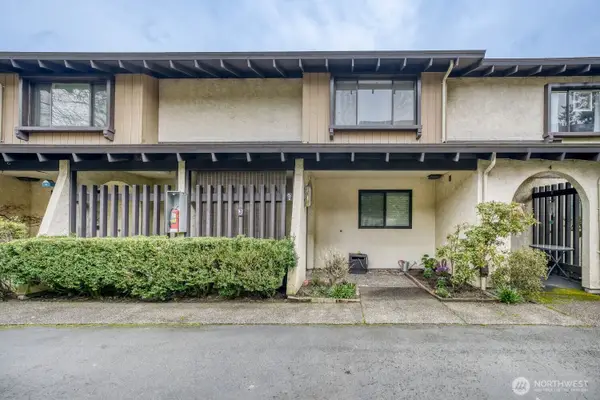 $420,000Active2 beds 2 baths1,369 sq. ft.
1723 NE 179th Street #3, Shoreline, WA 98155
MLS# 2497932Listed by: REALTY ONE GROUP ORCA GOLD - New
 $675,000Active3 beds 1 baths1,050 sq. ft.
1840 NE 171 Street, Shoreline, WA 98155
MLS# 2497340Listed by: ROCKWELL REALTY LLC - New
 $819,000Active4 beds 3 baths2,720 sq. ft.
146 NE 165th Street, Shoreline, WA 98155
MLS# 2497115Listed by: JOHN L SCOTT MADRONA GROUP - New
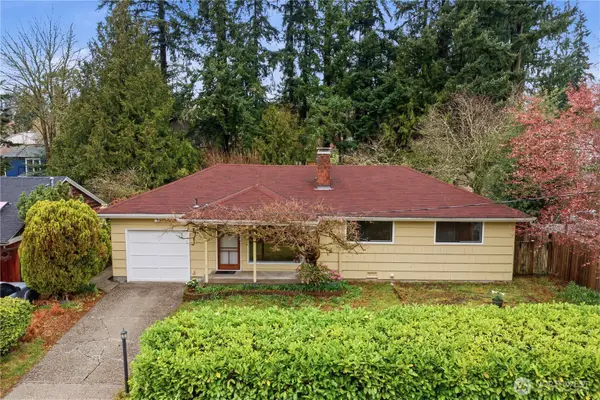
 $525,000Active2 beds 1 baths790 sq. ft.
20322 22nd Avenue Ne, Shoreline, WA 98155
MLS# 2495587Listed by: JOHN L. SCOTT, INC. - New
 $1,200,000Active5 beds 3 baths2,920 sq. ft.
19616 44th Place Ne, Lake Forest Park, WA 98115
MLS# 2497043Listed by: WINDERMERE WEST METRO - New
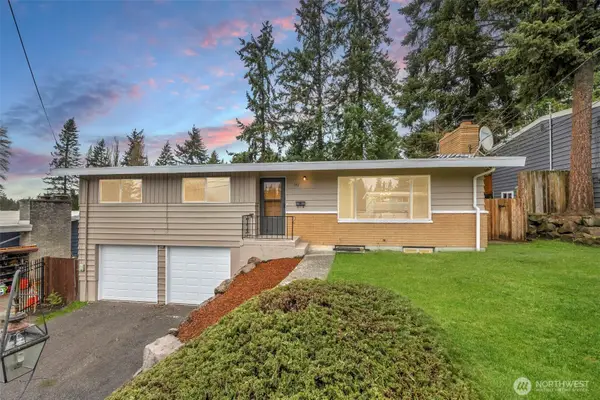
 $695,000Active3 beds 2 baths1,450 sq. ft.
17004 11th Avenue Ne, Shoreline, WA 98155
MLS# 2497520Listed by: WINDERMERE REAL ESTATE/EAST  $400,000Pending2 beds 2 baths994 sq. ft.
19123 Ballinger Way Ne #102, Lake Forest Park, WA 98155
MLS# 2495612Listed by: JOHN L. SCOTT, INC.- New
 $979,000Active5 beds 3 baths2,270 sq. ft.
329 NE 185th Street, Shoreline, WA 98155
MLS# 2497513Listed by: WINDERMERE REAL ESTATE CO. - New
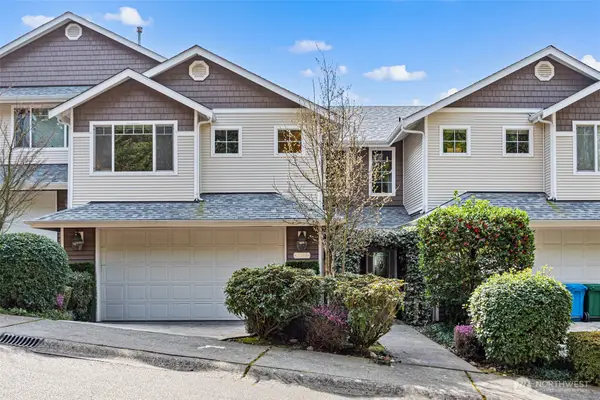
 $755,000Active3 beds 3 baths1,649 sq. ft.
18015 2nd Avenue Ne #B, Shoreline, WA 98155
MLS# 2496342Listed by: REALOGICS SOTHEBY'S INT'L RLTY - New
 $895,000Active4 beds 2 baths1,870 sq. ft.
18703 50th Avenue Ne, Lake Forest Park, WA 98155
MLS# 2492803Listed by: WINDERMERE NORTHLAKE - New
 $835,050Active3 beds 2 baths1,620 sq. ft.
1209 NE 155th Street, Shoreline, WA 98155
MLS# 2495890Listed by: BETTER HOMES & PROPERTIES - New
 $3,198,000Active4 beds 4 baths5,335 sq. ft.
15517 Lake Shore Boulevard Ne, Lake Forest Park, WA 98155
MLS# 2495367Listed by: ENSEMBLE - New
 $685,000Active3 beds 3 baths1,347 sq. ft.
18015 2nd Avenue Ne #C, Shoreline, WA 98155
MLS# 2495551Listed by: REALOGICS SOTHEBY'S INT'L RLTY - New
 $685,000Active3 beds 3 baths1,641 sq. ft.
1443 NE 166th Court #3, Shoreline, WA 98155
MLS# 2495529Listed by: MY REALTY GROUP LLC - New
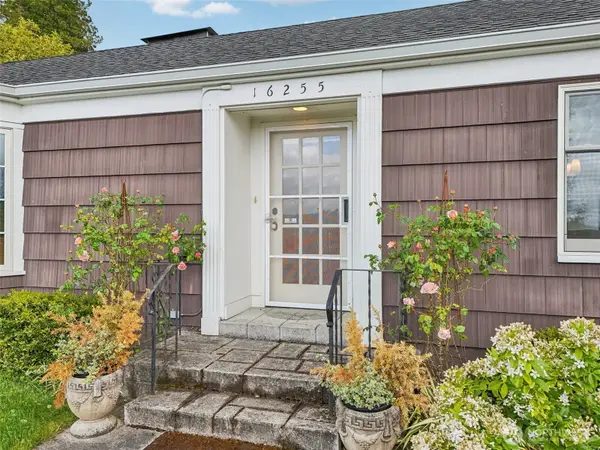 $1,550,000Active3 beds 3 baths2,910 sq. ft.
16255 38th Avenue Ne, Lake Forest Park, WA 98155
MLS# 2494025Listed by: REAL PROPERTY ASSOCIATES - New
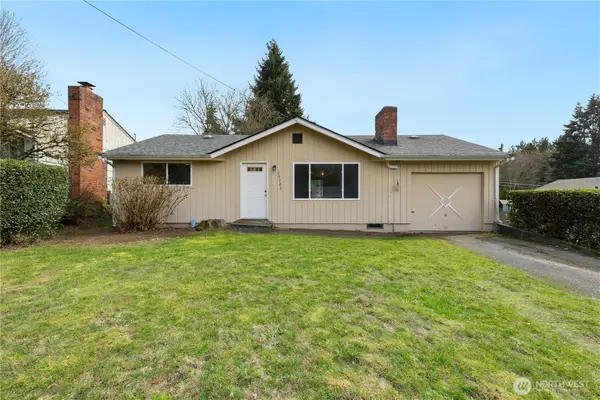
 $715,000Active3 beds 1 baths1,080 sq. ft.
20068 21st Avenue Ne, Shoreline, WA 98155
MLS# 2493344Listed by: WINDERMERE RE GREENWOOD  $1,000,000Pending5 beds 3 baths2,320 sq. ft.
19225 51st Avenue Ne, Lake Forest Park, WA 98155
MLS# 2492874Listed by: HOMESMART REAL ESTATE ASSOC $739,900Active3 beds 3 baths1,530 sq. ft.
14606 35th Court Ne, Lake Forest Park, WA 98155
MLS# 2492956Listed by: SKYLINE PROPERTIES, INC. $724,950Pending3 beds 1 baths1,212 sq. ft.
2515 NE 168th Street, Shoreline, WA 98155
MLS# 2484613Listed by: COMPASS $1,729,900Active5 beds 4 baths3,710 sq. ft.
14534 27th Avenue Ne, Shoreline, WA 98155
MLS# 2491503Listed by: JOHN L. SCOTT, INC. $1,599,950Pending5 beds 3 baths3,190 sq. ft.
17122 32nd Avenue Ne, Lake Forest Park, WA 98155
MLS# 2481477Listed by: COMPASS $4,700,000Active4 beds 5 baths4,930 sq. ft.
4701 NE Shore Place, Lake Forest Park, WA 98155
MLS# 2485894Listed by: WINDERMERE R.E. NORTHEAST, INC $7,000,000Active4 beds 5 baths6,520 sq. ft.
4701 NE Shore Place, Lake Forest Park, WA 98155
MLS# 2489956Listed by: WINDERMERE R.E. NORTHEAST, INC $2,400,000Active2 beds 2 baths1,590 sq. ft.
4728 NE 172nd Street, Lake Forest Park, WA 98155
MLS# 2489993Listed by: WINDERMERE R.E. NORTHEAST, INC $769,000Pending3 beds 2 baths1,440 sq. ft.
1828 NE 171st Street, Shoreline, WA 98155
MLS# 2489556Listed by: WINDERMERE RE GREENWOOD $599,950Pending2 beds 1 baths800 sq. ft.
16011 27th Avenue Ne, Shoreline, WA 98155
MLS# 2489706Listed by: KW GREATER SEATTLE $865,000Pending4 beds 2 baths2,100 sq. ft.
18007 49th Place Ne, Lake Forest Park, WA 98155
MLS# 2475343Listed by: REAL PROPERTY ASSOCIATES $625,000Active3 beds 1 baths940 sq. ft.
815 NE 200th Street, Shoreline, WA 98155
MLS# 2491553Listed by: RE/MAX ALL CITY $325,000Pending1 beds 1 baths781 sq. ft.
3820 NE 155th Place #403, Lake Forest Park, WA 98155
MLS# 2491054Listed by: WINDERMERE RE GREENWOOD $1,298,980Active5 beds 4 baths2,640 sq. ft.
19531 55th Avenue Ne, Lake Forest Park, WA 98155
MLS# 2490665Listed by: WINDERMERE REAL ESTATE CO. $1,375,000Pending5 beds 3 baths3,700 sq. ft.
3744 NE 165th Street, Lake Forest Park, WA 98155
MLS# 2480569Listed by: LAKE & COMPANY $5,488,640Active5 beds 6 baths5,205 sq. ft.
17765 Beach Drive Ne, Lake Forest Park, WA 98155
MLS# 2488800Listed by: KELLER WILLIAMS WEST SOUND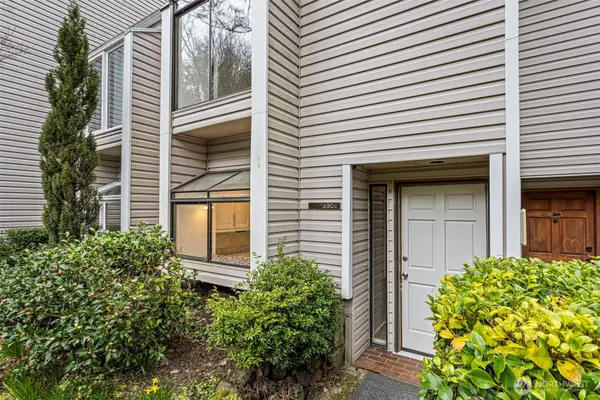 $370,000Active3 beds 2 baths1,352 sq. ft.
19805 15th Avenue Ne #3, Shoreline, WA 98155
MLS# 2488591Listed by: KELLER WILLIAMS EASTSIDE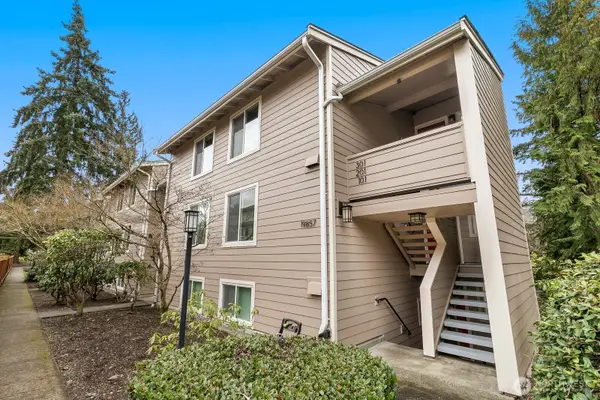 $239,950Active1 beds 1 baths715 sq. ft.
19857 25th Avenue Ne #105, Shoreline, WA 98155
MLS# 2486480Listed by: REAL BROKER LLC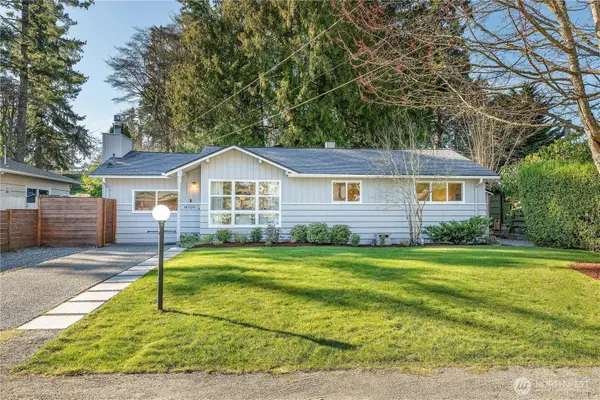 $695,000Pending3 beds 1 baths1,150 sq. ft.
18709 12th Ave Ne, Shoreline, WA 98155
MLS# 2486102Listed by: WINDERMERE REAL ESTATE MIDTOWN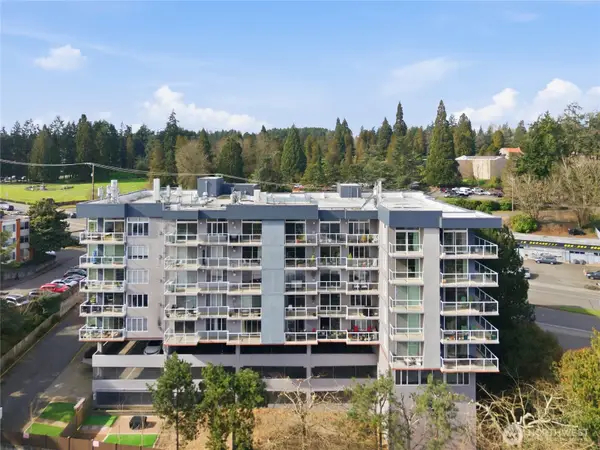 $420,000Active2 beds 1 baths960 sq. ft.
15020 Bothell Way Ne #406, Lake Forest Park, WA 98155
MLS# 2488343Listed by: SPECIALTY REAL ESTATE GROUP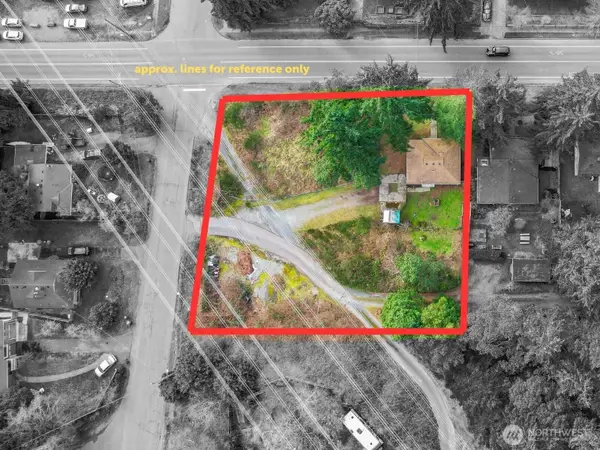 $930,000Active2 beds 1 baths700 sq. ft.
18804 10th Avenue Ne, Shoreline, WA 98155
MLS# 2487907Listed by: REAL BROKER LLC $835,000Pending3 beds 3 baths2,050 sq. ft.
832 NE 202nd Street, Shoreline, WA 98155
MLS# 2486847Listed by: WINDERMERE RE GREENWOOD $998,000Active5 beds 3 baths2,240 sq. ft.
15612 38th Avenue Ne, Lake Forest Park, WA 98155
MLS# 2487345Listed by: SPIRE ONE REALTY $650,000Active2 beds 1 baths960 sq. ft.
2552 NE 168th Street, Lake Forest Park, WA 98155
MLS# 2487058Listed by: HEATON DAINARD, LLC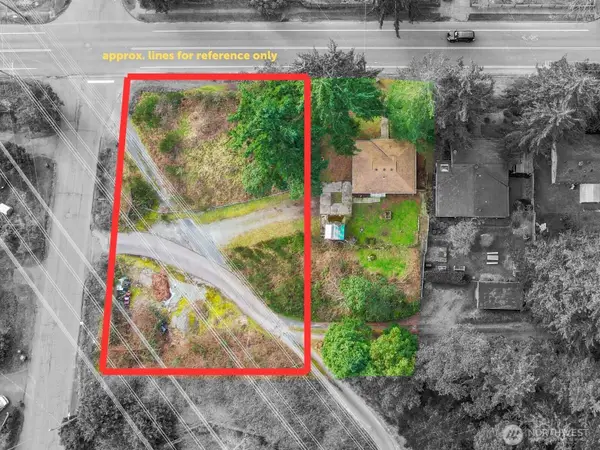 $300,000Active0.33 Acres
18800 10th Avenue Ne #1, Shoreline, WA 98155
MLS# 2485385Listed by: REAL BROKER LLC $630,000Active2 beds 1 baths700 sq. ft.
18804 10th Avenue Ne, Shoreline, WA 98155
MLS# 2485387Listed by: REAL BROKER LLC $749,950Pending3 beds 3 baths1,481 sq. ft.
18011 2nd Avenue Ne #A, Shoreline, WA 98155
MLS# 2485678Listed by: REALOGICS SOTHEBY'S INT'L RLTY $675,000Pending3 beds 2 baths1,270 sq. ft.
15548 9th Avenue Ne, Shoreline, WA 98155
MLS# 2484958Listed by: COLDWELL BANKER DANFORTH $985,000Pending4 beds 3 baths1,930 sq. ft.
19020 32nd Avenue Ne, Lake Forest Park, WA 98155
MLS# 2484570Listed by: JOHN L. SCOTT BOTHELL $1,325,000Pending3 beds 3 baths2,580 sq. ft.
16200 38th Avenue Ne, Lake Forest Park, WA 98155
MLS# 2484460Listed by: REAL PROPERTY ASSOCIATES $979,000Active3 beds 3 baths1,680 sq. ft.
15812 30 Avenue Ne, Shoreline, WA 98155
MLS# 2484898Listed by: BLUE DOT REAL ESTATE $750,000Pending4 beds 3 baths1,740 sq. ft.
3502 NE 204th Street, Lake Forest Park, WA 98155
MLS# 2484238Listed by: SASH REALTY $649,900Pending2 beds 1 baths950 sq. ft.
1011 NE 180th Street, Shoreline, WA 98155
MLS# 2484234Listed by: REXMONT REAL ESTATE $775,000Active9 beds 12 baths5,760 sq. ft.
1809 NE 170th Street, Shoreline, WA 98155
MLS# 2484089Listed by: PELLEGO, INC. $225,000Active1 beds 1 baths674 sq. ft.
18102 15th Avenue Ne #B210, Shoreline, WA 98155
MLS# 2478483Listed by: AGENCYONE $850,000Pending3 beds 2 baths1,630 sq. ft.
17545 12th Avenue Ne, Shoreline, WA 98155
MLS# 2481317Listed by: EVERY DOOR REAL ESTATE $1,249,000Active4 beds 3 baths2,840 sq. ft.
3210 NE 195th Street, Lake Forest Park, WA 98155
MLS# 2479029Listed by: KELLY RIGHT RE OF SEATTLE LLC $499,000Active2 beds 2 baths1,106 sq. ft.
15020 Bothell Way Ne #502, Lake Forest Park, WA 98155
MLS# 2481173Listed by: RE/MAX METRO REALTY, INC. $1,195,000Pending5 beds 3 baths2,640 sq. ft.
3718 NE 189th Place, Lake Forest Park, WA 98155
MLS# 2479007Listed by: WILSON REALTY EXCHANGE, INC. $362,500Active2 beds 2 baths910 sq. ft.
19230 Forest Park Drive Ne #H-327, Seattle, WA 98155
MLS# 2475778Listed by: ALPINE GROUP $775,000Active0.22 Acres
1809 NE 170th Street #3, Shoreline, WA 98155
MLS# 2476417Listed by: PELLEGO, INC.- Open Tue, 1 to 3pm
 $948,000Active3 beds 1 baths1,310 sq. ft.
17017 10th Avenue Ne, Shoreline, WA 98155
MLS# 2476086Listed by: LAKESHORE REALTY WEST LLC  $650,000Active4 beds 2 baths1,520 sq. ft.
16919 12th Place Ne, Shoreline, WA 98511
MLS# 2474991Listed by: EXP REALTY $649,950Active2 beds 2 baths1,236 sq. ft.
3511 NE 146th Place, Lake Forest Park, WA 98155
MLS# 2472566Listed by: ARIS360 $1,400,000Active0.59 Acres
1564 Serpentine Place, Shoreline, WA 98155
MLS# 2470749Listed by: JOHN L. SCOTT EVERETT $351,500Active2 beds 2 baths1,252 sq. ft.
17918 23rd Lane Ne #F201, Shoreline, WA 98155
MLS# 2471144Listed by: PORTICO REAL ESTATE $649,950Active3 beds 3 baths1,194 sq. ft.
18017 2nd Avenue Ne #B, Seattle, WA 98155
MLS# 2471542Listed by: REALOGICS SOTHEBY'S INT'L RLTY $899,000Active4 beds 4 baths2,088 sq. ft.
229 NE 185th Street, Shoreline, WA 98155
MLS# 2468667Listed by: REALOGICS SOTHEBY'S INT'L RLTY $310,000Pending2 beds 1 baths903 sq. ft.
19855 25th Avenue Ne #210, Shoreline, WA 98155
MLS# 2469027Listed by: WINDERMERE REAL ESTATE/PSR INC $900,000Active3 beds 1 baths1,667 sq. ft.
16532 21st Avenue Ne, Shoreline, WA 98155
MLS# 2468155Listed by: CLASEN REAL ESTATE ADVISORS $790,000Pending3 beds 2 baths3,940 sq. ft.
2001 NE 177th Street, Shoreline, WA 98155
MLS# 2465602Listed by: WPI REAL ESTATE SERVICES, INC. $175,000Active0.63 Acres
194 Xx Forest Park Drive Ne, Lake Forest Park, WA 98155
MLS# 2468226Listed by: RE/MAX ELITE $845,000Pending3 beds 3 baths1,800 sq. ft.
15610 5th Avenue Ne #C, Shoreline, WA 98155
MLS# 2467334Listed by: SKYLINE PROPERTIES, INC. $324,950Active2 beds 2 baths934 sq. ft.
18100 15th Avenue Ne #C218, Shoreline, WA 98155
MLS# 2465450Listed by: SOUND POINT REAL ESTATE LLC $859,000Active4 beds 4 baths2,120 sq. ft.
14671 36th Court Ne, Lake Forest Park, WA 98155
MLS# 2465886Listed by: REALOGICS SOTHEBY'S INT'L RLTY $449,000Pending2 beds 1 baths900 sq. ft.
19028 15th Avenue Ne, Shoreline, WA 98155
MLS# 2465437Listed by: HOMESMART REAL ESTATE ASSOC $299,000Active0.54 Acres
2415 NE 178th Street #13-14, Shoreline, WA 98155
MLS# 2463514Listed by: SKYLINE PROPERTIES, INC.- New
 $931,990Active3 beds 3 baths1,670 sq. ft.
321 Ne 155th St (homesite #58), Shoreline, WA 98155
MLS# 2497400Listed by: WINDERMERE REAL ESTATE/EAST - New
 $933,990Active3 beds 3 baths1,670 sq. ft.
337 Ne 155th St (homesite #28), Shoreline, WA 98155
MLS# 2497405Listed by: WINDERMERE REAL ESTATE/EAST - New
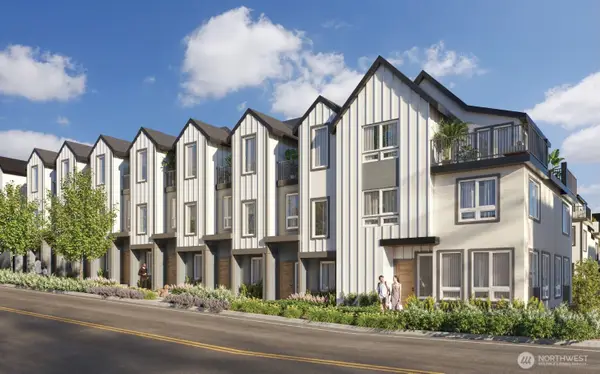 $853,990Active3 beds 3 baths1,506 sq. ft.
337 Ne 155th St (homesite #21), Shoreline, WA 98155
MLS# 2497524Listed by: WINDERMERE REAL ESTATE/EAST  $850,000Active2 beds 1 baths770 sq. ft.
14818 5th Avenue Ne, Shoreline, WA 98155
MLS# 2461543Listed by: MLS4OWNERS.COM $685,000Pending2 beds 3 baths1,680 sq. ft.
15822 26th Avenue Ne, Shoreline, WA 98155
MLS# 2458041Listed by: EXP REALTY $750,000Pending1 beds 3 baths1,510 sq. ft.
18017 2nd Avenue Ne #A, Shoreline, WA 98155
MLS# 2457304Listed by: REALOGICS SOTHEBY'S INT'L RLTY $220,000Active1 beds 1 baths715 sq. ft.
19851 25th Avenue Ne #204, Shoreline, WA 98155
MLS# 2456443Listed by: INTEGRIS REAL ESTATE $1,989,000Active5 beds 5 baths5,183 sq. ft.
16040 36th Avenue Ne, Lake Forest Park, WA 98155
MLS# 2475527Listed by: THE PREVIEW GROUP
 $750,000Active4 beds 2 baths1,330 sq. ft.
821 195th Street, Shoreline, WA 89155
MLS# 2447480Listed by: CENTURY 21 NORTH HOMES REALTY $600,000Pending1 beds 1 baths1,270 sq. ft.
1728 NE 148th Street, Shoreline, WA 98155
MLS# 2442134Listed by: WINDERMERE REAL ESTATE MIDTOWN $1,925,000Active5 beds 6 baths3,503 sq. ft.
16614 15th Avenue Ne, Shoreline, WA 98155
MLS# 2440142Listed by: REALOGICS SOTHEBY'S INT'L RLTY $2,850,000Active4 beds 1 baths1,480 sq. ft.
1222 NE 180th Street, Shoreline, WA 98155
MLS# 2468017Listed by: WINDERMERE RE GREENWOOD $1,900,000Pending3 beds 2 baths2,340 sq. ft.
19044 35th Avenue Ne, Lake Forest Park, WA 98155
MLS# 2434716Listed by: WINDERMERE REAL ESTATE MIDTOWN $1,500,000Pending5 beds 3 baths2,320 sq. ft.
19331 37th Avenue Ne, Lake Forest Park, WA 98155
MLS# 2422737Listed by: KELLER WILLIAMS REALTY BOTHELL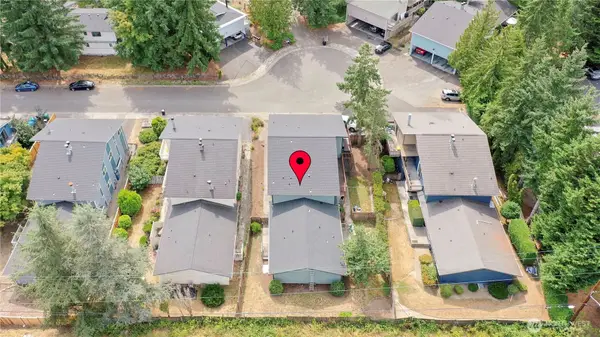 $1,299,950Active-- beds -- baths3,382 sq. ft.
2224 NE 197th Place, Shoreline, WA 98155
MLS# 2428924Listed by: WINDERMERE REAL ESTATE JS $995,000Pending3 beds 2 baths2,050 sq. ft.
17551 12th Avenue Ne, Shoreline, WA 98155
MLS# 2424564Listed by: KELLER WILLIAMS REALTY PS $895,000Active3 beds 2 baths1,380 sq. ft.
17563 12th Avenue Ne, Shoreline, WA 98155
MLS# 2425842Listed by: KELLER WILLIAMS REALTY PS $600,000Active0.24 Acres
1434 NE 166th Court #2, Shoreline, WA 98155
MLS# 2424648Listed by: REAL BROKER LLC $599,900Active2 beds 1 baths880 sq. ft.
14714 NE 31st Ave. N.e. Ave, Shoreline, WA 98155
MLS# 25-2295Listed by: NEXTMOVE REALTY $2,100,000Active0.23 Acres
18510 8th Avenue Ne, Shoreline, WA 98155
MLS# 2421225Listed by: WINDERMERE R.E. SHORELINE $2,500,000Active0.27 Acres
18516 8th Avenue Ne, Shoreline, WA 98155
MLS# 2420152Listed by: WINDERMERE R.E. SHORELINE $11,500,000Active1.94 Acres
18340 3rd Avenue Ne, Shoreline, WA 98155
MLS# 2377318Listed by: WESTLAKE ASSOCIATES, INC. $1,745,000Active3 beds 4 baths3,990 sq. ft.
19749 53rd Avenue Ne, Lake Forest Park, WA 98155
MLS# 2490106Listed by: WINDERMERE RE SOUTH SOUND, INC $779,000Active3 beds 3 baths1,742 sq. ft.
18331 1st Avenue Ne, Shoreline, WA 98155
MLS# 2482219Listed by: REDDY REAL ESTATE TEAM $1,140,000Active2 beds 1 baths790 sq. ft.
14552 5th Avenue Ne, Shoreline, WA 98155
MLS# 2200516Listed by: EXP REALTY $625,000Active3 beds 1 baths980 sq. ft.
18926 5th Avenue Ne, Shoreline, WA 98155
MLS# 1105921Listed by: WINDERMERE R.E. SHORELINE
Local realty services provided by:CENTURY 21 Lund, Realtors, CENTURY 21 Tri-Cities
Listings courtesy of Northwest MLS as distributed by MLS GRID. Based on information submitted to the MLS GRID as of March 30, 2026. All data is obtained from various sources and may not have been verified by broker or MLS GRID. Supplied Open House Information is subject to change without notice. All information should be independently reviewed and verified for accuracy. Properties may or may not be listed by the office/agent presenting the information. Listing information is provided for consumers' personal, non-commercial use, solely to identify prospective properties for potential purchase; all other use is strictly prohibited and may violate relevant federal and state law. Information deemed reliable but not guaranteed. Copyright © 2026 MLS GRID. All Rights Reserved.
Popular searches near 98155
Popular neighborhoods near 98155
- Ballinger, Seattle homes for sale
- Briarcrest, Seattle homes for sale
- Cedar Park, Seattle homes for sale
- Cedar Terrace, Mountlake Terrace homes for sale
- Echo Lake, Seattle homes for sale
- Gateway, Mountlake Terrace homes for sale
- Highland Terrace, Seattle homes for sale
- Hillwood, Seattle homes for sale
- Inglewood, Kenmore homes for sale
- Lake Ballinger, Mountlake Terrace homes for sale
- Meridian Park, Seattle homes for sale
- North City, Seattle homes for sale
- Olympic Hills, Seattle homes for sale
- Parkwood, Seattle homes for sale
- Pinehurst, Seattle homes for sale
- Richmond Highlands, Seattle homes for sale
- Ridgecrest, Seattle homes for sale
- Sound View, Edmonds homes for sale
- Town Center, Mountlake Terrace homes for sale
- Westminster Triangle, Seattle homes for sale
Counties near Seattle, 98155
- Chelan County homes for sale
- Clallam County homes for sale
- Grays Harbor County homes for sale
- Island County homes for sale
- Jefferson County homes for sale
- King County homes for sale
- Kitsap County homes for sale
- Kittitas County homes for sale
- Lewis County homes for sale
- Mason County homes for sale
- Pierce County homes for sale
- San Juan County homes for sale
- Skagit County homes for sale
- Snohomish County homes for sale
- Thurston County homes for sale
- Whatcom County homes for sale
Protect your home and budget from life's surprises with an Assurant Home Warranty, backed by a partner that supports you through every step of homeownership. Explore Plans.
©2026 Century 21 Real Estate LLC. All rights reserved. CENTURY 21®, the CENTURY 21 Logo and C21® are service marks owned by Century 21 Real Estate LLC. Century 21 Real Estate LLC fully supports the principles of the Fair Housing Act and the Equal Opportunity Act. Each office is independently owned and operated. Listing information is deemed reliable but not guaranteed accurate.