- Crete Precinct properties for sale
- Denton properties for sale
- Denton Precinct properties for sale
- Dorchester properties for sale
- Dorchester Precinct properties for sale
- Dwight properties for sale
- Elk properties for sale
- Garland properties for sale
- Lincoln Precinct properties for sale
- Malcolm properties for sale
- Middle Creek properties for sale
- Milford properties for sale
- Oak properties for sale
- Oak Creek properties for sale
- Raymond properties for sale
- Richardson properties for sale
- Seward properties for sale
- Utica properties for sale
- Valparaiso properties for sale
- West Oak properties for sale
68434, NE - homes for sale
36 of 36 results displayed
- New
 $248,750Active3 beds 2 baths2,021 sq. ft.
306 Cherry Lane, Seward, NE 68434
MLS# 22535163Listed by: WOODS BROS REALTY - New
 $189,900Active5.1 Acres
LOT 6 Waverly Road, Seward, NE 68434
MLS# 22535132Listed by: MIDWEST LAND GROUP LLC - Open Sun, 1 to 2:30pm
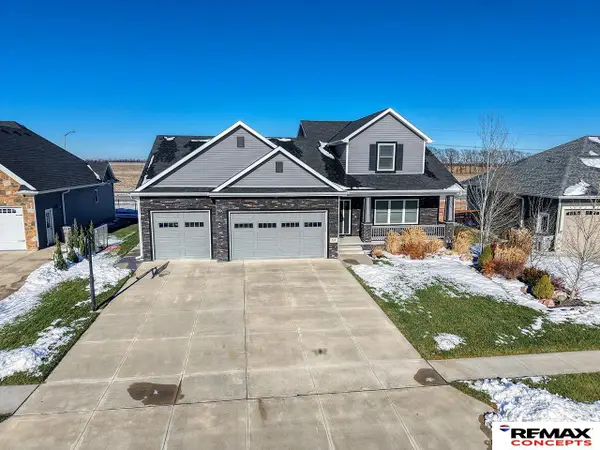 $499,900Active4 beds 4 baths3,216 sq. ft.
228 Knotty Pine Lane, Seward, NE 68434
MLS# 22534404Listed by: REMAX CONCEPTS  $489,000Active4 beds 3 baths5,061 sq. ft.
1018 N 1st Street, Seward, NE 68434
MLS# 22534076Listed by: WOODS BROS REALTY $369,000Active3 beds 3 baths2,016 sq. ft.
916 Hillcrest Drive, Seward, NE 68434
MLS# 22534032Listed by: WOODS BROS REALTY $139,000Pending3 beds 2 baths1,809 sq. ft.
406 N 7th Street, Seward, NE 68434
MLS# 22534006Listed by: KELLY REALTY LLC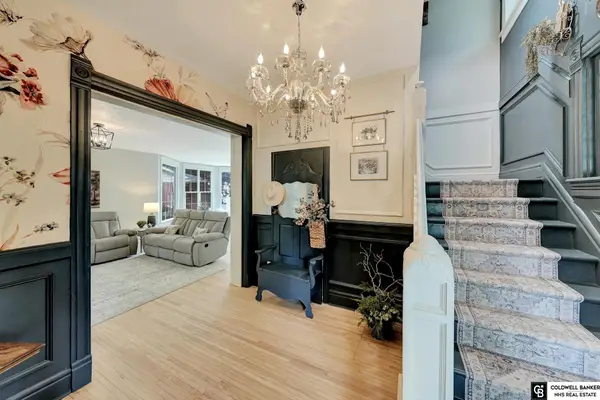 $499,999Active6 beds 5 baths4,656 sq. ft.
149 N 1st Street, Seward, NE 68434
MLS# 22533721Listed by: COLDWELL BANKER NHS R E $297,500Pending3 beds 3 baths2,260 sq. ft.
1753 N Columbia Avenue, Seward, NE 68434
MLS# 22533437Listed by: NEXTHOME SIGNATURE REAL ESTATE $290,000Active4 beds 2 baths1,955 sq. ft.
1052 Kolterman Avenue, Seward, NE 68434
MLS# 22533165Listed by: BHHS AMBASSADOR REAL ESTATE $289,000Active3 beds 2 baths2,208 sq. ft.
1127 N 5th Street, Seward, NE 68434
MLS# 22533336Listed by: WOODS BROS REALTY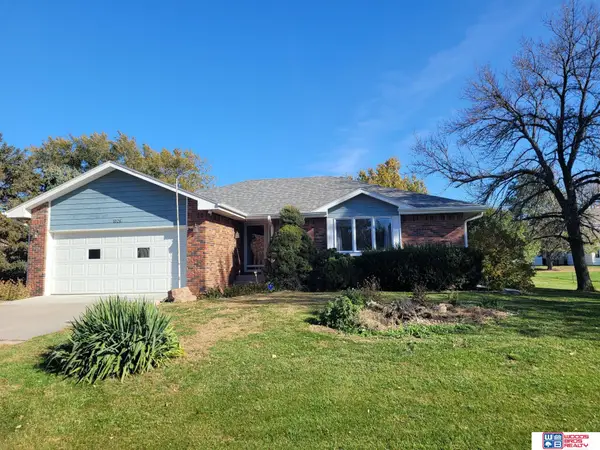 $298,000Active2 beds 2 baths1,658 sq. ft.
1026 Frances Street, Goehner, NE 68364
MLS# 22532468Listed by: WOODS BROS REALTY $185,000Active3 beds 1 baths1,053 sq. ft.
178 E Roberts St, Seward, NE 68434
MLS# 20250674Listed by: KOBZA AG AND HOME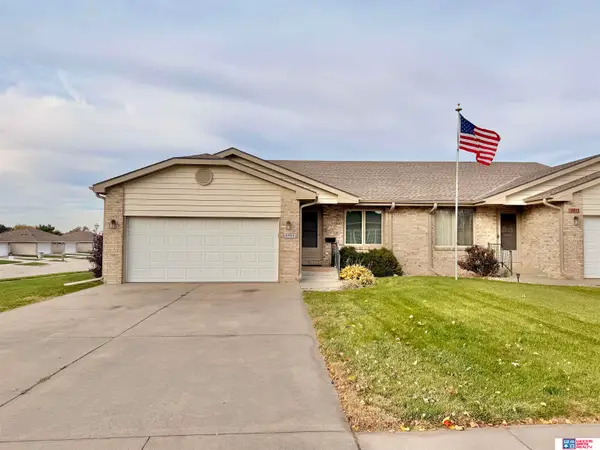 $289,000Active3 beds 3 baths2,124 sq. ft.
1911 N 4th Street, Seward, NE 68434
MLS# 22532002Listed by: WOODS BROS REALTY $284,500Active3 beds 2 baths2,481 sq. ft.
445 N 1st Street, Seward, NE 68434
MLS# 22531612Listed by: WOODS BROS REALTY $335,000Active3 beds 2 baths1,872 sq. ft.
695 Graham Park Drive, Seward, NE 68434
MLS# 22530238Listed by: WOODS BROS REALTY $249,000Active3 beds 2 baths1,384 sq. ft.
146 Jackson Avenue, Seward, NE 68434
MLS# 22530757Listed by: WOODS BROS REALTY $359,900Pending4 beds 3 baths2,265 sq. ft.
2117 N 1st Street, Seward, NE 68434-6018
MLS# 22530681Listed by: BETTER HOMES AND GARDENS R.E. $155,900Active3 beds 2 baths1,947 sq. ft.
545 N 6th Street, Seward, NE 68434
MLS# 22530571Listed by: NEW CONCEPT REALTY GROUP- Open Sun, 1 to 2:30pm
 $489,900Active5 beds 4 baths3,016 sq. ft.
225 Knotty Pine Lane, Seward, NE 68434
MLS# 22534107Listed by: REMAX CONCEPTS  $298,900Active3 beds 3 baths2,164 sq. ft.
435 Church Street, Seward, NE 68434
MLS# 22528148Listed by: COLDWELL BANKER NHS R E $249,500Active2 beds 1 baths1,210 sq. ft.
323 N 4th Street, Seward, NE 68434
MLS# 22527472Listed by: WOODS BROS REALTY $393,210Active3 beds 2 baths1,483 sq. ft.
528 Woodsage Road, Seward, NE 68434
MLS# 22527202Listed by: REMAX CONCEPTS $479,000Active4 beds 3 baths3,247 sq. ft.
1097 Willow Avenue, Seward, NE 68434
MLS# 22528857Listed by: KELLER WILLIAMS LINCOLN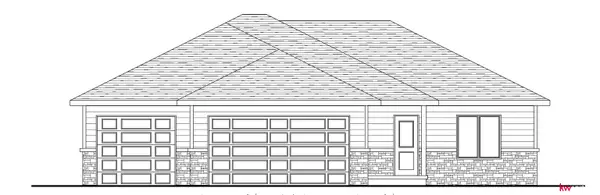 $450,000Pending4 beds 3 baths2,536 sq. ft.
538 Woodsage Road, Seward, NE 68434
MLS# 22528859Listed by: KELLER WILLIAMS LINCOLN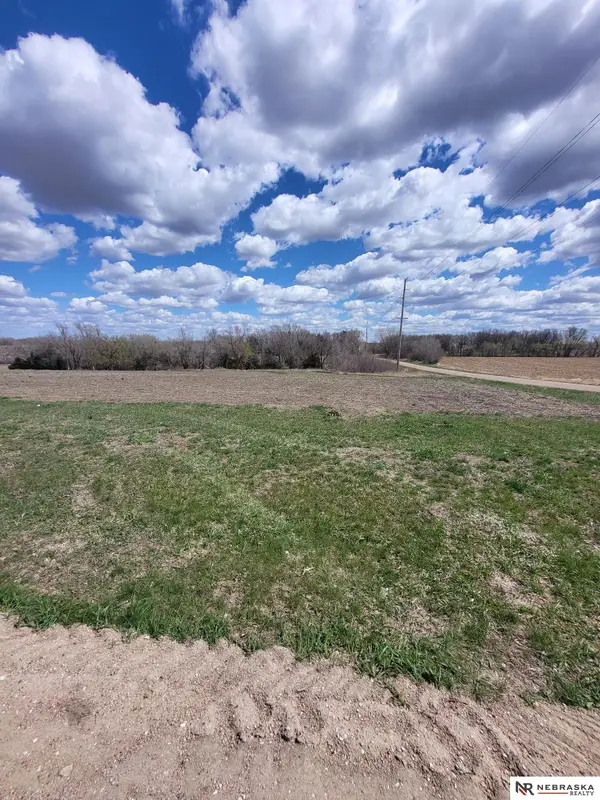 $156,000Active5.01 Acres
1826 238 Road, Seward, NE 68434
MLS# 22526320Listed by: NEBRASKA REALTY $299,000Active4 beds 2 baths1,978 sq. ft.
2040 Star Street, Seward, NE 68434
MLS# 22526010Listed by: WOODS BROS REALTY $275,000Active3 beds 2 baths2,139 sq. ft.
305 S 11th Street, Seward, NE 68434
MLS# 22525736Listed by: WOODS BROS REALTY $465,000Active3 beds 4 baths4,020 sq. ft.
54 Lincoln Street, Seward, NE 68434
MLS# 22524348Listed by: WOODS BROS REALTY- Open Sat, 4 to 5pm
 $279,000Active4 beds 2 baths1,912 sq. ft.
736 N 7th Street, Seward, NE 68434
MLS# 22522431Listed by: WOODS BROS REALTY  $315,000Active4 beds 3 baths2,620 sq. ft.
928 N 12th Street, Seward, NE 68434
MLS# 22518639Listed by: WOODS BROS REALTY $195,000Active5.32 Acres
LOT 3 252 County Road, Seward, NE 68434
MLS# 22525483Listed by: MIDWEST LAND GROUP LLC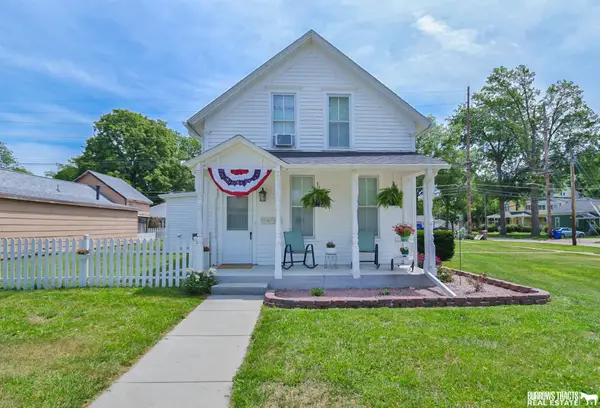 $288,000Active3 beds 2 baths1,843 sq. ft.
410 N 3rd Street, Seward, NE 68434
MLS# 22516667Listed by: BURROWS TRACTS REAL ESTATE $33,900Pending0 Acres
TBD N 8th Street, Seward, NE 68434
MLS# 22509001Listed by: COLDWELL BANKER NHS R E $515,000Active5 beds 3 baths2,841 sq. ft.
833 Ironwood Drive, Seward, NE 68434
MLS# 22324147Listed by: RE/MAX CONCEPTS $500,000Active4 beds 3 baths3,520 sq. ft.
324 N 10 Street, Seward, NE 68434
MLS# 22321252Listed by: SIMPLICITY REAL ESTATE $150,000Pending4 beds 2 baths1,149 sq. ft.
413 S 1 Street, Seward, NE 68434
MLS# 22317482Listed by: NEBRASKA REALTY
Local realty services provided by:CENTURY 21 Century Real Estate, CENTURY 21 Realty Team
Popular searches near 68434
Popular neighborhoods near 68434
- Arnold Heights, Lincoln properties for sale
- Autumn Wood, Lincoln properties for sale
- Belmont, Lincoln properties for sale
- Bicentennial Estates, Lincoln properties for sale
- Capitol View, Lincoln properties for sale
- Clinton, Lincoln properties for sale
- Downtown Lincoln, Lincoln properties for sale
- Everett, Lincoln properties for sale
- Hawley, Lincoln properties for sale
- Highlands, Lincoln properties for sale
- Indian Village, Lincoln properties for sale
- Irvingdale, Lincoln properties for sale
- Near South, Lincoln properties for sale
- North Bottoms, Lincoln properties for sale
- Oak Hills, Lincoln properties for sale
- South Salt Creek, Lincoln properties for sale
- Sunset Acres, Lincoln properties for sale
- West A, Lincoln properties for sale
- Woods Park, Lincoln properties for sale
- Yankee Hill, Lincoln properties for sale
Counties near Seward, 68434
- Butler County properties for sale
- Cass County properties for sale
- Clay County properties for sale
- Colfax County properties for sale
- Dodge County properties for sale
- Fillmore County properties for sale
- Gage County properties for sale
- Hamilton County properties for sale
- Jefferson County properties for sale
- Lancaster County properties for sale
- Merrick County properties for sale
- Nance County properties for sale
- Otoe County properties for sale
- Platte County properties for sale
- Polk County properties for sale
- Saline County properties for sale
- Sarpy County properties for sale
- Saunders County properties for sale
- Seward County properties for sale
- York County properties for sale
©2025 Century 21 Real Estate LLC. All rights reserved. CENTURY 21®, the CENTURY 21 Logo and C21® are service marks owned by Century 21 Real Estate LLC. Century 21 Real Estate LLC fully supports the principles of the Fair Housing Act and the Equal Opportunity Act. Each office is independently owned and operated. Listing information is deemed reliable but not guaranteed accurate.
©2025 Century 21 Real Estate LLC. All rights reserved. CENTURY 21®, the CENTURY 21 Logo and C21® are service marks owned by Century 21 Real Estate LLC. Century 21 Real Estate LLC fully supports the principles of the Fair Housing Act and the Equal Opportunity Act. Each office is independently owned and operated. Listing information is deemed reliable but not guaranteed accurate.