- Anderson homes for sale
- Benton homes for sale
- Brandon homes for sale
- Brandon Township homes for sale
- Crooks homes for sale
- Delapre homes for sale
- Harrisburg homes for sale
- La Valley homes for sale
- Mapleton homes for sale
- Renner homes for sale
- Shindler homes for sale
- Sioux Falls city homes for sale
- Sioux Falls homes for sale
- Sioux Falls homes for sale
- Split Rock homes for sale
- Springdale homes for sale
- Sverdrup homes for sale
- Tea homes for sale
- Valley Springs Township homes for sale
- Wayne homes for sale
57103, SD - homes for sale
138 of 138 results displayed
- New
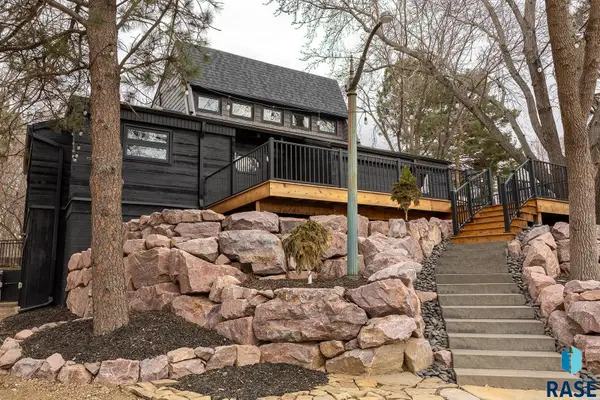
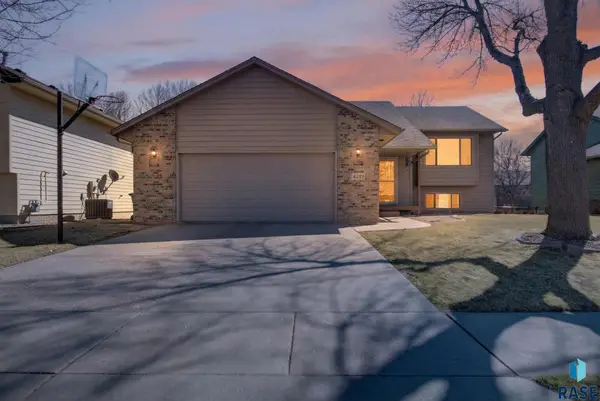 $355,000Active3 beds 2 baths1,750 sq. ft.
4219 E 37th St, Sioux Falls, SD 57103
MLS# 22602173Listed by: AMY STOCKBERGER REAL ESTATE - New
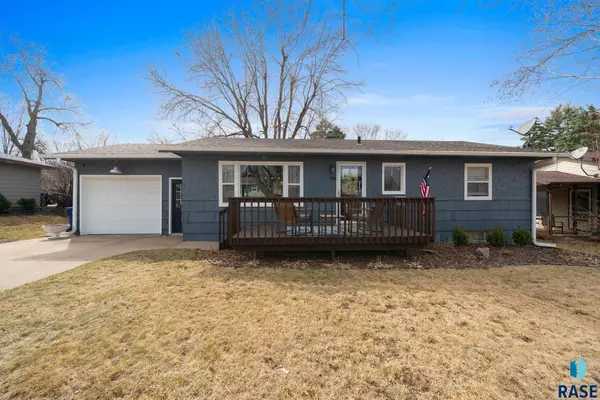
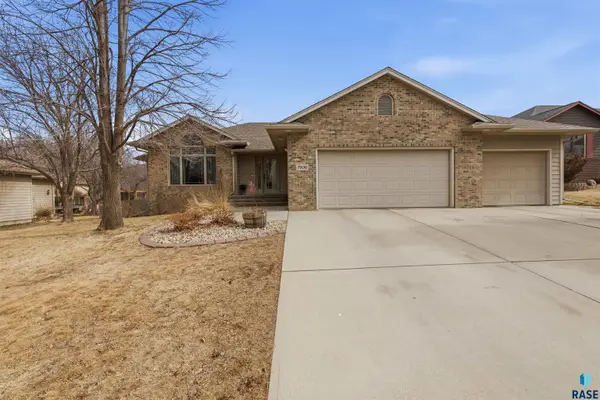
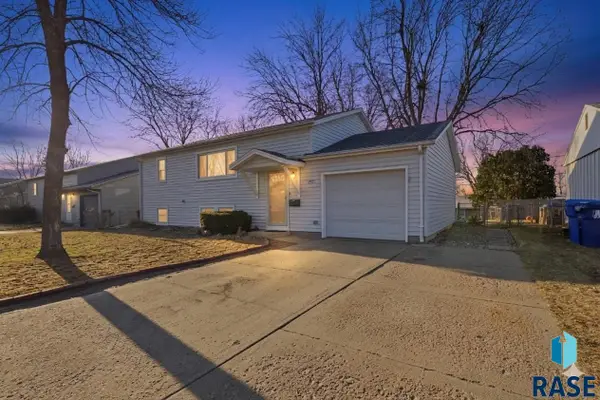 $290,000Active3 beds 2 baths1,686 sq. ft.
3921 E Claudette Dr, Sioux Falls, SD 57103
MLS# 22602134Listed by: AMERI/STAR REAL ESTATE, INC. - New
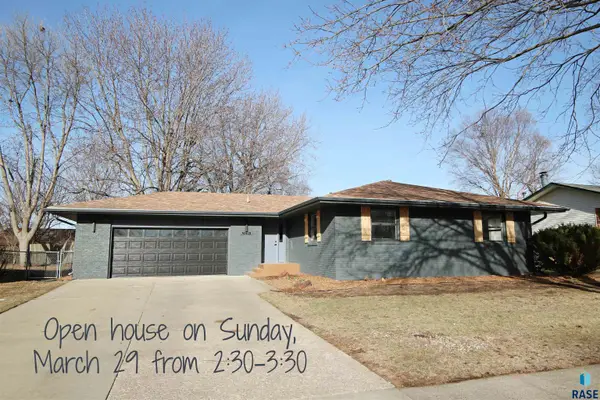
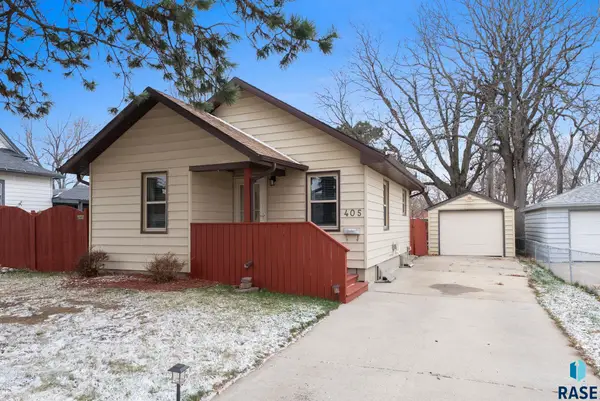
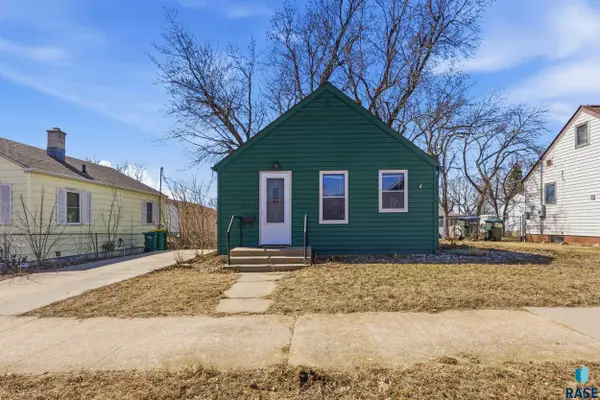 $169,900Active2 beds 1 baths640 sq. ft.
507 S Conklin Ave, Sioux Falls, SD 57103
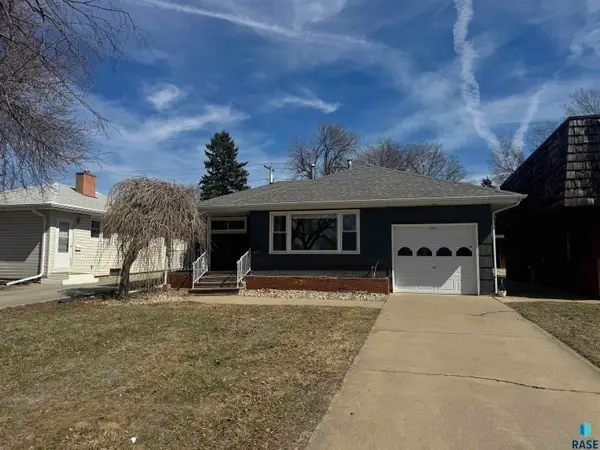
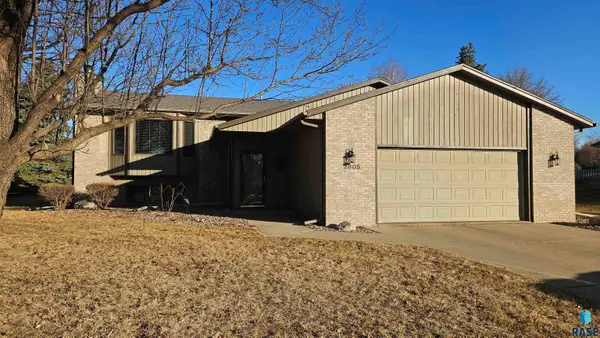
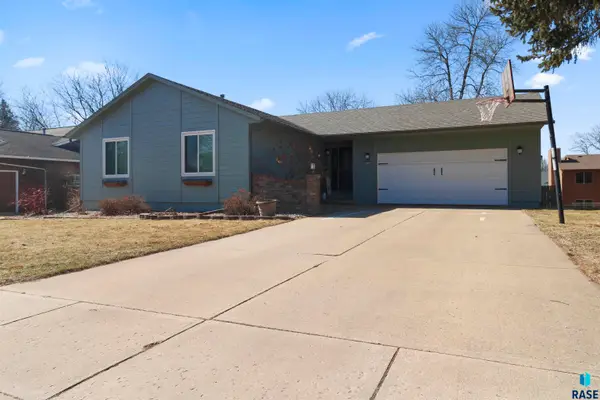
MLS# 22602103Listed by: AMERI/STAR REAL ESTATE, INC. 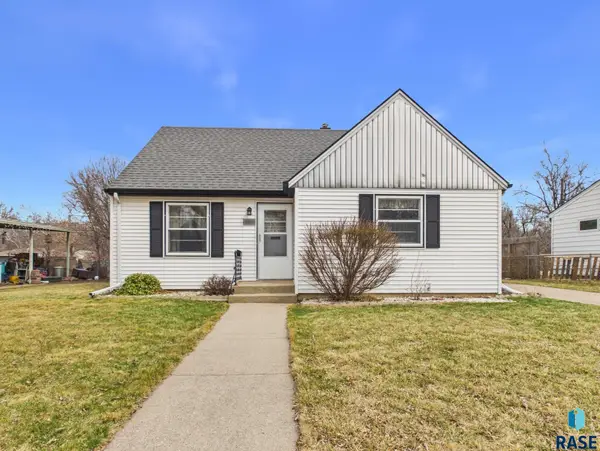 $197,000Pending3 beds 1 baths1,578 sq. ft.
636 N Leadale Ave, Sioux Falls, SD 57103
MLS# 22602058Listed by: HEGG, REALTORS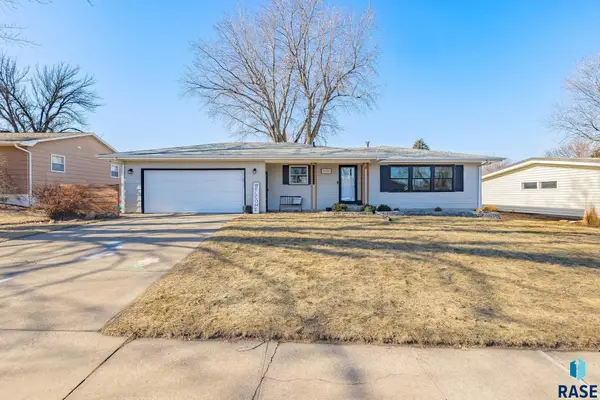 $409,000Pending5 beds 3 baths2,044 sq. ft.
4301 S Glenview Rd, Sioux Falls, SD 57103
MLS# 22602053Listed by: VELDHOUSE COMPANIES LLC- New
 $310,000Active4 beds 1 baths1,610 sq. ft.
709 S Annway Dr, Sioux Falls, SD 57103
MLS# 22602046Listed by: KELLER WILLIAMS REALTY SIOUX FALLS 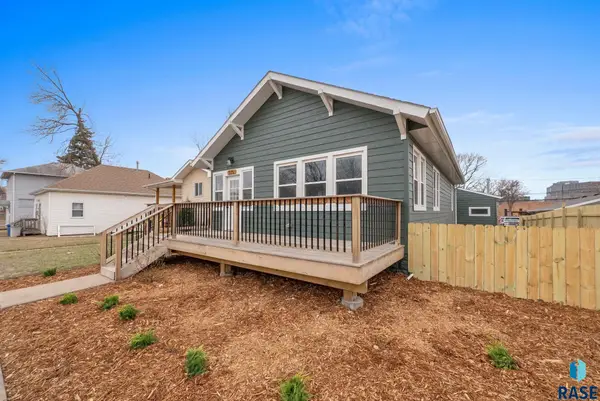 $315,000Pending4 beds 2 baths1,681 sq. ft.
515 Nesmith Ave, Sioux Falls, SD 57103
MLS# 22602035Listed by: EXP REALTY- SF-ALLEN EDGE TEAM- New
 $209,900Active2 beds 1 baths1,616 sq. ft.
412 S Chicago Ave, Sioux Falls, SD 57103
MLS# 22602036Listed by: ALPINE RESIDENTIAL  $229,900Pending2 beds 1 baths980 sq. ft.
1025 S Wayland Ave, Sioux Falls, SD 57103
MLS# 22602029Listed by: EXP REALTY- SF-ALLEN EDGE TEAM- Open Wed, 4 to 6pmNew
 $650,000Active3 beds 3 baths2,430 sq. ft.
2320 S Southeastern Ave, Sioux Falls, SD 57103
MLS# 22602012Listed by: REAL BROKER LLC - New
 $529,900Active5 beds 3 baths3,340 sq. ft.
3508 S Judy Ave, Sioux Falls, SD 57103
MLS# 22601972Listed by: ALPINE RESIDENTIAL - New
 $425,000Active3 beds 3 baths2,240 sq. ft.
4413 S Lewis Ave, Sioux Falls, SD 57103
MLS# 22601960Listed by: HEGG, REALTORS - New
 $399,900Active3 beds 2 baths2,101 sq. ft.
2805 S Whetstone Cir, Sioux Falls, SD 57103
MLS# 22601958Listed by: BERKSHIRE HATHAWAY HOMESERVICES MIDWEST REALTY - SIOUX FALLS 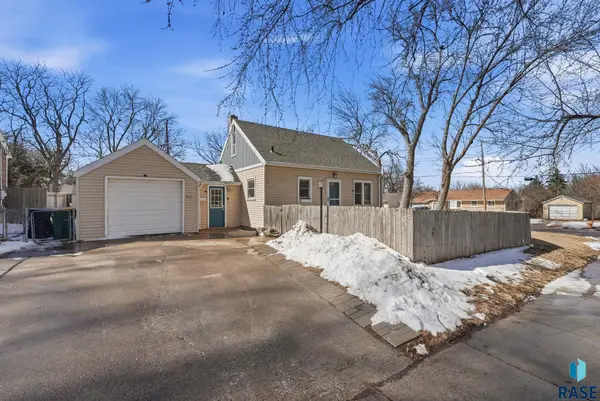 $265,000Active3 beds 2 baths1,433 sq. ft.
519 N Saint Paul Ave, Sioux Falls, SD 57103
MLS# 22601942Listed by: HOME MATCH REALTY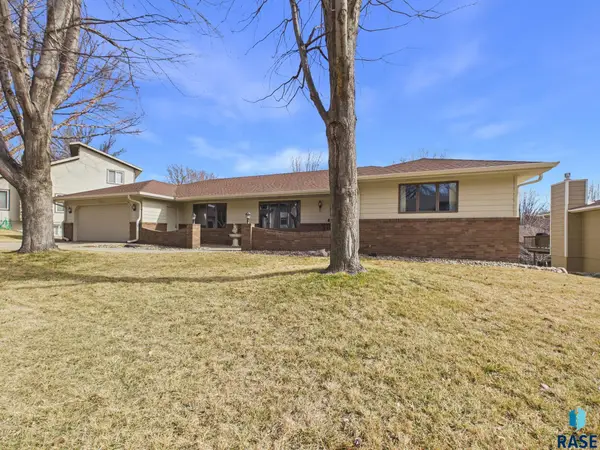 $485,000Pending3 beds 4 baths3,196 sq. ft.
2408 E Stanton Dr, Sioux Falls, SD 57103
MLS# 22601897Listed by: HEGG, REALTORS- Open Sat, 2:30 to 3:30pm
 $259,000Active4 beds 2 baths1,469 sq. ft.
1912 E Spruce St, Sioux Falls, SD 57103
MLS# 22601881Listed by: EXP REALTY - SF ALLEN TEAM  $147,500Pending2 beds 2 baths1,427 sq. ft.
609 N Sherman Ave, Sioux Falls, SD 57103
MLS# 22601875Listed by: WESTRA AUCTION, LLC $349,900Pending2 beds 2 baths1,231 sq. ft.
1108 N Mossy Oak Ave, Sioux Falls, SD 57103
MLS# 22601865Listed by: AXEN REALTY LLC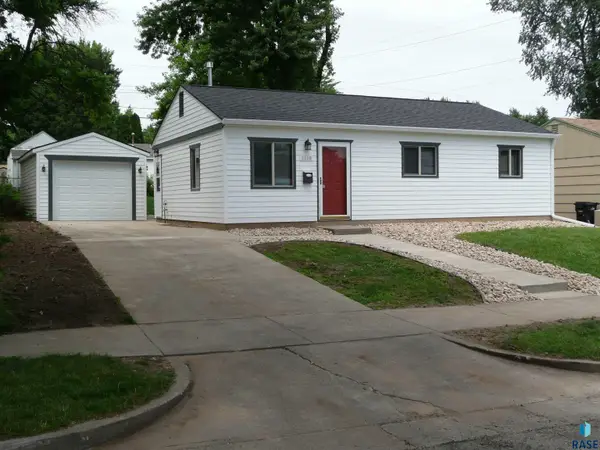 $220,000Active3 beds 1 baths1,025 sq. ft.
3008 E 21st St, Sioux Falls, SD 57103
MLS# 22601859Listed by: EXP REALTY - SF ALLEN TEAM $289,900Active3 beds 2 baths1,488 sq. ft.
1507 N Highland Ave, Sioux Falls, SD 57103
MLS# 22601828Listed by: REAL BROKER LLC $375,000Pending4 beds 2 baths1,746 sq. ft.
2804 S Melanie Ln, Sioux Falls, SD 57103
MLS# 22601825Listed by: VELDHOUSE COMPANIES LLC $210,000Active-- beds -- baths1,679 sq. ft.
310 N Sherman Ave, Sioux Falls, SD 57103
MLS# 22601823Listed by: MALONEY REAL ESTATE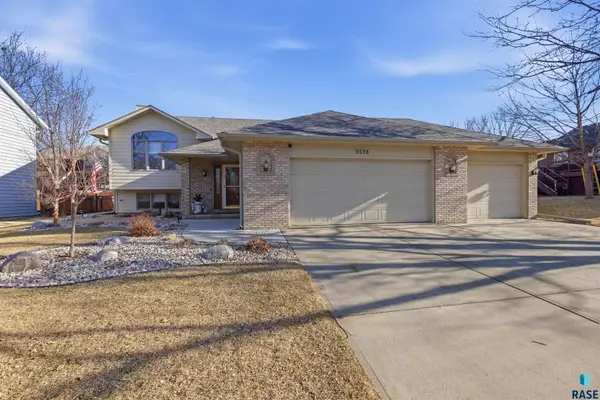 $444,900Active4 beds 3 baths2,398 sq. ft.
3518 S Matthew Dr, Sioux Falls, SD 57103
MLS# 22601808Listed by: ALPINE RESIDENTIAL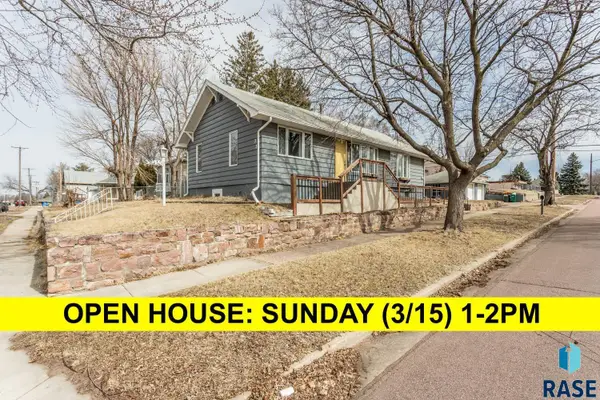 $239,900Pending4 beds 2 baths1,780 sq. ft.
330 S Chicago Ave, Sioux Falls, SD 57103
MLS# 22601797Listed by: FALLS REAL ESTATE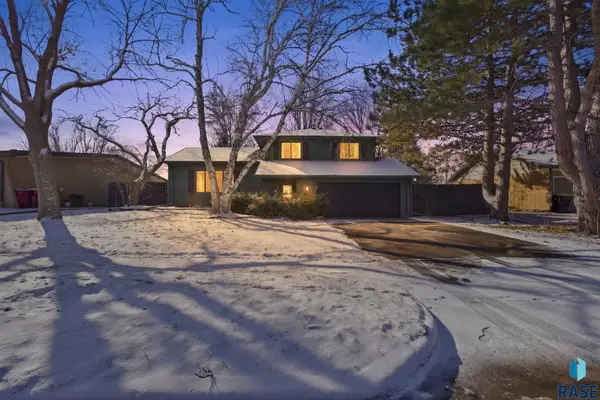 $355,900Pending3 beds 3 baths2,036 sq. ft.
1509 E 54th St, Sioux Falls, SD 57103
MLS# 22601777Listed by: AMY STOCKBERGER REAL ESTATE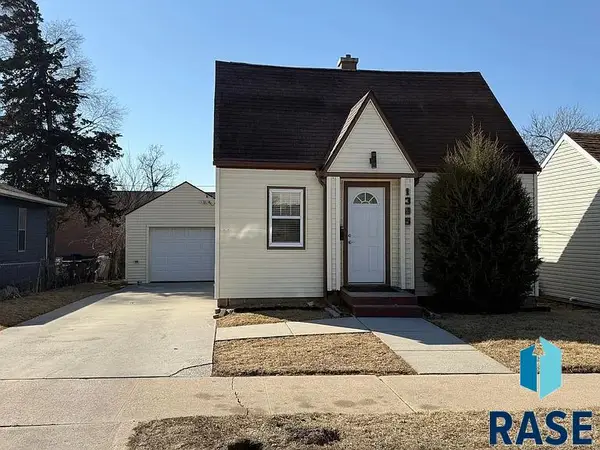 $170,000Active1 beds 1 baths690 sq. ft.
1305 E 12th St, Sioux Falls, SD 57103
MLS# 22601779Listed by: EXP REALTY - SF ALLEN TEAM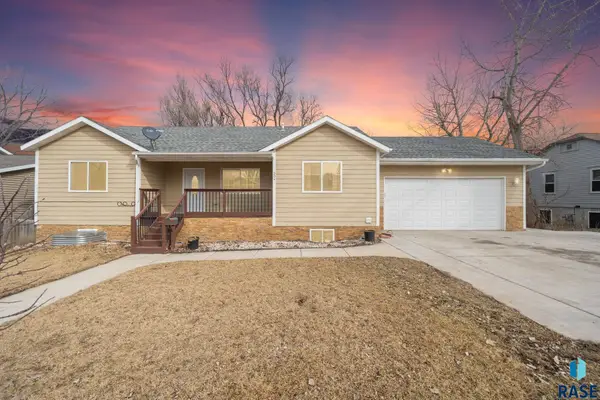 $325,000Pending5 beds 3 baths2,194 sq. ft.
904 N Highland Ave, Sioux Falls, SD 57103
MLS# 22601773Listed by: CASA REYNOZA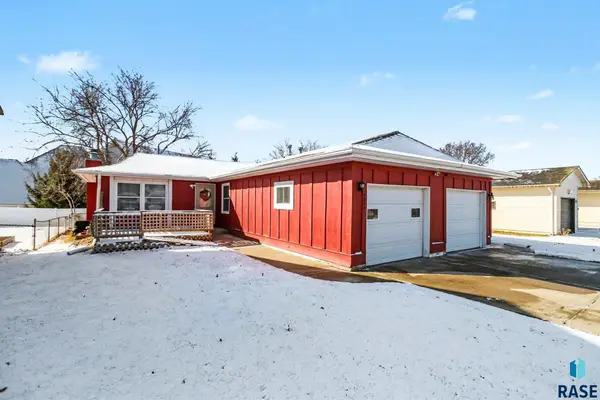 $254,500Active3 beds 2 baths1,636 sq. ft.
2815 E Klondike Trl, Sioux Falls, SD 57103
MLS# 22601774Listed by: HEGG, REALTORS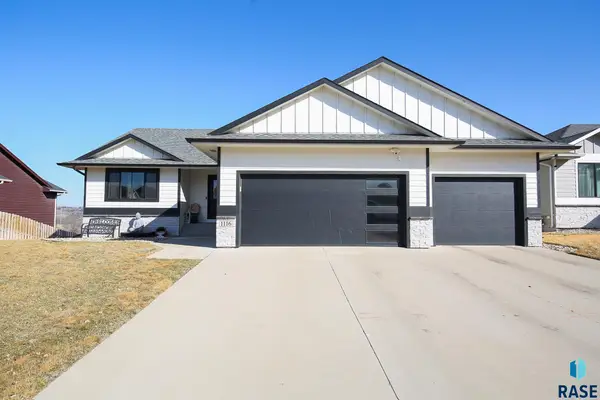 $475,000Active4 beds 3 baths2,351 sq. ft.
1116 N Archer Dr, Sioux Falls, SD 57103
MLS# 22601674Listed by: BERKSHIRE HATHAWAY HOMESERVICES MIDWEST REALTY - TEA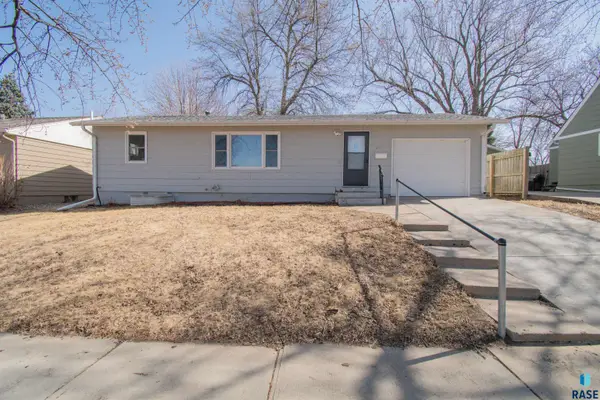 $299,900Active4 beds 2 baths1,665 sq. ft.
600 S Sneve Ave, Sioux Falls, SD 57103
MLS# 22601650Listed by: THE EXPERIENCE REAL ESTATE $327,900Pending-- beds -- baths2,119 sq. ft.
700 704 N Harrington Ave, Sioux Falls, SD 57103
MLS# 22601662Listed by: KELLER WILLIAMS REALTY SIOUX FALLS- Open Sat, 3 to 4:30pm
 $364,000Active4 beds 3 baths2,271 sq. ft.
2505 S Pepper Ridge Ave, Sioux Falls, SD 57103
MLS# 22601666Listed by: BERKSHIRE HATHAWAY HOMESERVICES MIDWEST REALTY - SIOUX FALLS 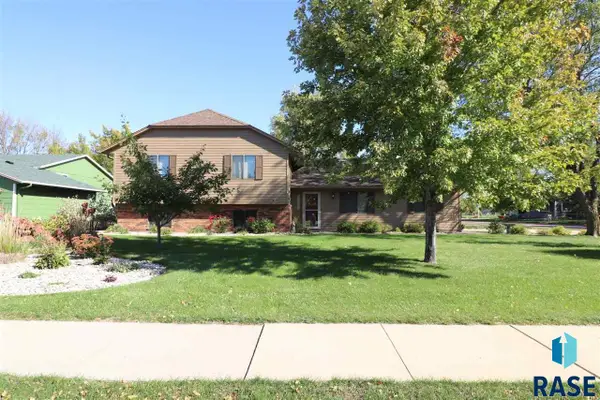 $350,000Pending3 beds 2 baths1,910 sq. ft.
4212 S Southeastern Ave, Sioux Falls, SD 57103
MLS# 22601639Listed by: REAL ESTATE TWO LLC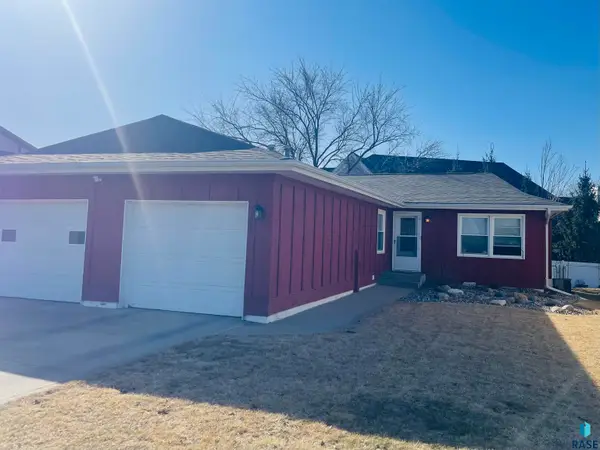 $239,900Active2 beds 2 baths1,390 sq. ft.
2813 E Klondike Trl, Sioux Falls, SD 57103
MLS# 22601598Listed by: APPLAUSE REAL ESTATE- Open Sat, 1 to 2pm
 $224,900Active3 beds 1 baths969 sq. ft.
405 N Van Eps Ave, Sioux Falls, SD 57103
MLS# 22601594Listed by: EXP REALTY - SF ALLEN TEAM  $225,000Active4 beds 1 baths1,473 sq. ft.
1715 E Mulberry St, Sioux Falls, SD 57103
MLS# 22601573Listed by: HEGG, REALTORS $289,900Pending3 beds 2 baths1,953 sq. ft.
2900 E 21st St, Sioux Falls, SD 57103
MLS# 22601572Listed by: EXP REALTY - SIOUX FALLS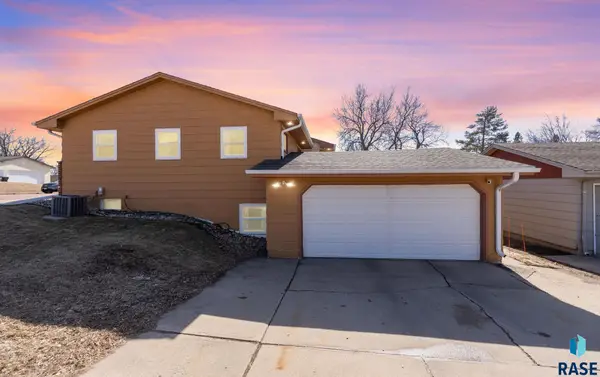 $319,000Active4 beds 3 baths2,370 sq. ft.
701 S Lowell Ave, Sioux Falls, SD 57103
MLS# 22601410Listed by: RE/MAX PROFESSIONALS INC $399,900Pending3 beds 2 baths2,083 sq. ft.
1405 E Otonka Trl, Sioux Falls, SD 57103
MLS# 22601405Listed by: COLDWELL BANKER EMPIRE REALTY $277,900Pending3 beds 2 baths1,590 sq. ft.
2109 E 1st St, Sioux Falls, SD 57103
MLS# 22601392Listed by: THE EXPERIENCE REAL ESTATE $435,000Pending5 beds 3 baths2,498 sq. ft.
4201 S Pillsberry Ave, Sioux Falls, SD 57103
MLS# 22601377Listed by: KELLER WILLIAMS REALTY SIOUX FALLS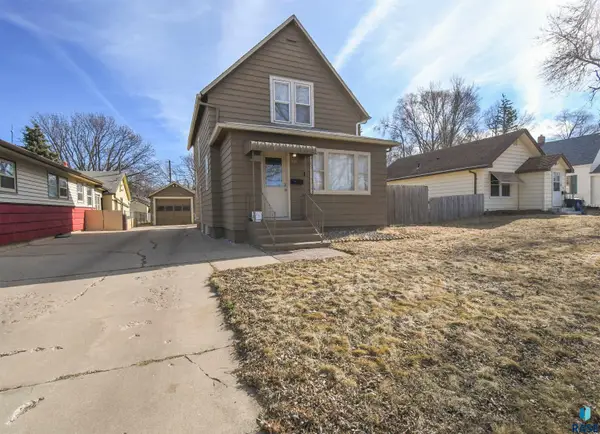 $219,900Pending3 beds 2 baths1,246 sq. ft.
930 N Sherman Ave, Sioux Falls, SD 57103
MLS# 22601361Listed by: KELLER WILLIAMS REALTY SIOUX FALLS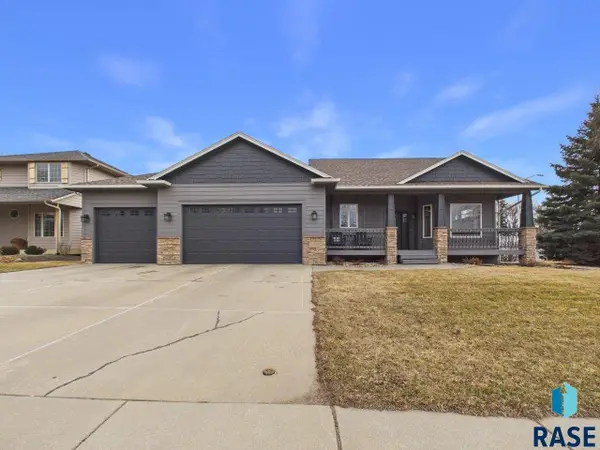 $475,000Pending4 beds 3 baths2,138 sq. ft.
4069 S Tuscany Ct, Sioux Falls, SD 57103
MLS# 22601291Listed by: HEGG, REALTORS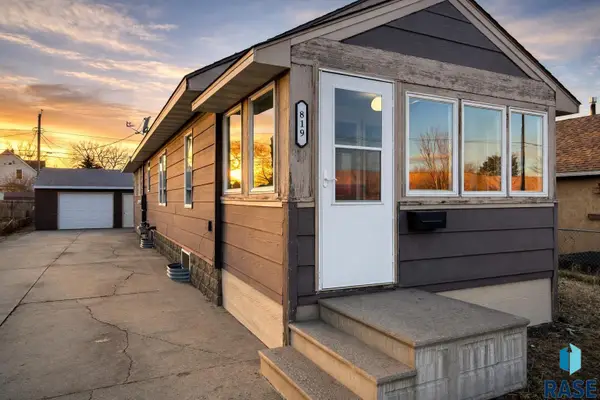 $149,900Pending2 beds 2 baths1,160 sq. ft.
819 N Cliff Ave, Sioux Falls, SD 57103
MLS# 22601288Listed by: BERKSHIRE HATHAWAY HOMESERVICES MIDWEST REALTY - SIOUX FALLS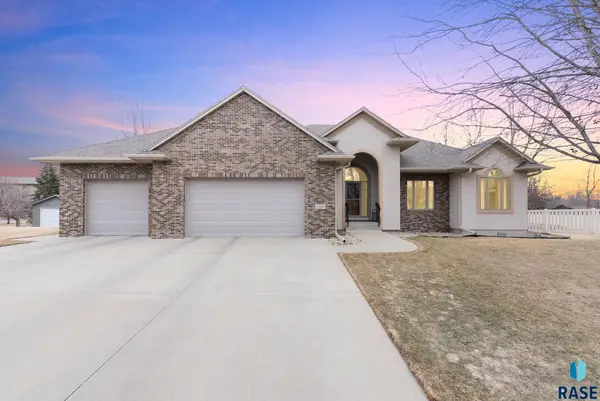 $630,000Pending5 beds 3 baths3,595 sq. ft.
4405 E Aster Cir, Sioux Falls, SD 57103
MLS# 22601281Listed by: EXP REALTY - SIOUX FALLS $189,900Pending3 beds 2 baths1,440 sq. ft.
706 N French Ave, Sioux Falls, SD 57103
MLS# 22601279Listed by: KELLER WILLIAMS REALTY SIOUX FALLS $324,500Active4 beds 2 baths1,718 sq. ft.
3917 E Claudette Dr, Sioux Falls, SD 57103
MLS# 22601269Listed by: AMERI/STAR REAL ESTATE, INC. $249,500Active3 beds 2 baths1,548 sq. ft.
3710 E Peony Pl #208, Sioux Falls, SD 57103
MLS# 22601231Listed by: KELLER WILLIAMS REALTY SIOUX FALLS $269,500Active4 beds 2 baths1,544 sq. ft.
3313 E 18th St, Sioux Falls, SD 57103
MLS# 22601233Listed by: EXP REALTY $250,000Active3 beds 2 baths1,488 sq. ft.
1300 S Point Dr, Sioux Falls, SD 57103
MLS# 22601190Listed by: KELLER WILLIAMS REALTY SIOUX FALLS $430,000Pending4 beds 3 baths2,217 sq. ft.
4108 S Bond Ave, Sioux Falls, SD 57103
MLS# 22601187Listed by: GRAND SOTHEBYS INTERNATIONAL REALTY $575,000Pending5 beds 3 baths3,114 sq. ft.
3805 S Bedford Ave, Sioux Falls, SD 57103
MLS# 22601172Listed by: BERKSHIRE HATHAWAY HOMESERVICES MIDWEST REALTY - SIOUX FALLS $245,000Active3 beds 2 baths1,452 sq. ft.
1635 S Cleveland Ave #306, Sioux Falls, SD 57103
MLS# 22601132Listed by: AMERI/STAR REAL ESTATE, INC. $344,900Pending4 beds 3 baths2,196 sq. ft.
932 S Kennedy Ave, Sioux Falls, SD 57103
MLS# 22601118Listed by: EXP REALTY- SF-ALLEN EDGE TEAM $349,900Pending3 beds 3 baths2,062 sq. ft.
2309 S Stephen Ave, Sioux Falls, SD 57103
MLS# 22601121Listed by: BETTER HOMES AND GARDENS REAL ESTATE BEYOND $439,900Pending4 beds 3 baths2,384 sq. ft.
3717 S Jesse James Ct, Sioux Falls, SD 57103
MLS# 22601095Listed by: FALLS REAL ESTATE $290,000Pending4 beds 2 baths2,002 sq. ft.
608 S Annway Dr, Sioux Falls, SD 57103
MLS# 22601091Listed by: EXP REALTY- SF-ALLEN EDGE TEAM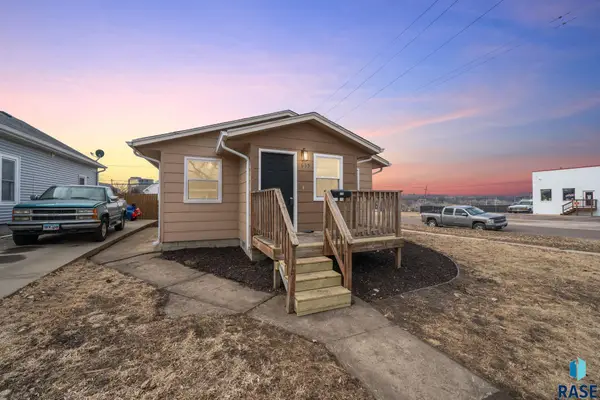 $179,000Pending3 beds 1 baths798 sq. ft.
635 N Nesmith Ave, Sioux Falls, SD 57103
MLS# 22601080Listed by: KELLER WILLIAMS REALTY SIOUX FALLS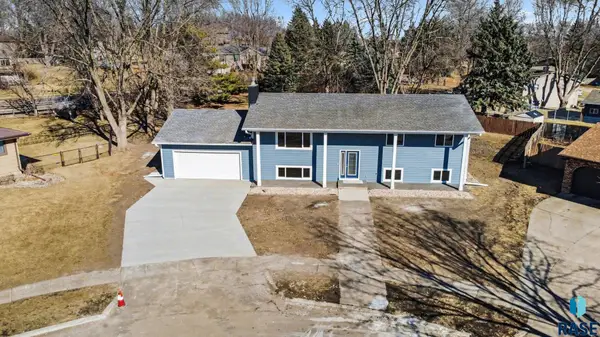 $419,500Pending4 beds 3 baths2,734 sq. ft.
4104 S Hackberry Cir, Sioux Falls, SD 57103
MLS# 22601073Listed by: HEGG, REALTORS $369,900Pending4 beds 2 baths1,932 sq. ft.
4409 E 36th St, Sioux Falls, SD 57103
MLS# 22601006Listed by: HEGG, REALTORS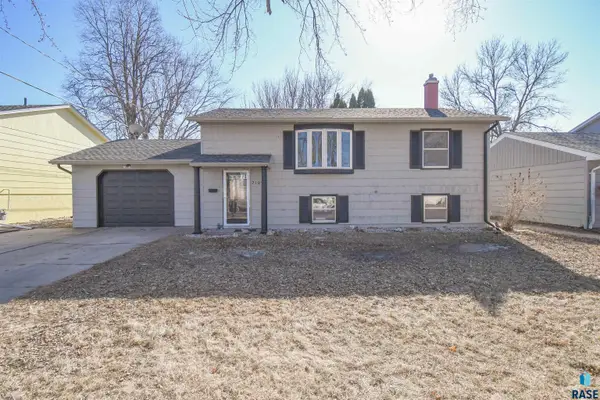 $269,900Pending3 beds 2 baths1,590 sq. ft.
2109 E 1st St, Sioux Falls, SD 57103
MLS# 22601002Listed by: THE EXPERIENCE REAL ESTATE $346,900Pending4 beds 2 baths1,980 sq. ft.
4409 E 37th St, Sioux Falls, SD 57103
MLS# 22600950Listed by: CASA REYNOZA $279,900Pending3 beds 2 baths1,606 sq. ft.
905 Charlotte Ave, Sioux Falls, SD 57103
MLS# 22600927Listed by: EXP REALTY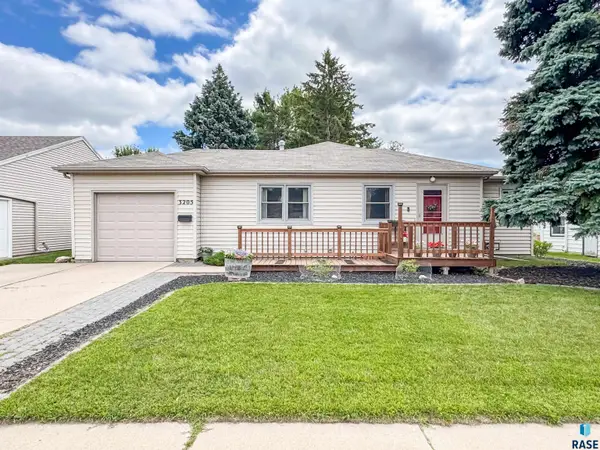 $275,000Pending3 beds 1 baths1,880 sq. ft.
3205 E 18th St, Sioux Falls, SD 57103
MLS# 22600894Listed by: ALPINE RESIDENTIAL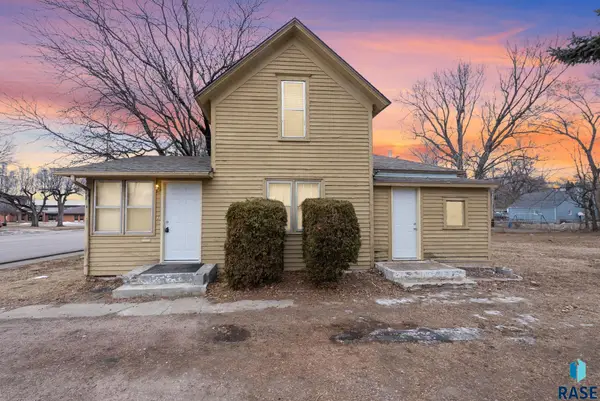 $174,000Active4 beds 1 baths1,125 sq. ft.
524 N Cliff Ave, Sioux Falls, SD 57103
MLS# 22600842Listed by: ALPINE RESIDENTIAL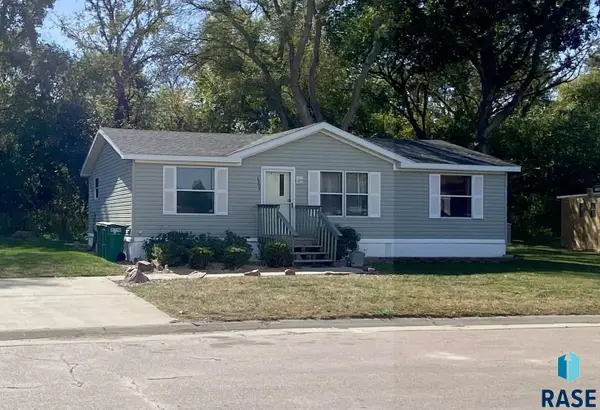 $54,900Pending3 beds 2 baths960 sq. ft.
1303 E Iris Pl, Sioux Falls, SD 57103
MLS# 22600835Listed by: HEGG, REALTORS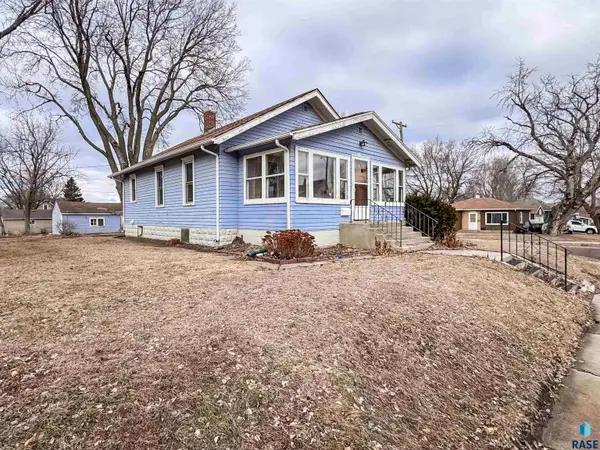 $190,000Pending2 beds 1 baths968 sq. ft.
829 N Van Eps Ave, Sioux Falls, SD 57103
MLS# 22600836Listed by: ALPINE RESIDENTIAL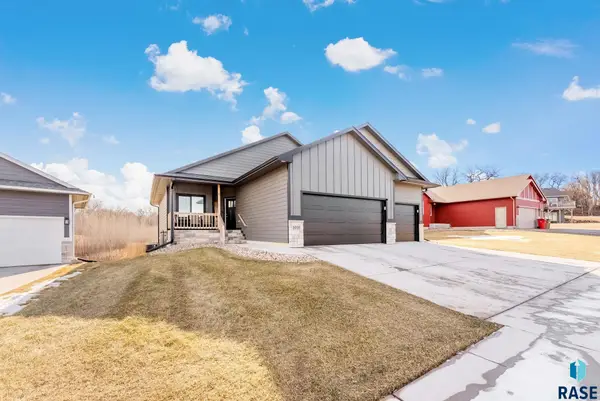 $469,900Active5 beds 3 baths2,075 sq. ft.
1016 N Mable Cir, Sioux Falls, SD 57103
MLS# 22600823Listed by: HEGG, REALTORS $650,000Active6 beds 3 baths2,897 sq. ft.
3409 S Jesse James Cir, Sioux Falls, SD 57103
MLS# 22600798Listed by: BETTER HOMES AND GARDENS REAL ESTATE BEYOND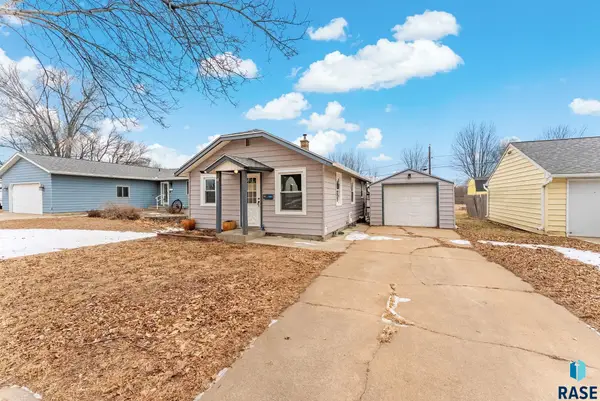 $200,000Active3 beds 2 baths775 sq. ft.
712 N Highland Ave, Sioux Falls, SD 57103
MLS# 22600803Listed by: REAL BROKER LLC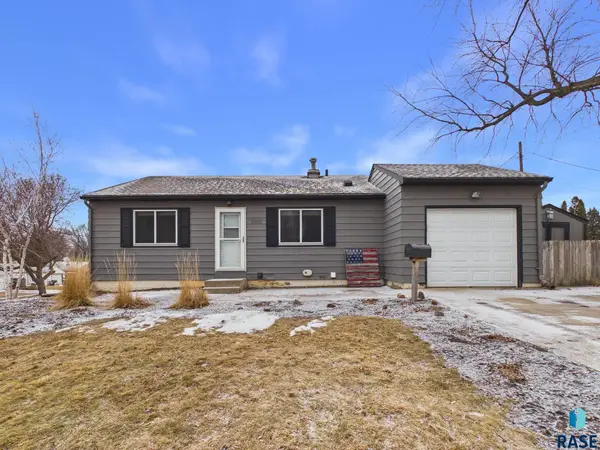 $275,000Pending3 beds 2 baths1,752 sq. ft.
3200 E 17th St, Sioux Falls, SD 57103
MLS# 22600785Listed by: HEGG, REALTORS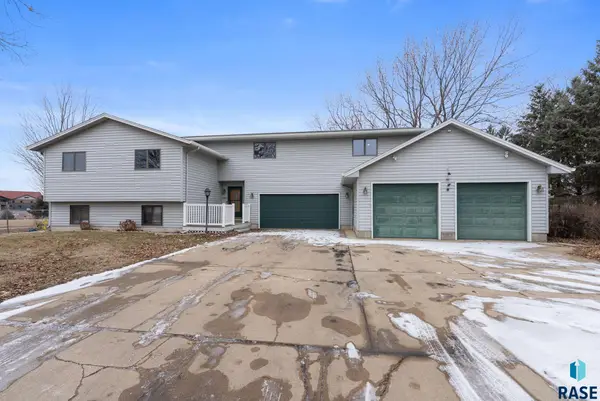 $480,000Pending5 beds 4 baths3,450 sq. ft.
301 N Locust Ave, Sioux Falls, SD 57103
MLS# 22600773Listed by: HEGG, REALTORS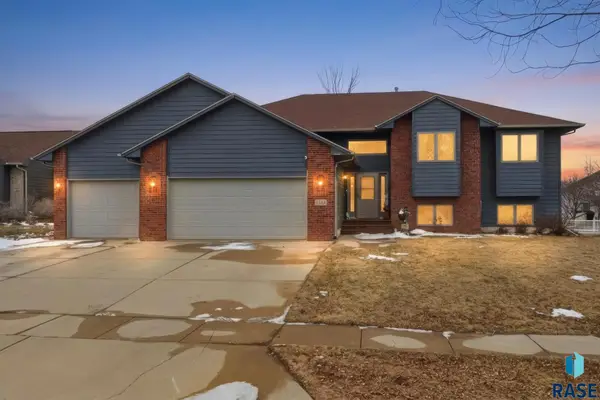 $499,000Pending5 beds 3 baths2,792 sq. ft.
3205 S Bluegrass Ct, Sioux Falls, SD 57103
MLS# 22600770Listed by: KELLER WILLIAMS REALTY SIOUX FALLS $155,000Active2 beds 1 baths796 sq. ft.
314 N Fairfax Ave, Sioux Falls, SD 57103
MLS# 22601472Listed by: HEGG, REALTORS $1,300,000Active-- beds -- baths13,404 sq. ft.
2805-09 E Bragstad Dr, Sioux Falls, SD 57103
MLS# 831622Listed by: GATEWAY REAL ESTATE ADVISORS $324,900Active-- beds -- baths1,000 sq. ft.
202 N French Ave, Sioux Falls, SD 57103
MLS# 22600488Listed by: GATEWAY REAL ESTATE ADVISORS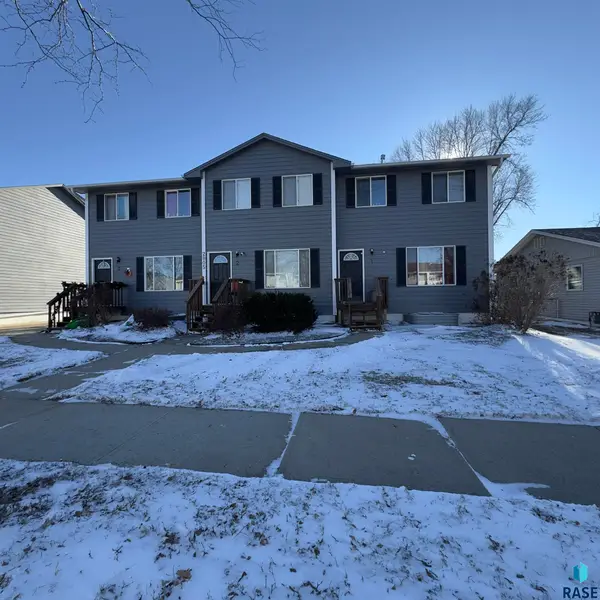 $1,300,000Active-- beds -- baths5,000 sq. ft.
2805 E Bragstad Dr, Sioux Falls, SD 57101
MLS# 22600489Listed by: GATEWAY REAL ESTATE ADVISORS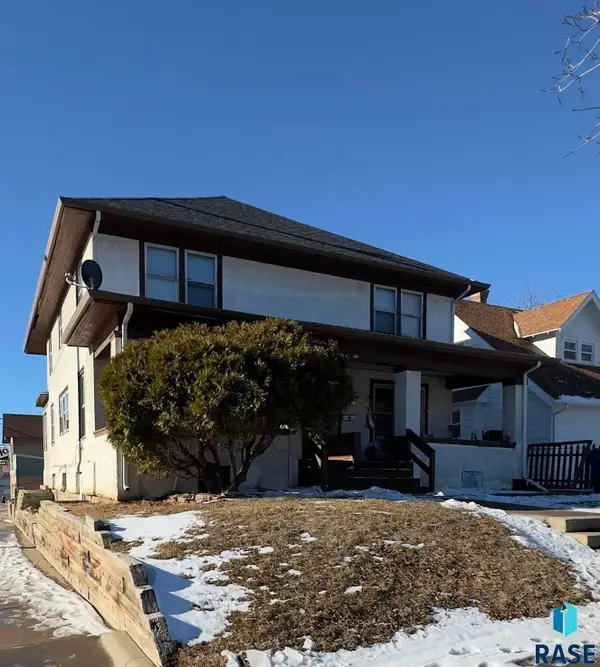 $409,900Active-- beds -- baths2,792 sq. ft.
201 N French Ave, Sioux Falls, SD 57101
MLS# 22600487Listed by: GATEWAY REAL ESTATE ADVISORS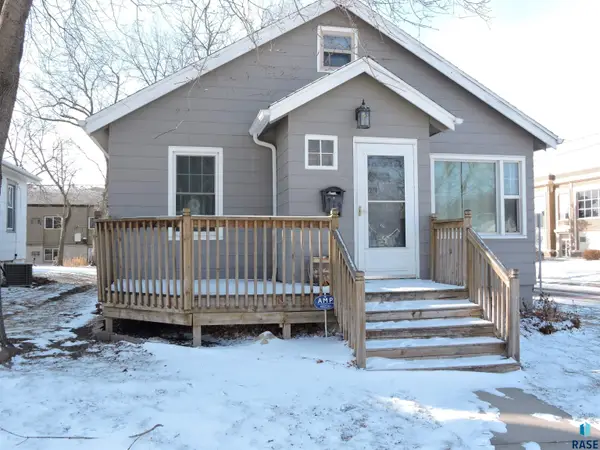 $179,900Active3 beds 1 baths912 sq. ft.
719 N Sherman Ave, Sioux Falls, SD 57103
MLS# 22600464Listed by: HEGG, REALTORS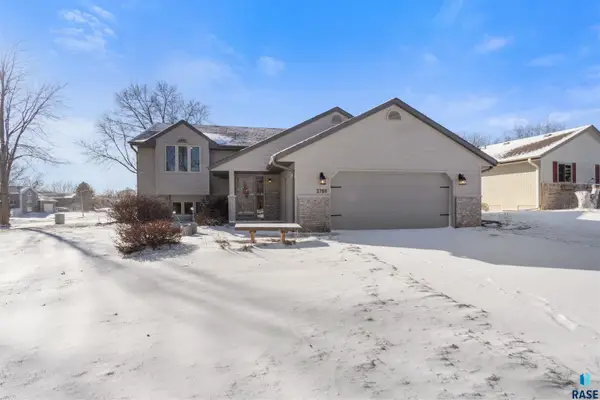 $385,000Pending4 beds 3 baths2,010 sq. ft.
2709 Kaystone Dr, Sioux Falls, SD 57103
MLS# 22600453Listed by: GRAND SOTHEBYS INTERNATIONAL REALTY $289,000Active4 beds 2 baths1,721 sq. ft.
2317 E 18th St, Sioux Falls, SD 57103
MLS# 22600438Listed by: BERKSHIRE HATHAWAY HOMESERVICES MIDWEST REALTY - SIOUX FALLS $234,900Pending4 beds 2 baths1,766 sq. ft.
1022 N Van Eps Ave, Sioux Falls, SD 57103
MLS# 22600429Listed by: REAL BROKER LLC $215,000Active3 beds 1 baths1,030 sq. ft.
608 S Highland Ave, Sioux Falls, SD 57103
MLS# 22600422Listed by: COLDWELL BANKER EMPIRE REALTY $382,900Pending4 beds 3 baths2,748 sq. ft.
2713 S Harvey Dunn Dr, Sioux Falls, SD 57103
MLS# 22600389Listed by: AMERI/STAR REAL ESTATE, INC.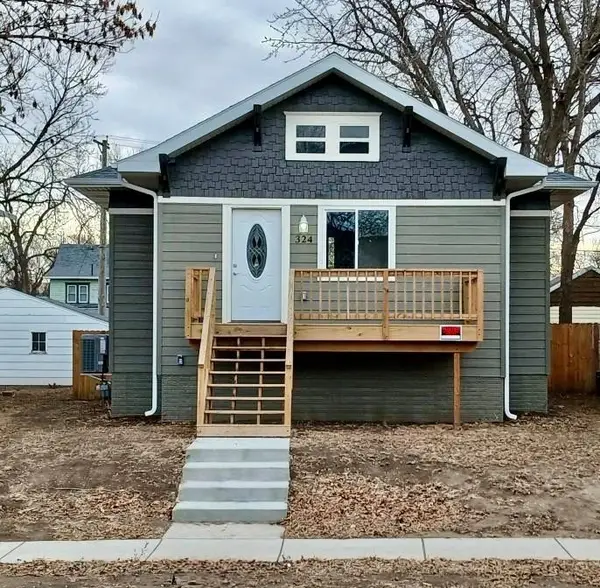 $249,900Active3 beds 1 baths1,069 sq. ft.
324 N Nesmith Ave, Sioux Falls, SD 57103
MLS# 22600295Listed by: SOUTH EASTERN DEVELOPMENT FOUN $283,000Pending3 beds 2 baths1,629 sq. ft.
2904 E 21st St, Sioux Falls, SD 57103
MLS# 22600291Listed by: HEGG, REALTORS $535,000Pending4 beds 3 baths3,155 sq. ft.
4000 S Brady Ct, Sioux Falls, SD 57103
MLS# 22600194Listed by: ALPINE RESIDENTIAL $545,000Active-- beds -- baths3,808 sq. ft.
1915 N Mable Ave, Sioux Falls, SD 57103
MLS# 22600162Listed by: REAL BROKER LLC $300,000Active-- beds -- baths2,688 sq. ft.
714 /716 E 5th St, Sioux Falls, SD 57103
MLS# 22600154Listed by: EXP REALTY $238,500Pending3 beds 1 baths1,627 sq. ft.
2804 E 19th St, Sioux Falls, SD 57103
MLS# 22600659Listed by: RE/MAX PROFESSIONALS INC $225,000Pending2 beds 2 baths1,420 sq. ft.
1600 S Southeastern Ave #202, Sioux Falls, SD 57103
MLS# 22600113Listed by: 605 REAL ESTATE LLC $119,900Active1 beds 1 baths519 sq. ft.
400 Chicago Ave N, Sioux Falls, SD 57103
MLS# 22600039Listed by: RE/MAX PROFESSIONALS INC $379,900Active-- beds -- baths2,280 sq. ft.
3609 & 3611 E 18th St, Sioux Falls, SD 57103
MLS# 22600009Listed by: KELLER WILLIAMS REALTY SIOUX FALLS $685,000Active-- beds -- baths5,200 sq. ft.
2800 E Madison St #1-4, Sioux Falls, SD 57103
MLS# 22509224Listed by: AMY STOCKBERGER REAL ESTATE $179,999Pending2 beds 1 baths885 sq. ft.
201 N Chicago Ave, Sioux Falls, SD 57103
MLS# 22509190Listed by: HEGG, REALTORS $250,000Pending3 beds 1 baths1,427 sq. ft.
1005 S Tabbert Cir, Sioux Falls, SD 57103
MLS# 22509183Listed by: HEGG, REALTORS $580,000Active5 beds 3 baths3,064 sq. ft.
4101 S Florence Ave, Sioux Falls, SD 57103
MLS# 22509127Listed by: THE EXPERIENCE REAL ESTATE $305,000Pending4 beds 2 baths1,477 sq. ft.
1001 N Homestead Cir, Sioux Falls, SD 57103
MLS# 22509095Listed by: BERKSHIRE HATHAWAY HOMESERVICES MIDWEST REALTY - SIOUX FALLS $400,000Active5.42 Acres
2300 E 5th St, Sioux Falls, SD 57103
MLS# 22509056Listed by: KELLER WILLIAMS REALTY SIOUX FALLS $374,900Active4 beds 3 baths2,586 sq. ft.
3500 E Kris Dr, Sioux Falls, SD 57103
MLS# 22509041Listed by: REAL BROKER LLC $300,000Active3 beds 1 baths2,096 sq. ft.
948 S Cloudas Ave, Sioux Falls, SD 57103
MLS# 22508957Listed by: BERKSHIRE HATHAWAY HOMESERVICES MIDWEST REALTY - TEA $735,000Active6 beds 4 baths4,055 sq. ft.
3504 E Broken Arrow St, Sioux Falls, SD 57103
MLS# 22508969Listed by: COLDWELL BANKER EMPIRE REALTY $364,500Pending4 beds 3 baths2,254 sq. ft.
4201 S Lewis Ave, Sioux Falls, SD 57103
MLS# 22508886Listed by: AMERI/STAR REAL ESTATE, INC. $220,000Pending3 beds 1 baths969 sq. ft.
405 N Van Eps Ave, Sioux Falls, SD 57103
MLS# 22600538Listed by: EXP REALTY - SF ALLEN TEAM $310,000Pending3 beds 2 baths1,422 sq. ft.
921 N Chicago Ave, Sioux Falls, SD 57103
MLS# 22508822Listed by: JAMISON COMPANY REAL ESTATE $230,000Active4 beds 2 baths1,466 sq. ft.
2012 E Tracy Ln, Sioux Falls, SD 57103
MLS# 22508804Listed by: CASA REYNOZA $55,000Active3 beds 2 baths980 sq. ft.
1020 N Bunker Pl, Sioux Falls, SD 57103
MLS# 22600490Listed by: EXP REALTY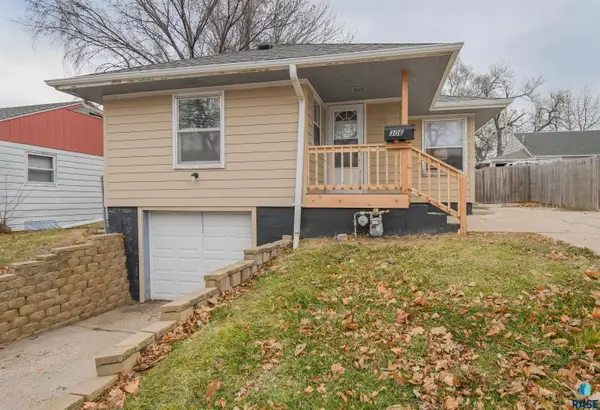 $200,000Pending3 beds 1 baths880 sq. ft.
306 S Chicago Ave, Sioux Falls, SD 57103
MLS# 22508784Listed by: THE EXPERIENCE REAL ESTATE $900,000Active-- beds -- baths8,784 sq. ft.
1201 & 1205 S Blaine Ave, Sioux Falls, SD 57103
MLS# 22508662Listed by: BENDER REALTORS $249,000Pending2 beds 2 baths1,680 sq. ft.
1300 S Olive Dr, Sioux Falls, SD 57103
MLS# 22508269Listed by: CORE REAL ESTATE $285,000Active-- beds -- baths2,466 sq. ft.
310 N Van Eps Ave, Sioux Falls, SD 57103
MLS# 22600579Listed by: 605 REAL ESTATE LLC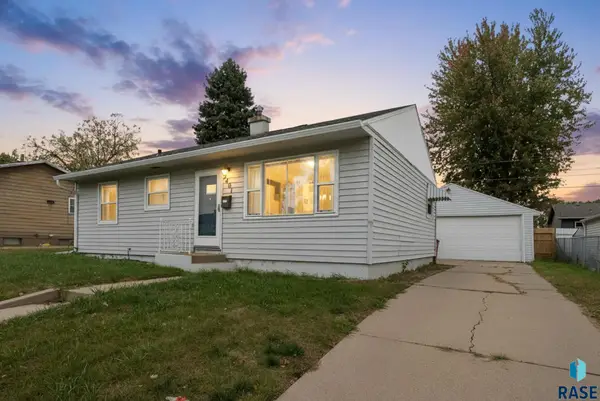 $209,500Pending3 beds 1 baths875 sq. ft.
2401 E 18th St, Sioux Falls, SD 57103
MLS# 22601135Listed by: EXP REALTY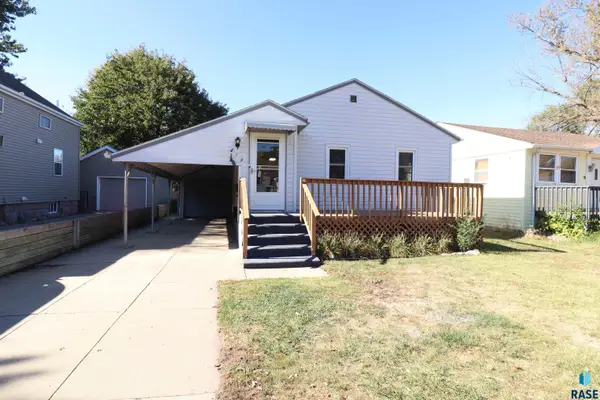 $182,500Pending2 beds 1 baths768 sq. ft.
519 N Wayland Ave, Sioux Falls, SD 57103
MLS# 22508524Listed by: HEGG, REALTORS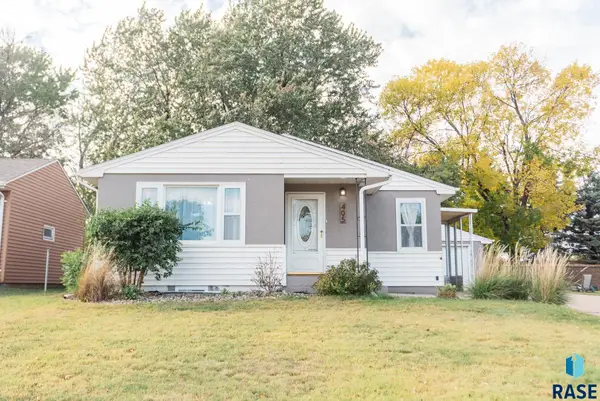 $249,900Pending3 beds 2 baths1,573 sq. ft.
405 S Blaine Ave, Sioux Falls, SD 57103
MLS# 22507972Listed by: ALPINE RESIDENTIAL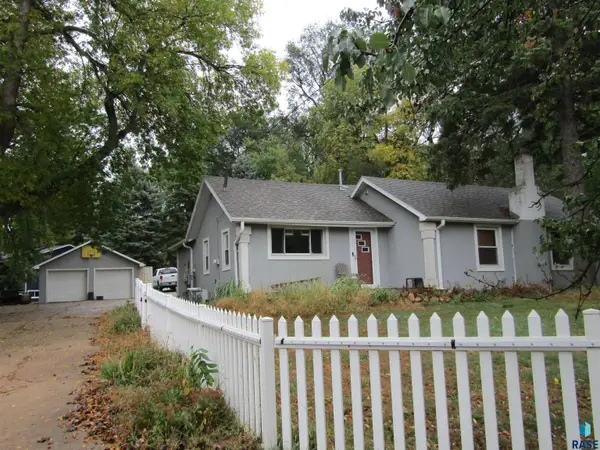 $300,000Pending2 beds 2 baths1,235 sq. ft.
2832 E Granny Smith Pl, Sioux Falls, SD 57103
MLS# 22507848Listed by: HEGG, REALTORS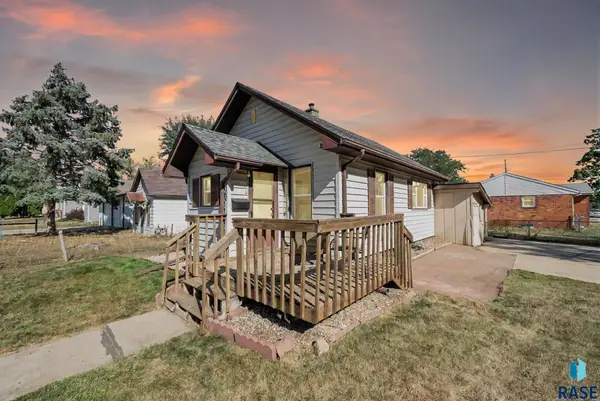 $129,000Active1 beds 1 baths960 sq. ft.
700 N Mable Ave, Sioux Falls, SD 57103
MLS# 22507736Listed by: RE/MAX PROFESSIONALS INC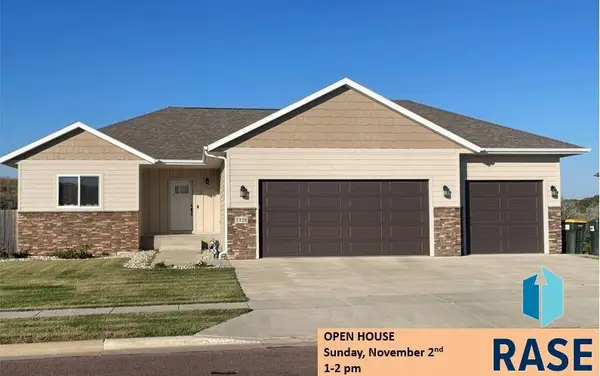 $440,000Active3 beds 2 baths1,493 sq. ft.
3328 E Broken Arrow St, Sioux Falls, SD 57103
MLS# 22507611Listed by: M & W SERVICES INC DBA SIOUX EMPIRE REAL ESTATE $285,000Pending3 beds 3 baths1,694 sq. ft.
918 S Charlotte Ave, Sioux Falls, SD 57103
MLS# 22507588Listed by: HARR & LEMME REAL ESTATE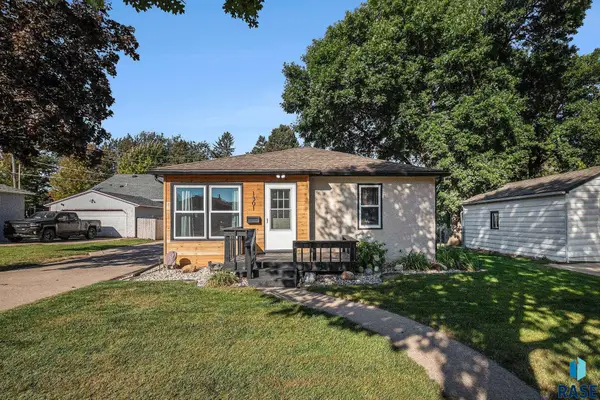 $299,500Active3 beds 2 baths1,659 sq. ft.
1301 S Gary Dr, Sioux Falls, SD 57103
MLS# 22509208Listed by: HEGG, REALTORS $301,900Pending3 beds 2 baths1,895 sq. ft.
933 S Grandview Ave, Sioux Falls, SD 57103
MLS# 22507127Listed by: KELLER WILLIAMS REALTY SIOUX FALLS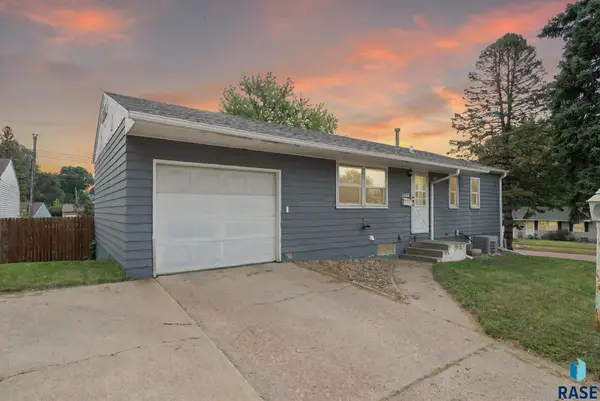 $240,000Pending3 beds 2 baths1,512 sq. ft.
1444 S Bahnson Ave, Sioux Falls, SD 57103
MLS# 22600051Listed by: HEGG, REALTORS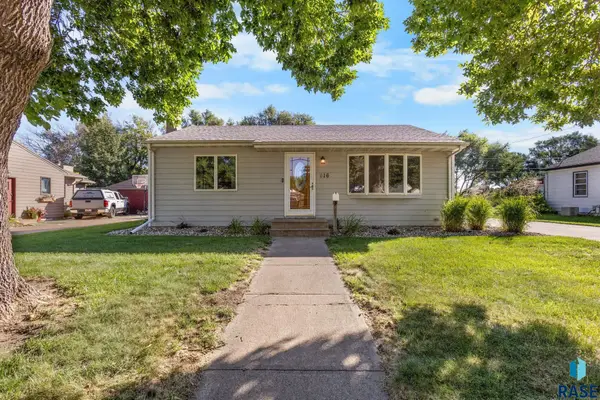 $279,999Pending3 beds 2 baths944 sq. ft.
616 N Leadale Ave, Sioux Falls, SD 57103
MLS# 22506896Listed by: AMY STOCKBERGER REAL ESTATE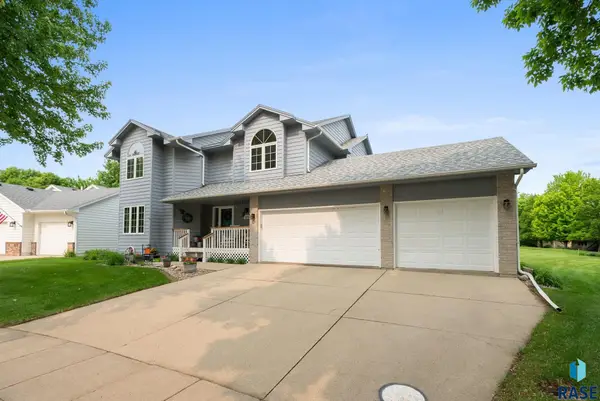 $500,000Pending4 beds 3 baths3,368 sq. ft.
3805 S Lisanne Ave, Sioux Falls, SD 57103
MLS# 22506802Listed by: KELLER WILLIAMS REALTY SIOUX FALLS $289,900Pending3 beds 2 baths1,515 sq. ft.
928 S Harrington Ave, Sioux Falls, SD 57103
MLS# 22600909Listed by: 605 REAL ESTATE LLC $349,900Active-- beds -- baths1,873 sq. ft.
1300 E 6th St, Sioux Falls, SD 57106
MLS# 22601358Listed by: 605 REAL ESTATE LLC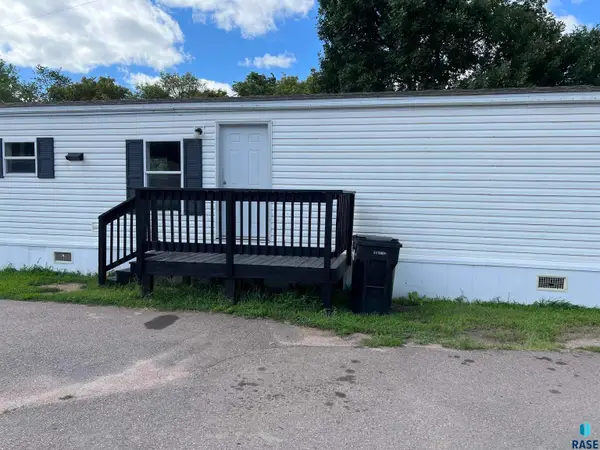 $47,000Active3 beds 1 baths840 sq. ft.
4008 E Hayes Pl, Sioux Falls, SD 57103
MLS# 22506540Listed by: 605 REAL ESTATE LLC $1,200,000Active-- beds -- baths7,250 sq. ft.
304 - 308 S Conklin Ave, Sioux Falls, SD 57103
MLS# 22506308Listed by: 605 REAL ESTATE LLC $749,900Active4 beds 3 baths2,844 sq. ft.
3738 E Fox Run Pl, Sioux Falls, SD 57103
MLS# 22506138Listed by: AMY STOCKBERGER REAL ESTATE $180,000Pending2 beds 1 baths888 sq. ft.
719 E 4th St, Sioux Falls, SD 57103
MLS# 22508164Listed by: 605 REAL ESTATE LLC $249,900Pending4 beds 2 baths1,412 sq. ft.
2615 E 12th St, Sioux Falls, SD 57103
MLS# 22508293Listed by: HEGG, REALTORS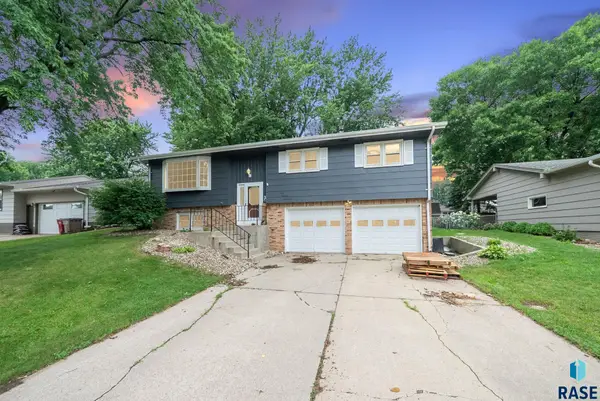 $286,000Pending4 beds 3 baths1,881 sq. ft.
917 S Grandview Ave, Sioux Falls, SD 57103
MLS# 22506760Listed by: KELLER WILLIAMS REALTY SIOUX FALLS $230,000Pending3 beds 1 baths1,595 sq. ft.
601 S Blauvelt Ave, Sioux Falls, SD 57103
MLS# 22600891Listed by: RE/MAX PROFESSIONALS INC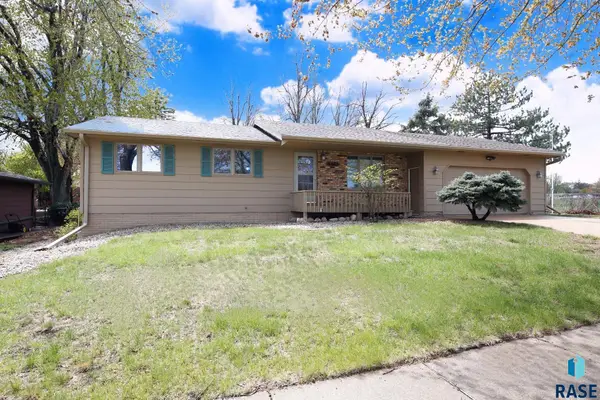 $308,900Pending4 beds 2 baths1,974 sq. ft.
4301 E 19th St, Sioux Falls, SD 57103
MLS# 22503231Listed by: HEGG COMMERCIAL REAL ESTATE, LLC $549,900Active5 beds 4 baths2,956 sq. ft.
1013 N Danielle Dr, Sioux Falls, SD 57103
MLS# 22600146Listed by: ABC REALTY, INC.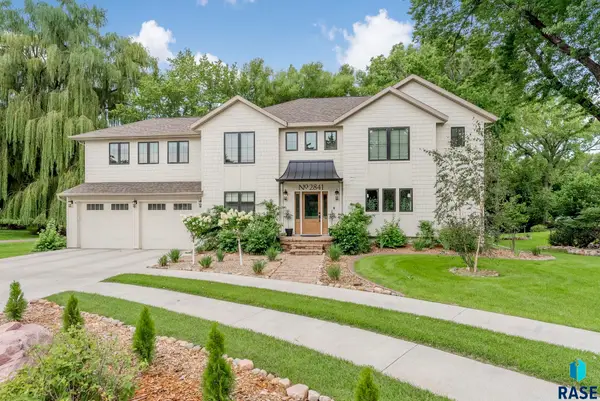 $1,395,000Active6 beds 4 baths4,264 sq. ft.
2841 E Old Orchard Trl, Sioux Falls, SD 57103
MLS# 22600951Listed by: EXP REALTY - SIOUX FALLS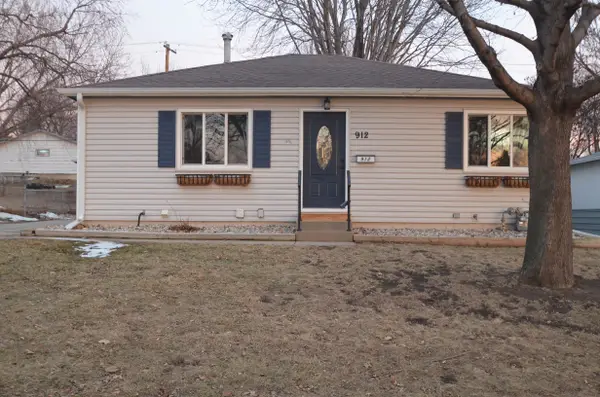 $299,900Active4 beds 2 baths1,704 sq. ft.
912 S Cloudas Ave, Sioux Falls, SD 57103
MLS# 22600104Listed by: BERKSHIRE HATHAWAY HOMESERVICES MIDWEST REALTY - SIOUX FALLS $980,000Pending5 beds 3 baths4,773 sq. ft.
3056 S Coral Ct, Sioux Falls, SD 57103
MLS# 22507626Listed by: COLDWELL BANKER EMPIRE REALTY $440,000Pending3 beds 3 baths2,632 sq. ft.
3500 E Apple Blossom Cir, Sioux Falls, SD 57103
MLS# 22600792Listed by: HEGG, REALTORS
Local realty services provided by:CENTURY 21 Advantage, CENTURY 21 ProLink
Popular searches near 57103
Popular neighborhoods near 57103
- All Saints, Sioux Falls homes for sale
- Downtown, Sioux Falls homes for sale
- Eastside, Sioux City homes for sale
- Galway Park, Sioux Falls homes for sale
- Garfield, Sioux Falls homes for sale
- Leeds, Sioux City homes for sale
- Midtown, Sioux City homes for sale
- Morningside North, Sioux City homes for sale
- Northside Central, Sioux City homes for sale
- Northside North, Sioux City homes for sale
- Oak View, Sioux Falls homes for sale
- Old Orchard, Sioux Falls homes for sale
- Pepper Ridge, Sioux Falls homes for sale
- Pettigrew Heights, Sioux Falls homes for sale
- RIV, Sioux City homes for sale
- Riverside, Sioux Falls homes for sale
- Terrace Park, Sioux Falls homes for sale
- Westside Central, Sioux City homes for sale
- Westside South, Sioux City homes for sale
- Whittier, Sioux Falls homes for sale
Counties near Sioux Falls, 57103
- Brookings County homes for sale
- Clay County homes for sale
- Hanson County homes for sale
- Hutchinson County homes for sale
- Lake County homes for sale
- Lincoln County homes for sale
- Lyon County homes for sale
- McCook County homes for sale
- Miner County homes for sale
- Minnehaha County homes for sale
- Moody County homes for sale
- Murray County homes for sale
- Nobles County homes for sale
- Osceola County homes for sale
- Pipestone County homes for sale
- Rock County homes for sale
- Sioux County homes for sale
- Turner County homes for sale
- Union County homes for sale
- Yankton County homes for sale
Protect your home and budget from life's surprises with an Assurant Home Warranty, backed by a partner that supports you through every step of homeownership. Explore Plans.
©2026 Century 21 Real Estate LLC. All rights reserved. CENTURY 21®, the CENTURY 21 Logo and C21® are service marks owned by Century 21 Real Estate LLC. Century 21 Real Estate LLC fully supports the principles of the Fair Housing Act and the Equal Opportunity Act. Each office is independently owned and operated. Listing information is deemed reliable but not guaranteed accurate.