- Century Oaks West, Elgin homes for sale
- Cobblers Crossing, Elgin homes for sale
- Dundee, Carpentersville homes for sale
- Fox River Valley Gardens, Port Barrington homes for sale
- Hawthorn Woods Country Club, Lake Zurich homes for sale
- High Hill Farms, Algonquin homes for sale
- Ivy Hill, Arlington Heights homes for sale
- Lake Barrington Shores, Lake Barrington homes for sale
- Lake in the Hills Estates, Lake In The Hills homes for sale
- Laudymont Terrace, Arlington Heights homes for sale
- Medinah, Medinah homes for sale
- Ridgewood, Buffalo Grove homes for sale
- Streamwood Green, Streamwood homes for sale
- The Crossings, Buffalo Grove homes for sale
- The Villas of Gleneagle Farm, Carpentersville homes for sale
- The Woodlands at Fiore, Buffalo Grove homes for sale
- White Oak Estates, Long Grove homes for sale
- Winston Park Northwest, Palatine homes for sale
- Woodland Heights, Streamwood homes for sale
- Wynstone, North Barrington homes for sale
South Barrington, IL - homes for sale
43 of 43 results displayed
- Open Sat, 11am to 1pmNew
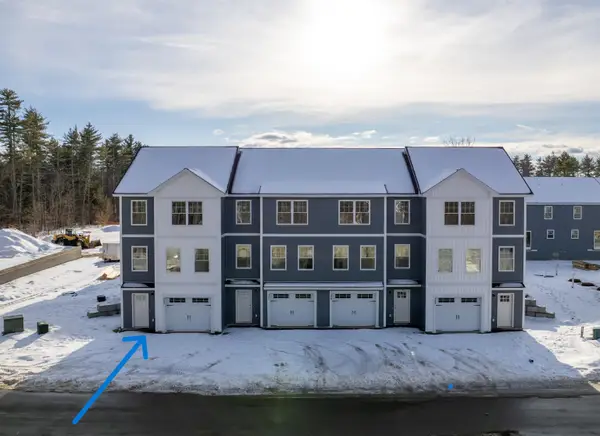 $424,900Active2 beds 2 baths1,250 sq. ft.
10D Lucky Lane The Crossings at Village Center #10 D, Barrington, NH 03825
MLS# 5080813Listed by: THE GOVE GROUP REAL ESTATE, LLC
- New
 $955,000Active5 beds 5 baths5,204 sq. ft.
26 Brandywine Road, South Barrington, IL 60010
MLS# 12602101Listed by: KELLER WILLIAMS SUCCESS REALTY - New
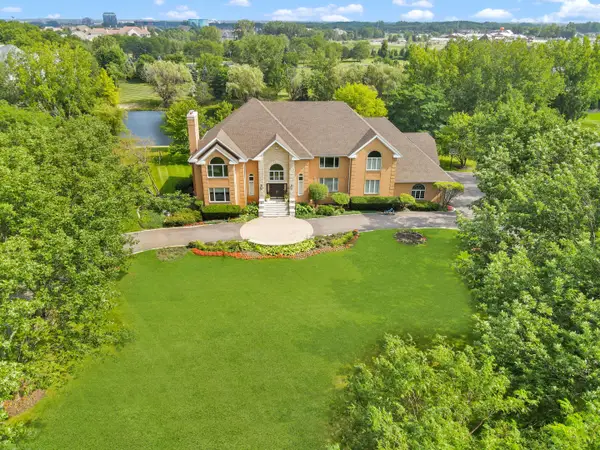 $2,349,000Active6 beds 6 baths11,020 sq. ft.
Address Withheld By Seller, South Barrington, IL 60010
MLS# 12600470Listed by: AMERICAN INTERNATIONAL REALTY CORP. - New
 $1,350,000Active6 beds 7 baths8,116 sq. ft.
35 Revere Drive, South Barrington, IL 60010
MLS# 12600531Listed by: ADREANI REALTY INC - New
 $325,000Active1.43 Acres
11 Brooke Lane, South Barrington, IL 60010
MLS# 12594275Listed by: RE/MAX LIBERTY  $1,100,000Pending5 beds 5 baths3,699 sq. ft.
4 Ashford Court, South Barrington, IL 60010
MLS# 12588647Listed by: COLDWELL BANKER REALTY $825,000Pending5 beds 5 baths3,140 sq. ft.
18 Brandywine Road, South Barrington, IL 60010
MLS# 12585472Listed by: RE/MAX LIBERTY $774,900Pending4 beds 3 baths4,100 sq. ft.
13 Lexington Road, South Barrington, IL 60010
MLS# 12584992Listed by: PARKVUE REALTY CORPORATION $5,000,000Active0 Acres
5 Butera Lane, Barrington, IL 60010
MLS# 12574173Listed by: DNV SOLUTIONS LLC $1,550,000Active4 beds 5 baths5,226 sq. ft.
9 Falcon Lakes Drive, South Barrington, IL 60010
MLS# 12576878Listed by: REAL BROKER LLC $424,900Active2 beds 2 baths1,250 sq. ft.
10A Lucky Lane, Crossings at Village Center, Barrington, NH 03825
MLS# 5077273Listed by: THE GOVE GROUP REAL ESTATE, LLC $389,000Active1.03 Acres
3 Leanda Lane, South Barrington, IL 60010
MLS# 12561008Listed by: BAIRD & WARNER $629,000Active1.35 Acres
19 Star Lane, South Barrington, IL 60010
MLS# 12548913Listed by: COLDWELL BANKER REALTY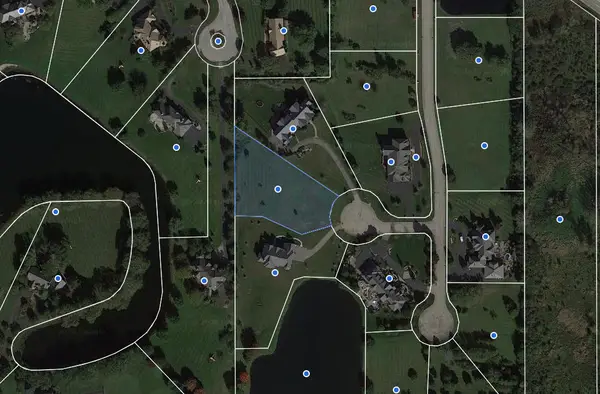 $399,000Active0.92 Acres
12 Leanda Court, South Barrington, IL 60010
MLS# 12554908Listed by: COLDWELL BANKER REALTY $699,000Active0 Acres
29 Saddlehorn Lane, South Barrington, IL 60010
MLS# 12534543Listed by: IREALTY FLAT FEE BROKERAGE $799,000Active0 Acres
6 Saddlehorn Lane, South Barrington, IL 60010
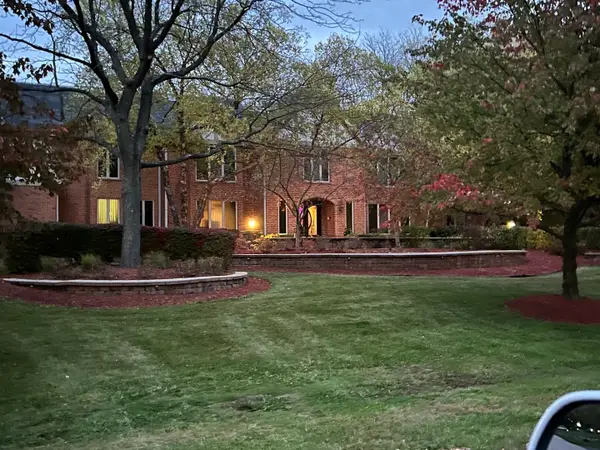
MLS# 12534557Listed by: IREALTY FLAT FEE BROKERAGE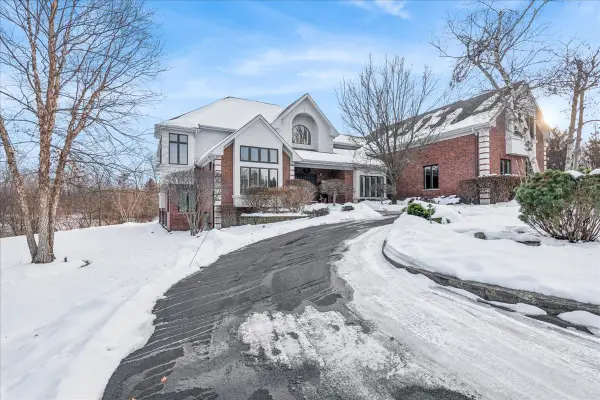 $1,795,000Pending5 beds 6 baths8,708 sq. ft.
12 E Penny Road, South Barrington, IL 60010
MLS# 12532897Listed by: BAIRD & WARNER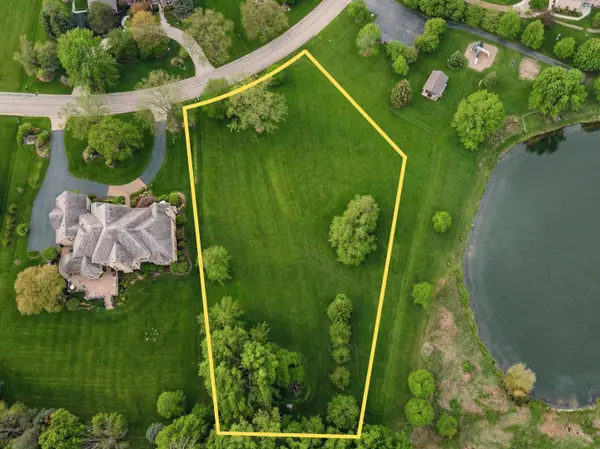 $480,000Pending1.49 Acres
25 Cutters Run, South Barrington, IL 60010
MLS# 12521485Listed by: JAMESON SOTHEBY'S INTERNATIONAL REALTY $1,200,000Active0 Acres
36 W Penny Road, South Barrington, IL 60010
MLS# 12523282Listed by: COLDWELL BANKER REALTY $2,000,000Pending7.7 Acres
306 Algonquin Road, South Barrington, IL 60010
MLS# 12495816Listed by: @PROPERTIES CHRISTIE'S INTERNATIONAL REAL ESTATE $1,499,000Pending5 beds 6 baths8,084 sq. ft.
8 Farmington Road, South Barrington, IL 60010
MLS# 12587153Listed by: COLDWELL BANKER REALTY $1,090,000Active6 beds 5 baths3,500 sq. ft.
2 Wood Oaks Drive, South Barrington, IL 60010
MLS# 12441977Listed by: CHARLES RUTENBERG REALTY OF IL $479,900Active2.11 Acres
40 S Polo Drive, South Barrington, IL 60010
MLS# 12489919Listed by: MISTERHOMES REAL ESTATE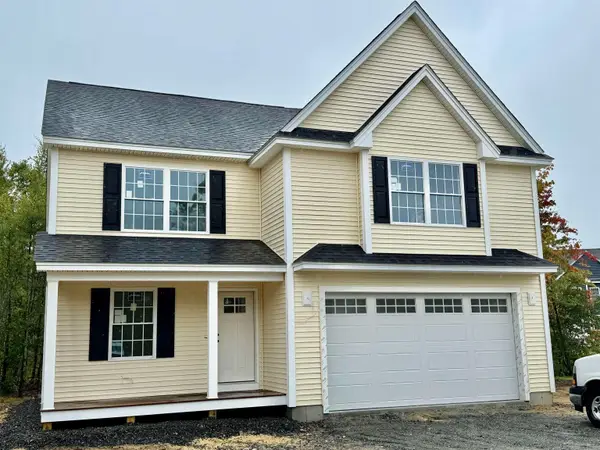 $869,900Pending4 beds 3 baths2,568 sq. ft.
17 Elm Court, Barrington, NH 03825
MLS# 5074031Listed by: RE/MAX TRIUMPH REALTY $2,700,000Pending6 beds 14 baths14,497 sq. ft.
17 Star Lane, South Barrington, IL 60010
MLS# 12476440Listed by: @PROPERTIES CHRISTIE'S INTERNATIONAL REAL ESTATE $2,395,000Active7 beds 7 baths10,111 sq. ft.
1 Pacer Trail, South Barrington, IL 60010
MLS# 12440227Listed by: COMPASS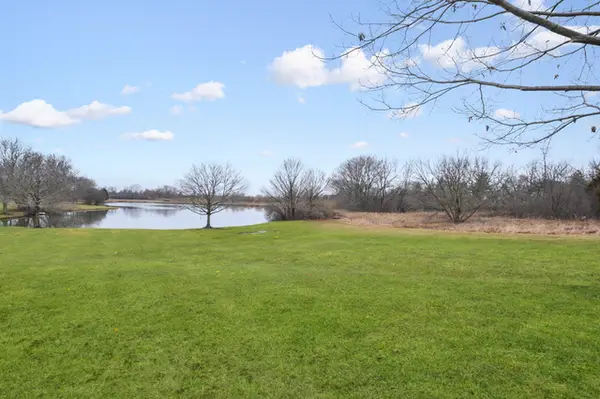 $474,900Active1.48 Acres
13 Pacer Trail, South Barrington, IL 60010
MLS# 12462285Listed by: COLDWELL BANKER REALTY $459,000Active0 Acres
33 Cutters Run Drive, South Barrington, IL 60010
MLS# 12454043Listed by: HOMESMART CONNECT LLC $2,450,000Active6 beds 7 baths10,452 sq. ft.
23 Enclave Court, South Barrington, IL 60010
MLS# 12417015Listed by: REALTY OF AMERICA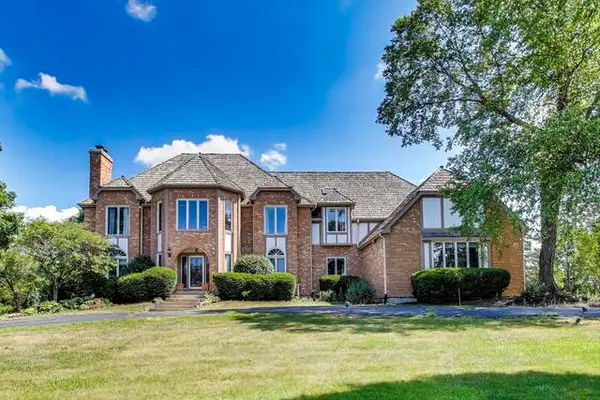
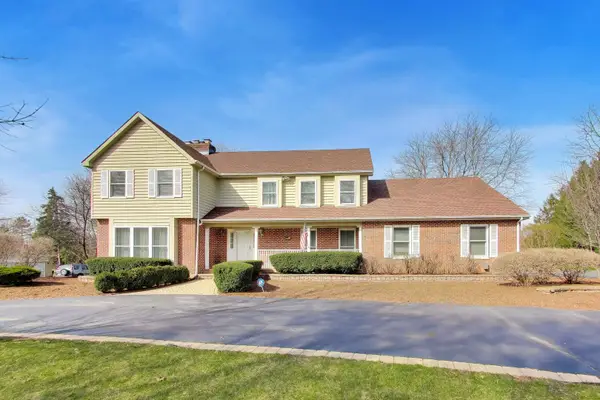
 $979,999Pending5 beds 6 baths5,638 sq. ft.
33 N Liberty Drive, South Barrington, IL 60010
MLS# 12410319Listed by: CENTURY 21 LANGOS & CHRISTIAN $2,695,000Active5 beds 6 baths9,588 sq. ft.
18 Enclave Court, South Barrington, IL 60010
MLS# 12570480Listed by: COLDWELL BANKER REALTY $4,899,000Active4 beds 7 baths6,450 sq. ft.
61 E Palatine #4 Road, South Barrington, IL 60010
MLS# 12356433Listed by: IREALTY FLAT FEE BROKERAGE $3,799,000Active3 beds 7 baths6,632 sq. ft.
61 E Palatine #6 Road, South Barrington, IL 60010
MLS# 12356471Listed by: IREALTY FLAT FEE BROKERAGE $1,300,000Active0.5 Acres
61 E Palatine #20 Road, South Barrington, IL 60010
MLS# 12356531Listed by: IREALTY FLAT FEE BROKERAGE $4,199,000Active4 beds 7 baths6,889 sq. ft.
61 E Palatine #39 Road, South Barrington, IL 60010
MLS# 12356547Listed by: IREALTY FLAT FEE BROKERAGE $1,200,000Active0.59 Acres
61 E Palatine #10 Road, South Barrington, IL 60010
MLS# 12356641Listed by: IREALTY FLAT FEE BROKERAGE $465,000Active1.32 Acres
8 Falcon Lakes Drive, South Barrington, IL 60010
MLS# 12277121Listed by: REDFIN CORPORATION $699,000Active1.88 Acres
30 Star Lane, South Barrington, IL 60010
MLS# 12363781Listed by: CHICAGOLAND BROKERS, INC.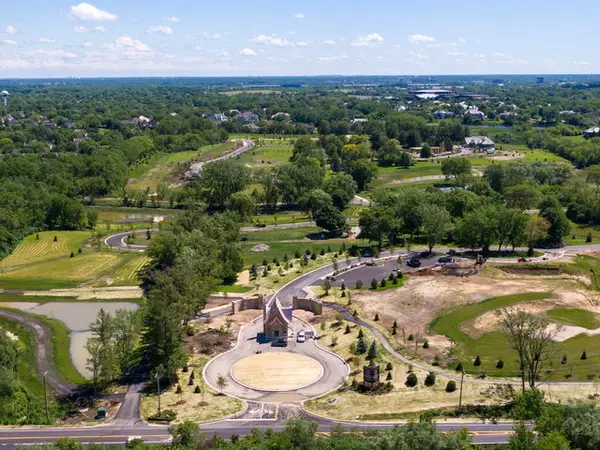 $875,000Active0.62 Acres
61 E Palatine Road, South Barrington, IL 60010
MLS# 12569663Listed by: COMPASS- New
 $365,000Active2.96 Acres
303 Algonquin Road, South Barrington, IL 60010
MLS# 12597728Listed by: RE/MAX LIBERTY 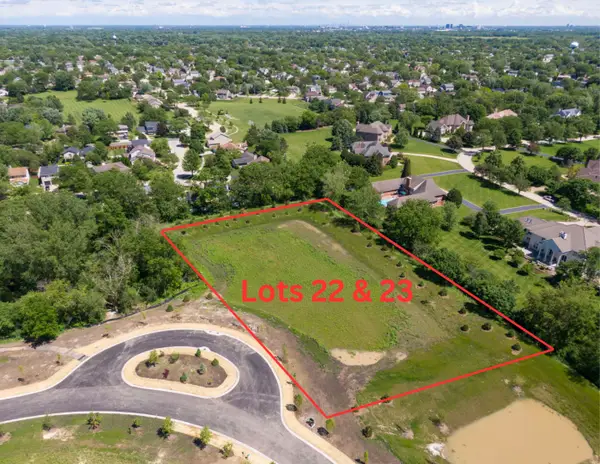 $1,299,000Active2.14 Acres
61 E Palatine Road, South Barrington, IL 60010
MLS# 12354623Listed by: COMPASS- New
 $235,000Active1.13 Acres
Address Withheld By Seller, South Barrington, IL 60010
MLS# 12594215Listed by: RE/MAX LIBERTY  $275,000Active2.78 Acres
Lot 4 E Mundhank Road, South Barrington, IL 60010
MLS# 11818155Listed by: COLDWELL BANKER REALTY
Local realty services provided by:CENTURY 21 Gold Key Realty, CENTURY 21 All Pro Real Estate
Copyright 2026 Prime MLS, Inc. All rights reserved. This information is deemed reliable, but not guaranteed. The data relating to real estate displayed on this Site comes in part from the IDX Program of Prime MLS. The information being provided is for consumers’ personal, noncommercial use and may not be used for any purpose other than to identify prospective properties consumers may be interested in purchasing. Data last updated March 27, 2026
Copyright 2026 Midwest Real Estate Data LLC. All rights reserved. The data relating to real estate for sale on this web site comes in part from the Broker Reciprocity Program of the Midwest Real Estate Data LLC. Listing information is deemed reliable but not guaranteed.
Neighborhoods near South Barrington, IL
Zip codes near South Barrington, IL
- 60004 homes for sale
- 60005 homes for sale
- 60008 homes for sale
- 60010 homes for sale
- 60021 homes for sale
- 60067 homes for sale
- 60074 homes for sale
- 60103 homes for sale
- 60107 homes for sale
- 60110 homes for sale
- 60120 homes for sale
- 60123 homes for sale
- 60133 homes for sale
- 60169 homes for sale
- 60172 homes for sale
- 60173 homes for sale
- 60192 homes for sale
- 60193 homes for sale
- 60194 homes for sale
- 60195 homes for sale
Popular searches near South Barrington, IL
- Barrington Township homes for sale
- Barrington homes for sale
- Barrington homes for sale
- Barrington Hills homes for sale
- Bartlett homes for sale
- Cuba homes for sale
- Deer Park homes for sale
- East Dundee homes for sale
- Elgin homes for sale
- Hanover homes for sale
- Hanover Park homes for sale
- Hoffman Estates homes for sale
- Inverness homes for sale
- Palatine Township homes for sale
- Palatine homes for sale
- Rolling Meadows homes for sale
- Schaumburg Township homes for sale
- Schaumburg homes for sale
- Streamwood homes for sale
- West Dundee homes for sale
Protect your home and budget from life's surprises with an Assurant Home Warranty, backed by a partner that supports you through every step of homeownership. Explore Plans.
©2026 Century 21 Real Estate LLC. All rights reserved. CENTURY 21®, the CENTURY 21 Logo and C21® are service marks owned by Century 21 Real Estate LLC. Century 21 Real Estate LLC fully supports the principles of the Fair Housing Act and the Equal Opportunity Act. Each office is independently owned and operated. Listing information is deemed reliable but not guaranteed accurate.