- Black Rock, Bridgeport homes for sale
- Black Rock, Bridgeport homes for sale
- Brooklawn/St. Vincent, Bridgeport homes for sale
- Brooklawn/St. Vincent, Bridgeport homes for sale
- Central Bridgeport, Bridgeport homes for sale
- Central Bridgeport, Bridgeport homes for sale
- Central Business District, Bridgeport homes for sale
- East Bridgeport, Bridgeport homes for sale
- East End, Bridgeport homes for sale
- East End, Bridgeport homes for sale
- East Side, Bridgeport homes for sale
- East Side, Bridgeport homes for sale
- South Bridgeport, Bridgeport homes for sale
- South Bridgeport, Bridgeport homes for sale
- The Hollow, Bridgeport homes for sale
- The Hollow, Bridgeport homes for sale
- West Bridgeport, Bridgeport homes for sale
- West Bridgeport, Bridgeport homes for sale
- West End/West Side, Bridgeport homes for sale
- West End/West Side, Bridgeport homes for sale
South End, Bridgeport, CT - homes for sale
9 of 9 results displayed
- Coming Soon
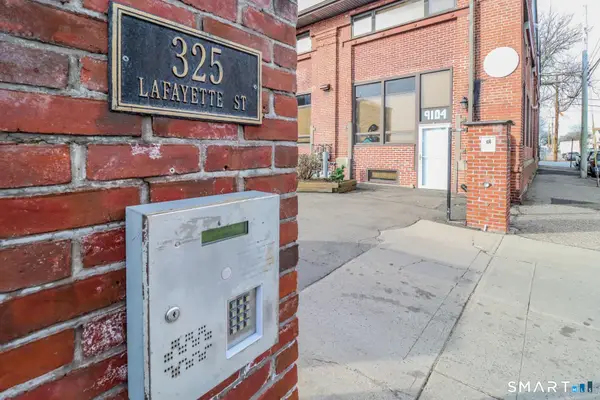 $205,000Coming Soon2 beds 1 baths
325 Lafayette Street #1105, Bridgeport, CT 06604
MLS# 24160893Listed by: Real Broker CT, LLC  $129,900Pending2 beds 1 baths900 sq. ft.
16 Cole Street, Bridgeport, CT 06604
MLS# 24161077Listed by: RE/MAX Right Choice $80,000Active2 beds 1 baths800 sq. ft.
419 Iranistan Avenue, Bridgeport, CT 06604
MLS# 24159884Listed by: YellowBrick Real Estate LLC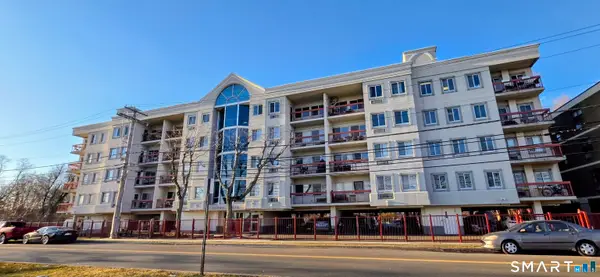 $199,000Active1 beds 1 baths621 sq. ft.
850 Atlantic Street #212, Bridgeport, CT 06604
MLS# 24148048Listed by: KW Legacy Partners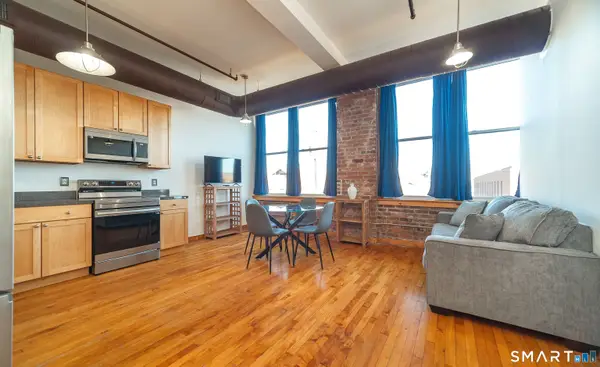 $150,000Active-- beds 1 baths601 sq. ft.
325 Lafayette Street #8205, Bridgeport, CT 06604
MLS# 24147652Listed by: William Raveis Real Estate $479,900Pending4 beds 3 baths1,284 sq. ft.
95 Austin Street, Bridgeport, CT 06604
MLS# 24133703Listed by: Premier Re Group LLC $99,000Pending2 beds 1 baths800 sq. ft.
217 Alsace Street, Bridgeport, CT 06604
MLS# 24129655Listed by: Larracuente & Johnson Realty, LLC $65,000Pending1 beds 1 baths800 sq. ft.
22 Sims Street, Bridgeport, CT 06604
MLS# 24124850Listed by: Keller Williams Realty Prtnrs.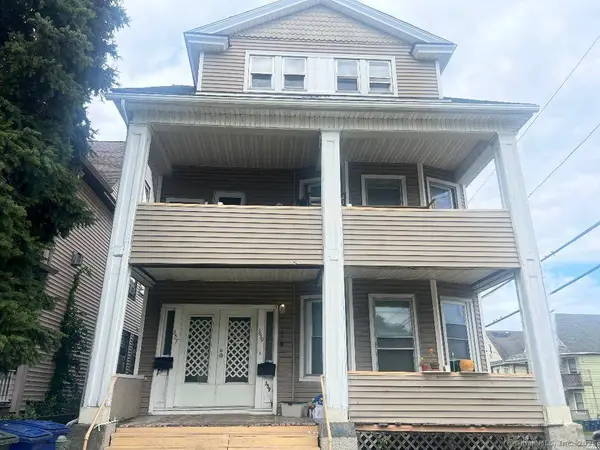 $500,000Pending9 beds 3 baths4,293 sq. ft.
357 Park Avenue, Bridgeport, CT 06604
MLS# 24121000Listed by: BHGRE Shore & Country
Local realty services provided by:CENTURY 21 AllPoints Realty
The data relating to real estate for sale on this website appears in part through the SMARTMLS Internet Data Exchange program, a voluntary cooperative exchange of property listing data between licensed real estate brokerage firms, and is provided by SMARTMLS through a licensing agreement. Listing information is from various brokers who participate in the SMARTMLS IDX program and not all listings may be visible on the site. The property information being provided on or through the website is for the personal, non-commercial use of consumers and such information may not be used for any purpose other than to identify prospective properties consumers may be interested in purchasing. Some properties which appear for sale on the website may no longer be available because they are for instance, under contract, sold or are no longer being offered for sale. Property information displayed is deemed reliable but is not guaranteed. Copyright 2026 SmartMLS, Inc.
Popular neighborhoods near South End, Bridgeport, CT
Zip codes near South End, Bridgeport, CT
- 06460 homes for sale
- 06461 homes for sale
- 06484 homes for sale
- 06604 homes for sale
- 06605 homes for sale
- 06606 homes for sale
- 06607 homes for sale
- 06608 homes for sale
- 06610 homes for sale
- 06611 homes for sale
- 06612 homes for sale
- 06614 homes for sale
- 06615 homes for sale
- 06824 homes for sale
- 06825 homes for sale
- 06851 homes for sale
- 06855 homes for sale
- 06880 homes for sale
- 06883 homes for sale
- 06890 homes for sale
Counties near South End, Bridgeport, CT
- Bergen County homes for sale
- Bronx County homes for sale
- Dutchess County homes for sale
- Fairfield County homes for sale
- Greater Bridgeport County homes for sale
- Litchfield County homes for sale
- Lower Connecticut River Valley County homes for sale
- Middlesex County homes for sale
- Nassau County homes for sale
- Naugatuck Valley County homes for sale
- New Haven County homes for sale
- New York County homes for sale
- Northwest Hills County homes for sale
- Putnam County homes for sale
- Queens County homes for sale
- Rockland County homes for sale
- South Central Connecticut County homes for sale
- Suffolk County homes for sale
- Westchester County homes for sale
- Western Connecticut County homes for sale
Protect your home and budget from life's surprises with an Assurant Home Warranty, backed by a partner that supports you through every step of homeownership. Explore Plans.
©2026 Century 21 Real Estate LLC. All rights reserved. CENTURY 21®, the CENTURY 21 Logo and C21® are service marks owned by Century 21 Real Estate LLC. Century 21 Real Estate LLC fully supports the principles of the Fair Housing Act and the Equal Opportunity Act. Each office is independently owned and operated. Listing information is deemed reliable but not guaranteed accurate.