- Broadway - Manchester, Los Angeles homes for sale
- Coolridge Triangle, Long Beach homes for sale
- Dairy, Long Beach homes for sale
- Deforest Park, Long Beach homes for sale
- Florence, Los Angeles homes for sale
- Grant (Cherry Manor), Long Beach homes for sale
- Green Meadows, Los Angeles homes for sale
- Hamilton, Long Beach homes for sale
- Houghton Manor (Jordan), Long Beach homes for sale
- Lindbergh, Long Beach homes for sale
- McKinley, Long Beach homes for sale
- Paramount (Davenport Park), Long Beach homes for sale
- Ramona Park, Long Beach homes for sale
- Rancho Dominguez, Compton homes for sale
- South Los Angeles, Los Angeles homes for sale
- Starr King (Freeway Circle), Long Beach homes for sale
- The Southeast, Downey homes for sale
- Vermont Vista, Los Angeles homes for sale
- Watts, Los Angeles homes for sale
- Willowbrook, Los Angeles homes for sale
South Gate, CA - homes for sale
69 of 69 results displayed
- New
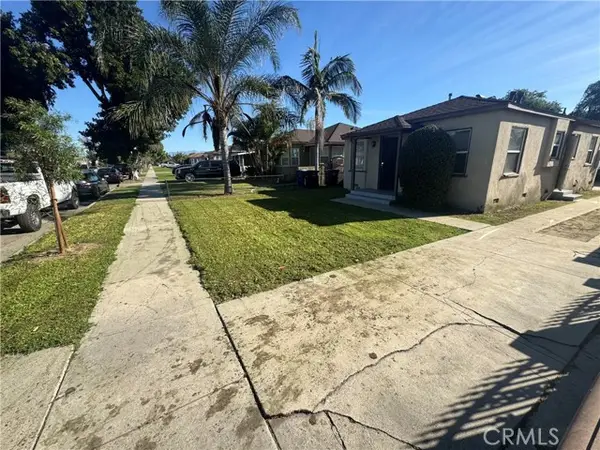
 $550,000Active2 beds 1 baths1,300 sq. ft.
9623 Hunt, South Gate, CA 90280
MLS# DW26066282Listed by: J A T S ENTERPRISES, INC. - New
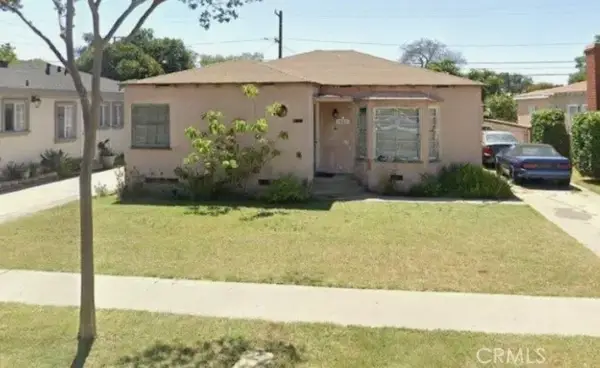
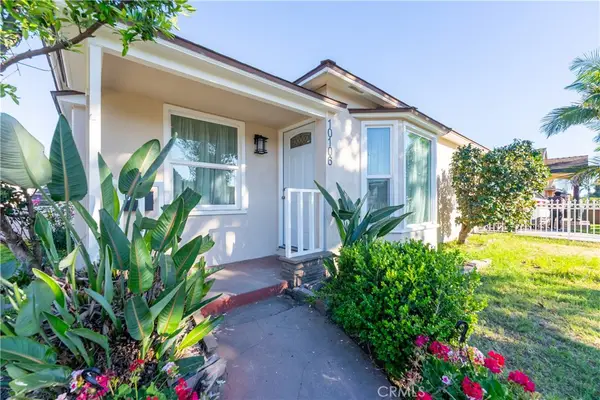 $829,000Active-- beds -- baths1,688 sq. ft.
10106 Capistrano Ave, South Gate, CA 90280
MLS# RS26063387Listed by: COLDWELL BANKER ENVISION - New
 $619,000Active2 beds 3 baths1,571 sq. ft.
9646 Karmont, South Gate, CA 90280
MLS# PW26064890Listed by: AMERICA REALTY LOS ANGELES - New
 $1,100,000Active9 beds 4 baths
9411 Madison Avenue, South Gate, CA 90280
MLS# TR26062210Listed by: PREMIER PROPERTIES - New
 $749,900Active4 beds 3 baths1,475 sq. ft.
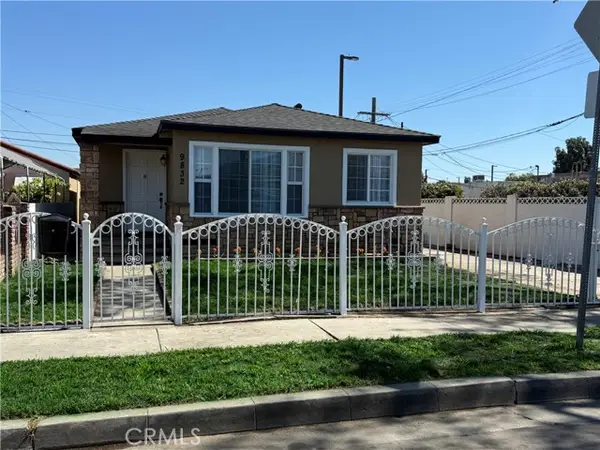
9832 San Miguel Avenue, South Gate, CA 90280
MLS# CRDW26061494Listed by: VIP RE FIRM - New
 $599,950Active2 beds 1 baths928 sq. ft.
10600 Hildreth Avenue, South Gate, CA 90280
MLS# CROC26060869Listed by: EXP REALTY OF CALIFORNIA INC - New
 $715,000Active4 beds 2 baths1,790 sq. ft.
10001 Bowman Avenue, South Gate, CA 90280
MLS# CRPW26057975Listed by: ONYX REALTY & FINC. SERV., INC  $775,000Active3 beds 2 baths1,283 sq. ft.
10731 Wright Road, South Gate, CA 90280
MLS# CRCV26056300Listed by: ANOMALY REAL ESTATE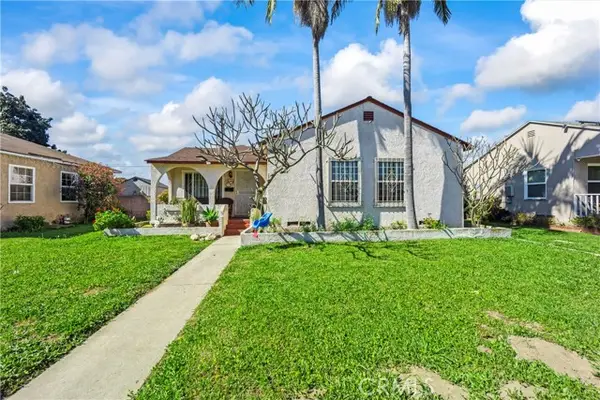 $710,000Active2 beds 1 baths1,253 sq. ft.
10239 Garfield Avenue, South Gate, CA 90280
MLS# CROC26056641Listed by: EXP REALTY OF SOUTHERN CALIFORNIA, INC $825,000Active3 beds -- baths1,807 sq. ft.
8469 Cypress, South Gate, CA 90280
MLS# CRPW26055165Listed by: AMETHYST REAL ESTATE GROUP $620,000Pending3 beds 3 baths1,540 sq. ft.
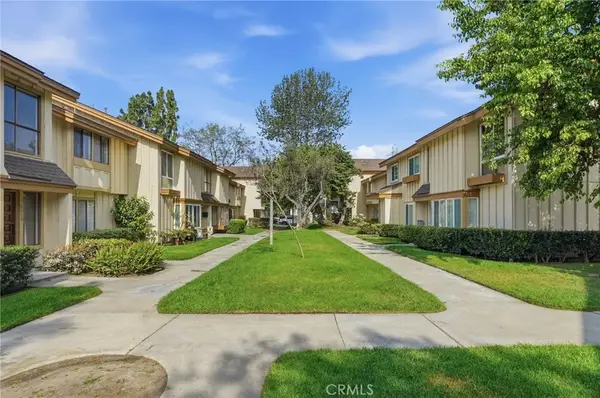
5950 Imperial #96, South Gate, CA 90280
MLS# CRDW26055435Listed by: REAL ESTATE BUTTERFLIES $2,395,000Active10 beds 10 baths5,354 sq. ft.
9711 Salt Lake Avenue, South Gate, CA 90280
MLS# 26663731Listed by: REMAX COMMERCIAL AND INVESTMENT REALTY $650,000Pending3 beds 3 baths1,571 sq. ft.
9781 S Karmont Avenue, South Gate, CA 90280
MLS# CL26660775Listed by: COLDWELL BANKER ENVISION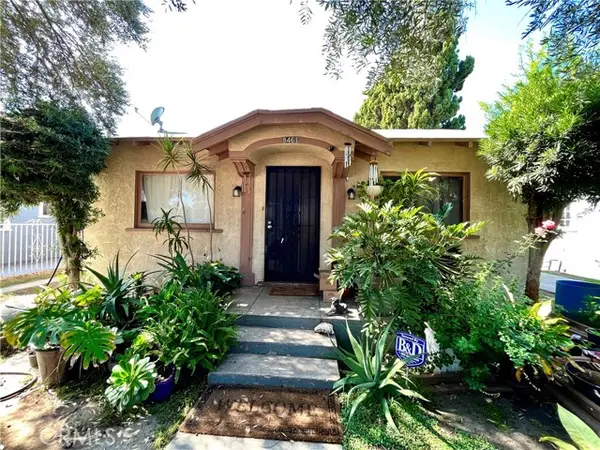 $825,000Active4 beds -- baths1,610 sq. ft.
8461 Garden View Avenue, South Gate, CA 90280
MLS# CRPW26043686Listed by: URBAN STREET VENTURES, INC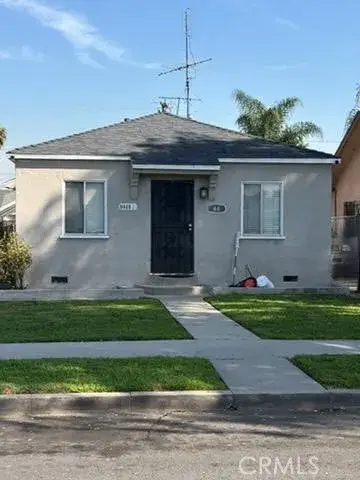 $849,000Active4 beds 2 baths
8468 Virginia, South Gate, CA 90280
MLS# DW26038790Listed by: IET REAL ESTATE $1,149,999Active6 beds 4 baths2,648 sq. ft.
8976 Mcnerney #A-B, South Gate, CA 90280
MLS# RS26041617Listed by: EXCELLENCE RE REAL ESTATE $699,000Active3 beds 2 baths1,307 sq. ft.
3284 Cherokee Avenue, South Gate, CA 90280
MLS# CL26655607Listed by: CALL IT CLOSED INTERNATIONAL,INC $1,050,000Active3 beds 5 baths2,612 sq. ft.
8137 Beechwood Avenue, South Gate, CA 90280
MLS# 26657209Listed by: REMAX COMMERCIAL AND INVESTMENT REALTY $694,000Active4 beds 3 baths1,571 sq. ft.
9652 Karmont, South Gate, CA 90280
MLS# CRIN26039928Listed by: REALTY BROKERAGE GROUP INC $1,975,000Active9 beds 8 baths
9643 Mallison Avenue, South Gate, CA 90280
MLS# OC26034848Listed by: PROPERTY LEADERS
 $589,900Active2 beds 1 baths825 sq. ft.
9710 San Miguel, South Gate, CA 90280
MLS# DW26038998Listed by: CENTURY 21 REALTY MASTERS $585,000Pending2 beds 3 baths1,336 sq. ft.
9833 Karmont, South Gate, CA 90280
MLS# SR26038055Listed by: NEXTHOME REAL ESTATE ROCKSTARS $699,900Active2 beds 1 baths1,452 sq. ft.
8952 Dudlext, South Gate, CA 90280
MLS# CRIV26034458Listed by: BEECHWOOD REALTY $775,000Active3 beds 2 baths1,345 sq. ft.
2548 Missouri Avenue, South Gate, CA 90280
MLS# CRDW26030959Listed by: GOOD OPPORTUNITY COMPANY INC. $939,900Active7 beds -- baths3,304 sq. ft.
3062 Ardmore, South Gate, CA 90280
MLS# CRCV26026220Listed by: EQUITY SMART REAL ESTATE SERVICES $764,900Pending3 beds 3 baths2,077 sq. ft.
9415 Annetta, South Gate, CA 90280
MLS# DW26017139Listed by: EXP REALTY OF CALIFORNIA, INC. $899,000Active-- beds -- baths2,252 sq. ft.
8954 S Gate, South Gate, CA 90280
MLS# DW26023252Listed by: CENTURY 21 REALTY MASTERS $730,000Active4 beds -- baths1,508 sq. ft.
10127 Pinehurst, South Gate, CA 90280
MLS# CRIG26021863Listed by: KELLER WILLIAMS REALTY- NORCO $1,499,999Active-- beds -- baths3,960 sq. ft.
9723 San Juan, South Gate, CA 90280
MLS# DW26022544Listed by: REALTY ONE GROUP HOMELINK $765,000Pending6 beds 4 baths2,107 sq. ft.
2703 Missouri, South Gate, CA 90280
MLS# CRRS26021845Listed by: BIG BLOCK POWERHOUSE REALTY $724,900Active3 beds 2 baths1,318 sq. ft.
10525 Washington Avenue, South Gate, CA 90280
MLS# PW26018807Listed by: REDFIN CORPORATION $1,000,000Active6 beds 4 baths1,319 sq. ft.
2520 Ohio Avenue, South Gate, CA 90280
MLS# CRIV26014323Listed by: REAL ESTATE ONE $2,050,000Active16 beds 10 baths6,915 sq. ft.
2844 Ardmore Avenue, South Gate, CA 90280
MLS# 26639009Listed by: REMAX COMMERCIAL AND INVESTMENT REALTY $875,000Active-- beds -- baths1,785 sq. ft.
3007 Sequoia, South Gate, CA 90280
MLS# DW26007134Listed by: CENTURY 21 ALLSTARS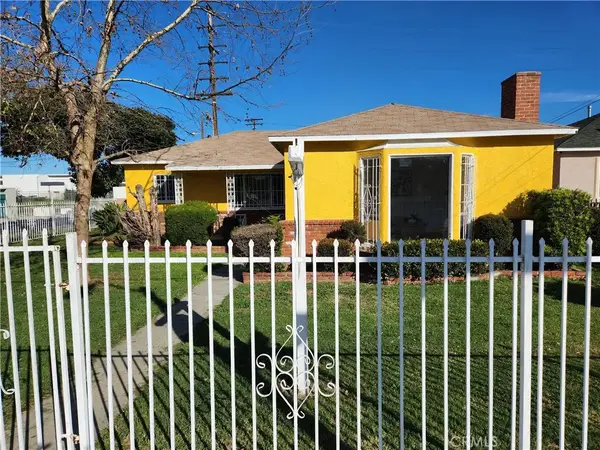 $799,000Pending3 beds 1 baths1,154 sq. ft.
5301 Aldrich Road, South Gate, CA 90280
MLS# PF26006821Listed by: BOT REAL ESTATE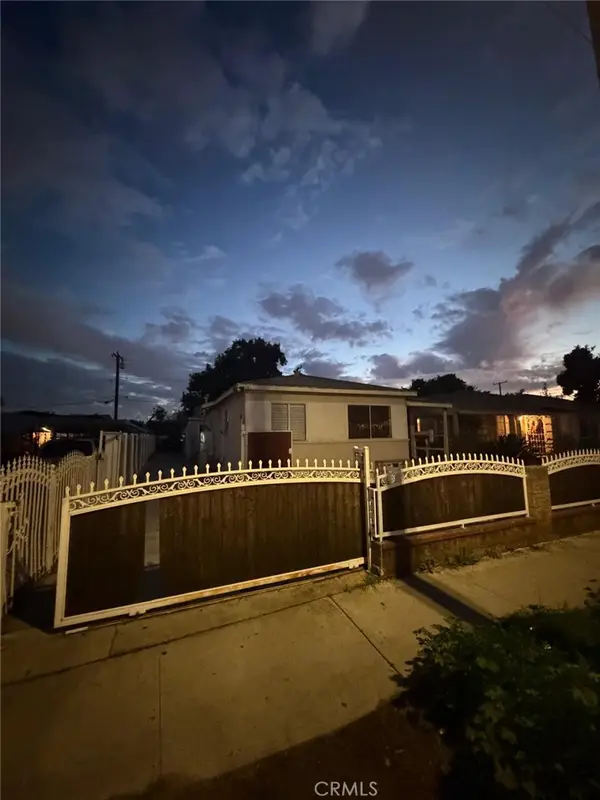 $850,000Pending5 beds 2 baths1,854 sq. ft.
3358 Michigan Avenue, South Gate, CA 90280
MLS# SR25271118Listed by: LUIS ALEJANDRO TIPACTI $599,000Active2 beds 2 baths1,571 sq. ft.
9832 Karmont Avenue, South Gate, CA 90280
MLS# PW25275230Listed by: REDFIN CORPORATION $1,000,000Active-- beds -- baths2,240 sq. ft.
10240 Atlantic Ave, South Gate, CA 90280
MLS# DW25276091Listed by: CENTURY 21 ALLSTARS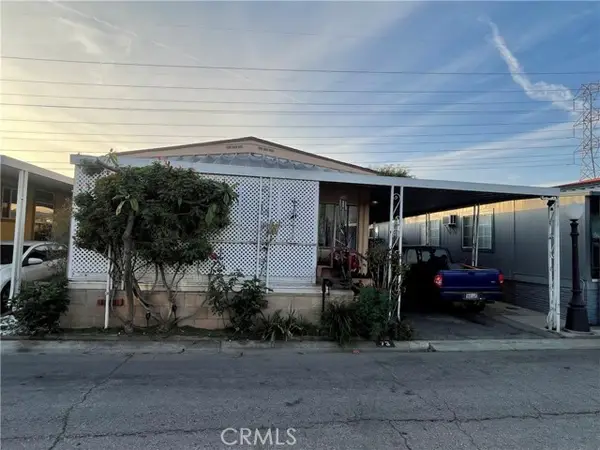 $169,999Active2 beds 2 baths1,160 sq. ft.
10001 Frontage Road #73, South Gate, CA 90280
MLS# CRDW25278317Listed by: EXCELLENCE RE REAL ESTATE, INC. $998,800Active4 beds 3 baths1,626 sq. ft.
3310 Cherokee, South Gate, CA 90280
MLS# CV25271966Listed by: CENTURY 21 EXPERIENCE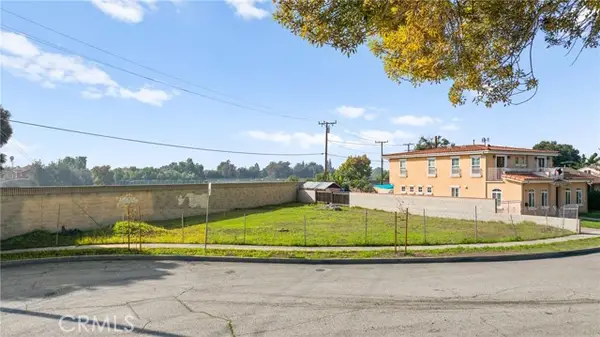 $365,000Active0.14 Acres
0 Nevada Avenue, South Gate, CA 90280
MLS# CRIV25271479Listed by: ROA CALIFORNIA INC. $365,000Active0.14 Acres
0 Nevada Avenue, South Gate, CA 90280
MLS# IV25271479Listed by: ROA CALIFORNIA INC. $689,900Active2 beds 1 baths1,034 sq. ft.
10406 San Carlos, South Gate, CA 90280
MLS# CRDW25269352Listed by: VIP RE FIRM $1,400,000Pending-- beds -- baths3,968 sq. ft.
9421 Dearborn, South Gate, CA 90280
MLS# DW25266774Listed by: ROA CALIFORNIA INC. $595,000Active0 Acres
12221 Garfield, South Gate, CA 90280
MLS# RS25258091Listed by: ROBERT CABRERA, BROKER $599,999Active3 beds 3 baths1,571 sq. ft.
10023 Karmont Avenue, South Gate, CA 90280
MLS# CRSR25258501Listed by: MAX ONE REAL ESTATE $650,000Active2 beds 1 baths1,118 sq. ft.
9505 Bryson, South Gate, CA 90280
MLS# DW25259065Listed by: FODMR INC $1,195,000Active6 beds 5 baths4,050 sq. ft.
9601 San Juan Avenue, South Gate, CA 90280
MLS# DW25248924Listed by: AGR AND ASSOCIATES $1,195,000Active6 beds 5 baths4,050 sq. ft.
9601 San Juan Avenue, South Gate, CA 90280
MLS# DW25248924Listed by: AGR AND ASSOCIATES $649,999Pending2 beds 1 baths768 sq. ft.
8963 Bowman Avenue, South Gate, CA 90280
MLS# PW25244711Listed by: UPTOWN REALTORS $605,555Active3 beds 3 baths1,560 sq. ft.
5950 Imperial Hwy #88, South Gate, CA 90280
MLS# CRDW25243702Listed by: KELLER WILLIAMS SELA $570,000Active2 beds 1 baths660 sq. ft.
8600 S Gate, South Gate, CA 90280
MLS# CRDW25241826Listed by: PRIME TIME REALTY & ASSOCIATES $609,500Active3 beds 3 baths1,560 sq. ft.
5950 Imperial Hwy Unit 35, South Gate, CA 90280
MLS# CRDW25239770Listed by: REAL ESTATE BUTTERFLIES $619,999Active2 beds 1 baths732 sq. ft.
9616 Bowman Avenue, South Gate, CA 90280
MLS# CRCV25214495Listed by: REALTY ONE GROUP ROADS $619,999Active2 beds 1 baths732 sq. ft.
9616 Bowman Avenue, South Gate, CA 90280
MLS# CV25214495Listed by: REALTY ONE GROUP ROADS $2,032,250Active12 beds 12 baths5,148 sq. ft.
9222 California Avenue, South Gate, CA 90280
MLS# 25599499Listed by: INGENIOUS ASSET GROUP, INC. $610,000Pending3 beds 3 baths1,664 sq. ft.
5950 Imperial Highway #2, South Gate, CA 90280
MLS# PW25215734Listed by: BRET LEWIS, BROKER $1,375,000Pending10 beds 5 baths3,847 sq. ft.
3220 Tecumseh Avenue, South Gate, CA 90280
MLS# 25589237Listed by: REMAX COMMERCIAL AND INVESTMENT REALTY $1,350,000Active8 beds -- baths3,016 sq. ft.
9525 Bowman Avenue, South Gate, CA 90280
MLS# CRSB25199977Listed by: SOUTH BAY COAST REALTY $620,000Pending2 beds 2 baths
9718 Otis Street, South Gate, CA 90280
MLS# PW26019455Listed by: REAL BROKER $999,998Active5 beds 5 baths
10249 California Avenue, South Gate, CA 90280
MLS# DW25191033Listed by: C-21 REALTY TEAM $499,950Pending3 beds 2 baths1,264 sq. ft.
10109 Jackson Avenue, South Gate, CA 90280
MLS# DW19197705Listed by: 24 HOUR REAL ESTATE $559,000Pending-- beds 4 baths
8999 Mcnerney Avenue, South Gate, CA 90280
MLS# DW20002782Listed by: CENTURY 21 A BETTER SERVICE $795,000Active-- beds -- baths1,051 sq. ft.
8995 Victoria Avenue, South Gate, CA 90280
MLS# DW26035447Listed by: CENTURY 21 A BETTER SERVICE $849,000Active5 beds 3 baths2,165 sq. ft.
2500 Illinois Avenue, South Gate, CA 90280
MLS# CRMB25062563Listed by: CENTRAL FINANCIAL AND REALTY $840,000Active2 beds -- baths3,953 sq. ft.
9612 Long Beach Boulevard, South Gate, CA 90280
MLS# CRSR25054219Listed by: RBS REALTY $840,000Active3 beds -- baths3,753 sq. ft.
9616 Long Beach Boulevard, South Gate, CA 90280
MLS# CRSR25053980Listed by: RBS REALTY $655,000Active3 beds 2 baths1,488 sq. ft.
3816 Liberty Boulevard, South Gate, CA 90280
MLS# CRAR24069463Listed by: PUREMOTIVE REALTY INC. $699,000Active4 beds -- baths1,249 sq. ft.
9824 San Antonio Avenue, South Gate, CA 90280
MLS# CL23313205Listed by: YAZ REALTY, INC.
Local realty services provided by:CENTURY 21 Affiliated, CENTURY 21 Lois Lauer Realty, CENTURY 21 Sierra Properties
This information is deemed reliable but not guaranteed. You should rely on this information only to decide whether or not to further investigate a particular property. BEFORE MAKING ANY OTHER DECISION, YOU SHOULD PERSONALLY INVESTIGATE THE FACTS (e.g. square footage and lot size) with the assistance of an appropriate professional. You may use this information only to identify properties you may be interested in investigating further. All uses except for personal, non-commercial use in accordance with the foregoing purpose are prohibited. Redistribution or copying of this information, any photographs or video tours is strictly prohibited. This information is derived from the Internet Data Exchange (IDX) service provided by San Diego MLS®. Displayed property listings may be held by a brokerage firm other than the broker and/or agent responsible for this display. The information and any photographs and video tours and the compilation from which they are derived is protected by copyright. Compilation © 2020 San Diego MLS®, Inc.
The information being provided by California Regional MLS (Southern California) is for the consumer's personal, non-commercial use and may not be used for any purpose other than to identify prospective properties consumer may be interested in purchasing. Any information relating to real estate for sale referenced on this web site comes from the Internet Data Exchange (IDX) program of the California Regional MLS (Southern California). CENTURY 21 Lois Lauer Realty is not a Multiple Listing Service (MLS), nor does it offer MLS access. This website is a service of CENTURY 21 Lois Lauer Realty, a broker participant of California Regional MLS (Southern California). This web site may reference real estate listing(s) held by a brokerage firm other than the broker and/or agent who owns this web site.
The accuracy of all information, regardless of source, including but not limited to open house information, square footages and lot sizes, is deemed reliable but not guaranteed and should be personally verified through personal inspection by and/or with the appropriate professionals. The data contained herein is copyrighted by California Regional MLS (Southern California) and is protected by all applicable copyright laws. Any unauthorized dissemination of this information is in violation of copyright laws and is strictly prohibited.
Copyright 2021 California Regional MLS (Southern California). All rights reserved.
Neighborhoods near South Gate, CA
Zip codes near South Gate, CA
- 90001 homes for sale
- 90002 homes for sale
- 90040 homes for sale
- 90058 homes for sale
- 90059 homes for sale
- 90061 homes for sale
- 90201 homes for sale
- 90220 homes for sale
- 90221 homes for sale
- 90222 homes for sale
- 90240 homes for sale
- 90241 homes for sale
- 90242 homes for sale
- 90255 homes for sale
- 90262 homes for sale
- 90270 homes for sale
- 90280 homes for sale
- 90706 homes for sale
- 90723 homes for sale
- 90805 homes for sale
Popular searches near South Gate, CA
- Bell homes for sale
- Bell Gardens homes for sale
- Bellflower homes for sale
- Commerce homes for sale
- Compton homes for sale
- Cudahy homes for sale
- Downey homes for sale
- Downey-Norwalk homes for sale
- East Rancho Dominguez homes for sale
- Florence-Graham homes for sale
- Huntington Park homes for sale
- Lynwood homes for sale
- Maywood homes for sale
- Paramount homes for sale
- Rancho Dominguez homes for sale
- South Gate-East Los Angeles homes for sale
- Walnut Park homes for sale
- West Rancho Dominguez homes for sale
- Westmont homes for sale
- Willowbrook homes for sale
Protect your home and budget from life's surprises with an Assurant Home Warranty, backed by a partner that supports you through every step of homeownership. Explore Plans.
©2026 Century 21 Real Estate LLC. All rights reserved. CENTURY 21®, the CENTURY 21 Logo and C21® are service marks owned by Century 21 Real Estate LLC. Century 21 Real Estate LLC fully supports the principles of the Fair Housing Act and the Equal Opportunity Act. Each office is independently owned and operated. Listing information is deemed reliable but not guaranteed accurate.