- Copper Hills, West Jordan homes for sale
- Copperview, Riverton homes for sale
- Country Crossing, South Jordan homes for sale
- Country Park, South Jordan homes for sale
- Daybreak, South Jordan homes for sale
- Eastlake Village, South Jordan homes for sale
- Fort Herriman, Herriman homes for sale
- Founders' Park Village, South Jordan homes for sale
- Glenmoor, South Jordan homes for sale
- Glenmoor Country Estates, South Jordan homes for sale
- Harvest Park, Herriman homes for sale
- Herriman Towne Center, Herriman homes for sale
- Highland, South Jordan homes for sale
- Midas Creek, South Jordan homes for sale
- North Riverton, Riverton homes for sale
- North Shore Village, South Jordan homes for sale
- Parkway, South Jordan homes for sale
- Rushton View, South Jordan homes for sale
- South Station Village, South Jordan homes for sale
- Western Springs, Herriman homes for sale
South Jordan, UT - homes for sale
173 of 173 results displayed
- New
 $755,050Active4 beds 4 baths2,904 sq. ft.
11373 S Watercourse Rd W #203, South Jordan, UT 84009
MLS# 2147004Listed by: S H REALTY LC - New
 $604,990Active3 beds 2 baths2,663 sq. ft.
11434 S Glass Hill Dr, South Jordan, UT 84009
MLS# 2146620Listed by: DESTINATION REAL ESTATE - New
 $858,280Active3 beds 3 baths3,510 sq. ft.
6824 W South Jordan Pkwy S #469, South Jordan, UT 84009
MLS# 2146340Listed by: S H REALTY LC - New
 $447,305Active3 beds 3 baths1,813 sq. ft.
11033 S S Freestone Rd #127, South Jordan, UT 84009
MLS# 2146096Listed by: S H REALTY LC - New
 $637,388Active3 beds 3 baths2,720 sq. ft.
5306 W Center Field Dr W #137, South Jordan, UT 84009
MLS# 2146132Listed by: S H REALTY LC - New
 $390,425Active2 beds 2 baths1,463 sq. ft.
11029 S Freestone Rd W #125, South Jordan, UT 84009
MLS# 2145856Listed by: S H REALTY LC - New
 $559,900Active3 beds 4 baths2,300 sq. ft.
5400 W Center Field Dr S #102, South Jordan, UT 84009
MLS# 2145305Listed by: HOLMES HOMES REALTY - New
 $589,900Active4 beds 4 baths2,300 sq. ft.
5400 W Center Field Dr S #107, South Jordan, UT 84009
MLS# 2145288Listed by: HOLMES HOMES REALTY  $649,990Pending3 beds 3 baths3,372 sq. ft.
6157 W Folly Island Way #530, South Jordan, UT 84009
MLS# 2144769Listed by: ADVANTAGE REAL ESTATE, LLC- New
 $792,900Active7 beds 5 baths4,310 sq. ft.
7142 W Lake Ave S, South Jordan, UT 84009
MLS# 2145038Listed by: HOLMES HOMES REALTY  $821,900Active5 beds 5 baths4,523 sq. ft.
7169 W Lake Ave, South Jordan, UT 84009
MLS# 2144894Listed by: HOLMES HOMES REALTY $459,990Active2 beds 2 baths1,321 sq. ft.
6167 W Folly Island Way, South Jordan, UT 84009
MLS# 2144742Listed by: ADVANTAGE REAL ESTATE, LLC $564,900Active3 beds 3 baths3,191 sq. ft.
7258 S Sage Run Rd #334, West Jordan, UT 84081
MLS# 2144566Listed by: TRI POINTE HOMES HOLDINGS, INC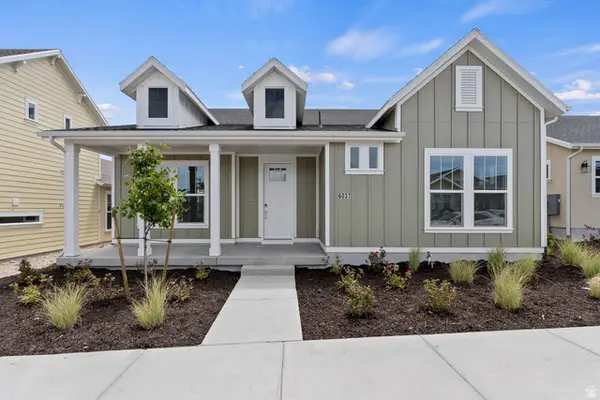 $549,990Pending2 beds 2 baths2,634 sq. ft.
6159 W Sparrow View Dr #556, South Jordan, UT 84009
MLS# 2137324Listed by: ADVANTAGE REAL ESTATE, LLC $597,990Pending3 beds 3 baths1,828 sq. ft.
6599 W South Jordan Pkwy, South Jordan, UT 84009
MLS# 2144454Listed by: DESTINATION REAL ESTATE $584,990Active3 beds 3 baths1,828 sq. ft.
6611 W South Jordan Pkwy, South Jordan, UT 84009
MLS# 2144445Listed by: DESTINATION REAL ESTATE $677,500Active3 beds 3 baths3,541 sq. ft.
11573 S Markfield Way #133, South Jordan, UT 84009
MLS# 2144159Listed by: S H REALTY LC $675,000Active3 beds 3 baths3,049 sq. ft.
11319 S Silver Pond Dr W #351, South Jordan, UT 84009
MLS# 2143049Listed by: S H REALTY LC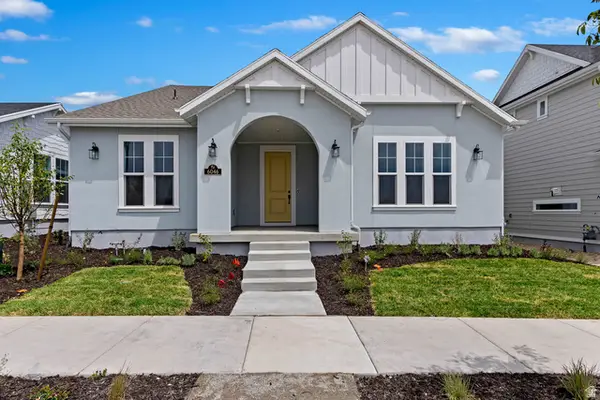 $589,990Active2 beds 2 baths1,665 sq. ft.
6154 W Sparrow View Dr, South Jordan, UT 84009
MLS# 2143117Listed by: ADVANTAGE REAL ESTATE, LLC $544,990Active3 beds 3 baths1,890 sq. ft.
6162 W Sparrow View Dr, South Jordan, UT 84009
MLS# 2142703Listed by: ADVANTAGE REAL ESTATE, LLC $649,595Active3 beds 3 baths2,904 sq. ft.
6864 W Lake Ave S #151, South Jordan, UT 84009
MLS# 2142705Listed by: S H REALTY LC $459,990Pending3 beds 2 baths1,557 sq. ft.
6639 W South Jordan Pkwy, South Jordan, UT 84009
MLS# 2142021Listed by: DESTINATION REAL ESTATE $449,990Pending3 beds 2 baths1,525 sq. ft.
6703 W South Jordan Pkwy, South Jordan, UT 84009
MLS# 2142027Listed by: DESTINATION REAL ESTATE $824,900Active3 beds 2 baths2,416 sq. ft.
10537 S 3010 W, South Jordan, UT 84095
MLS# 2141937Listed by: ULRICH REALTORS, INC. $478,017Active3 beds 4 baths1,822 sq. ft.
11317 S Lake Run Rd #113, South Jordan, UT 84009
MLS# 2141541Listed by: WEEKLEY HOMES, LLC $474,990Active3 beds 4 baths1,822 sq. ft.
11321 S Lake Run Rd #111, South Jordan, UT 84009
MLS# 2141519Listed by: WEEKLEY HOMES, LLC $550,900Pending3 beds 3 baths2,751 sq. ft.
7257 S Sage Run Rd #338, West Jordan, UT 84081
MLS# 2141490Listed by: TRI POINTE HOMES HOLDINGS, INC $707,000Active3 beds 3 baths3,382 sq. ft.
6697 W Salt Marsh Rd S #446, South Jordan, UT 84009
MLS# 2141218Listed by: S H REALTY LC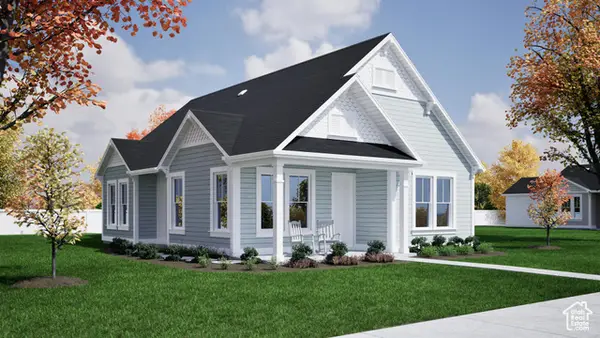 $439,990Active2 beds 2 baths1,161 sq. ft.
6206 W Franciscotti Dr, South Jordan, UT 84009
MLS# 2115734Listed by: ADVANTAGE REAL ESTATE, LLC $539,990Active3 beds 2 baths1,889 sq. ft.
6148 W Sparrow Dr, South Jordan, UT 84009
MLS# 2141096Listed by: ADVANTAGE REAL ESTATE, LLC $949,990Active3 beds 2 baths5,106 sq. ft.
7064 W Lake Ave #1-147, South Jordan, UT 84009
MLS# 2140880Listed by: DESTINATION REAL ESTATE $599,990Active3 beds 4 baths3,109 sq. ft.
6179 W Sparrow View Dr, South Jordan, UT 84009
MLS# 2124878Listed by: ADVANTAGE REAL ESTATE, LLC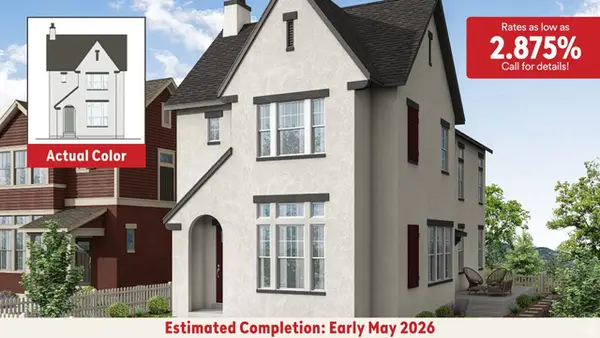 $649,990Active4 beds 3 baths2,664 sq. ft.
7021 W Lake Ave, South Jordan, UT 84009
MLS# 2140022Listed by: DESTINATION REAL ESTATE $594,990Active3 beds 2 baths2,471 sq. ft.
7029 W Lake Ave, South Jordan, UT 84009
MLS# 2139994Listed by: DESTINATION REAL ESTATE $584,990Active3 beds 2 baths2,392 sq. ft.
7027 W Lake Ave, South Jordan, UT 84009
MLS# 2140002Listed by: DESTINATION REAL ESTATE $1,369,990Pending5 beds 5 baths4,208 sq. ft.
11047 S Lake Island Dr #3-376, South Jordan, UT 84009
MLS# 2138579Listed by: DESTINATION REAL ESTATE $469,990Active2 beds 2 baths1,371 sq. ft.
6151 W Folly Island Way, South Jordan, UT 84009
MLS# 2139845Listed by: ADVANTAGE REAL ESTATE, LLC $949,990Active4 beds 3 baths5,026 sq. ft.
7077 W Lake Ave #1-149, South Jordan, UT 84009
MLS# 2139650Listed by: DESTINATION REAL ESTATE $900,000Active5 beds 4 baths3,510 sq. ft.
6719 W Miramar St S #502, South Jordan, UT 84009
MLS# 2139599Listed by: S H REALTY LC $582,900Pending3 beds 3 baths3,213 sq. ft.
7253 Sage Run Rd S #339, West Jordan, UT 84081
MLS# 2138590Listed by: TRI POINTE HOMES HOLDINGS, INC $692,515Active3 beds 3 baths3,049 sq. ft.
6723 W Miramar St S #503, South Jordan, UT 84009
MLS# 2138420Listed by: S H REALTY LC $449,990Pending2 beds 2 baths1,234 sq. ft.
11668 S Gannet Way #581, South Jordan, UT 84009
MLS# 2118906Listed by: ADVANTAGE REAL ESTATE, LLC $992,013Pending5 beds 4 baths4,391 sq. ft.
7123 W Docksider Dr, South Jordan, UT 84009
MLS# 2137149Listed by: HOLMES HOMES REALTY $399,990Pending3 beds 2 baths1,385 sq. ft.
6757 W South Jordan Pkwy, South Jordan, UT 84009
MLS# 2136865Listed by: DESTINATION REAL ESTATE $670,598Active4 beds 4 baths2,686 sq. ft.
7034 W Lake Ave S #122, South Jordan, UT 84009
MLS# 2136850Listed by: S H REALTY LC $607,727Pending3 beds 3 baths2,842 sq. ft.
6782 W 11800 S, South Jordan, UT 84009
MLS# 2136616Listed by: HOLMES HOMES REALTY $453,900Active3 beds 2 baths1,423 sq. ft.
5263 W Reventon Rd S #104, South Jordan, UT 84009
MLS# 2136395Listed by: HOLMES HOMES REALTY $606,707Active3 beds 3 baths2,842 sq. ft.
6814 W 11800 S, South Jordan, UT 84009
MLS# 2136344Listed by: HOLMES HOMES REALTY $815,000Active3 beds 3 baths3,510 sq. ft.
6634 W Salt Marsh Rd S #524, South Jordan, UT 84009
MLS# 2135859Listed by: S H REALTY LC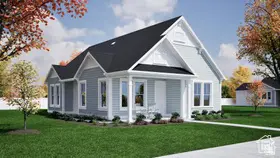 $433,990Pending2 beds 2 baths1,161 sq. ft.
6202 W Stone Mount Way #571, South Jordan, UT 84009
MLS# 2135651Listed by: ADVANTAGE REAL ESTATE, LLC $464,990Pending2 beds 2 baths1,371 sq. ft.
11679 S Willow Dr #567, South Jordan, UT 84009
MLS# 2135634Listed by: ADVANTAGE REAL ESTATE, LLC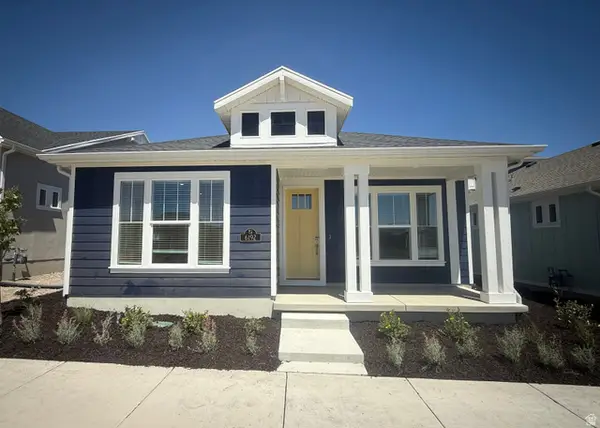 $469,990Pending2 beds 2 baths1,321 sq. ft.
11687 S Willow Dr #568, South Jordan, UT 84009
MLS# 2135282Listed by: ADVANTAGE REAL ESTATE, LLC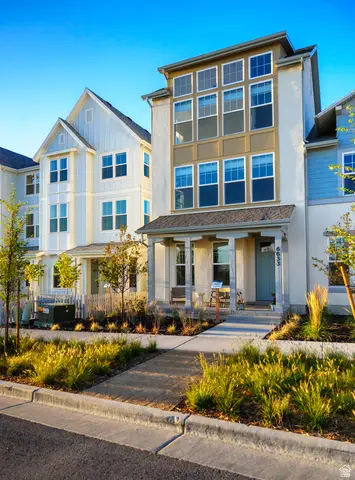 $429,900Active3 beds 2 baths1,557 sq. ft.
6759 W South Jordan Pkwy, South Jordan, UT 84009
MLS# 2135198Listed by: DESTINATION REAL ESTATE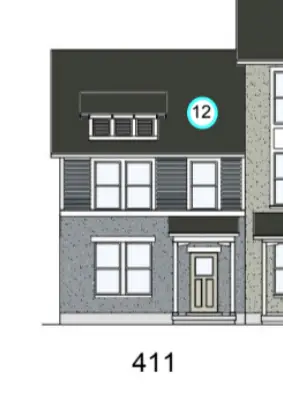 $434,990Pending3 beds 2 baths1,477 sq. ft.
6631 W South Jordan Pkwy, South Jordan, UT 84009
MLS# 2135173Listed by: DESTINATION REAL ESTATE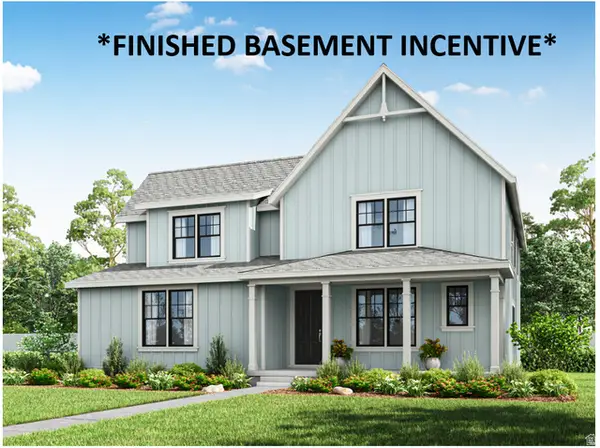 $881,131Pending3 beds 3 baths4,391 sq. ft.
7103 W Docksider Dr S, South Jordan, UT 84009
MLS# 2135030Listed by: HOLMES HOMES REALTY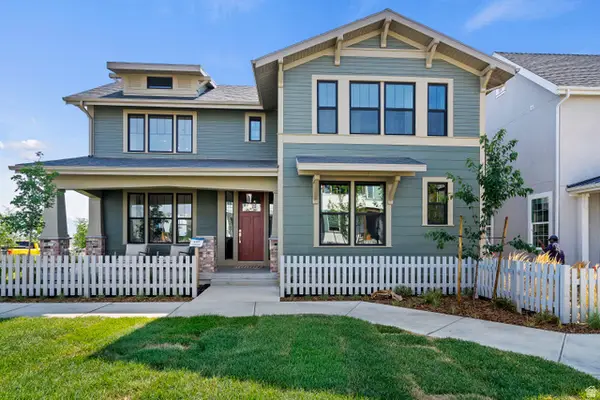 $900,900Active7 beds 6 baths4,995 sq. ft.
7091 W Docksider S, South Jordan, UT 84009
MLS# 2134899Listed by: HOLMES HOMES REALTY $649,990Pending3 beds 3 baths3,372 sq. ft.
6211 W Sparrow View Dr #565, South Jordan, UT 84009
MLS# 2134912Listed by: ADVANTAGE REAL ESTATE, LLC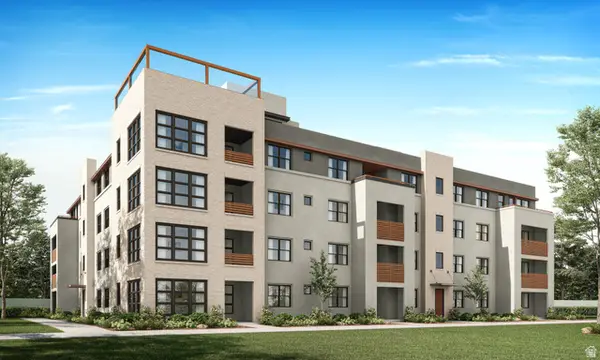 $464,900Active3 beds 2 baths1,502 sq. ft.
5263 W Reventon Rd S #103, South Jordan, UT 84009
MLS# 2134398Listed by: HOLMES HOMES REALTY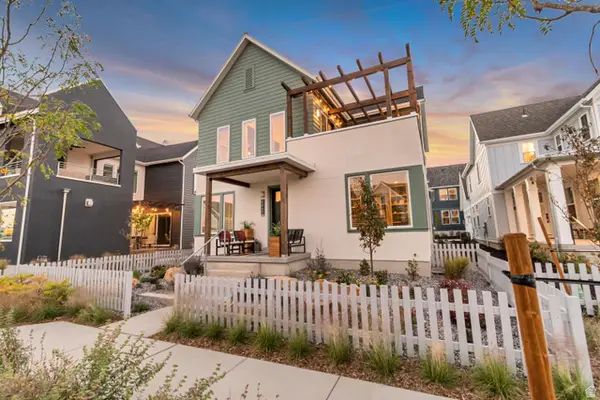 $829,900Pending5 beds 4 baths3,382 sq. ft.
6648 W Miramar St S #532, South Jordan, UT 84009
MLS# 2133466Listed by: S H REALTY LC $540,830Active3 beds 3 baths2,289 sq. ft.
11368 S Watercourse Rd #388, South Jordan, UT 84009
MLS# 2133033Listed by: HOLMES HOMES REALTY $1,070,000Active5 beds 4 baths5,013 sq. ft.
7086 W Docksider Dr #274, South Jordan, UT 84009
MLS# 2132403Listed by: AIM REALTY $521,170Active4 beds 3 baths1,707 sq. ft.
11019 S Freestone Rd W #120, South Jordan, UT 84009
MLS# 2132443Listed by: S H REALTY LC $589,990Pending2 beds 2 baths3,351 sq. ft.
6189 W Stone Mt Way #591, South Jordan, UT 84009
MLS# 2132319Listed by: ADVANTAGE REAL ESTATE, LLC $924,989Active4 beds 4 baths3,729 sq. ft.
6818 W South Jordan Pkwy S #470, South Jordan, UT 84009
MLS# 2132364Listed by: S H REALTY LC $842,250Active5 beds 4 baths4,391 sq. ft.
7111 W Docksider Dr S, South Jordan, UT 84009
MLS# 2131943Listed by: HOLMES HOMES REALTY $549,990Pending2 beds 2 baths1,665 sq. ft.
6212 W Stone Mt Way #570, South Jordan, UT 84009
MLS# 2131582Listed by: ADVANTAGE REAL ESTATE, LLC $597,990Pending3 beds 2 baths2,471 sq. ft.
11383 S Easy Bee Rd, South Jordan, UT 84009
MLS# 2130062Listed by: DESTINATION REAL ESTATE $494,900Pending3 beds 2 baths1,502 sq. ft.
5263 W Reventon Rd S #403, South Jordan, UT 84009
MLS# 2129727Listed by: HOLMES HOMES REALTY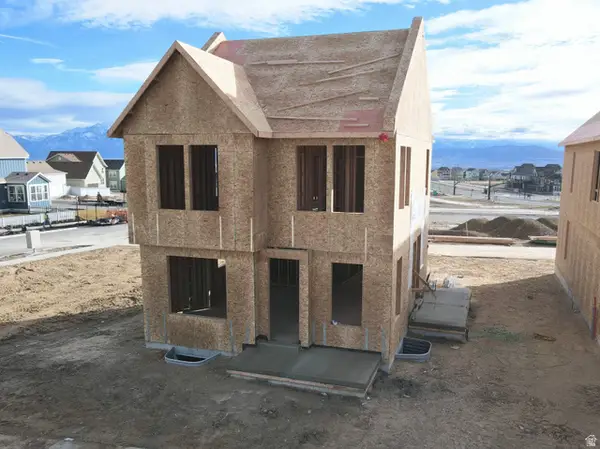 $650,000Active4 beds 4 baths2,686 sq. ft.
6709 W Miramar St S #506, South Jordan, UT 84009
MLS# 2129625Listed by: S H REALTY LC $744,996Active4 beds 4 baths3,154 sq. ft.
6711 W Miramar St S #507, South Jordan, UT 84009
MLS# 2129645Listed by: S H REALTY LC $459,990Pending2 beds 2 baths1,371 sq. ft.
6188 W Stone Mount Way #573, South Jordan, UT 84009
MLS# 2128526Listed by: ADVANTAGE REAL ESTATE, LLC $454,990Pending2 beds 2 baths1,321 sq. ft.
6197 W Sparrow Dr #563, South Jordan, UT 84009
MLS# 2128528Listed by: ADVANTAGE REAL ESTATE, LLC $429,990Pending2 beds 2 baths1,161 sq. ft.
6203 W Sparrow View Dr #564, South Jordan, UT 84009
MLS# 2129859Listed by: ADVANTAGE REAL ESTATE, LLC $589,990Pending3 beds 3 baths2,282 sq. ft.
7043 W Lake Ave, South Jordan, UT 84009
MLS# 2128495Listed by: DESTINATION REAL ESTATE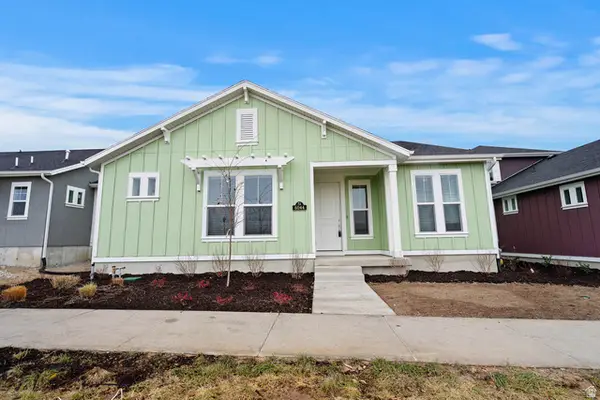 $697,030Pending2 beds 3 baths3,546 sq. ft.
6161 W Stone Mount Way #587, South Jordan, UT 84009
MLS# 2128362Listed by: ADVANTAGE REAL ESTATE, LLC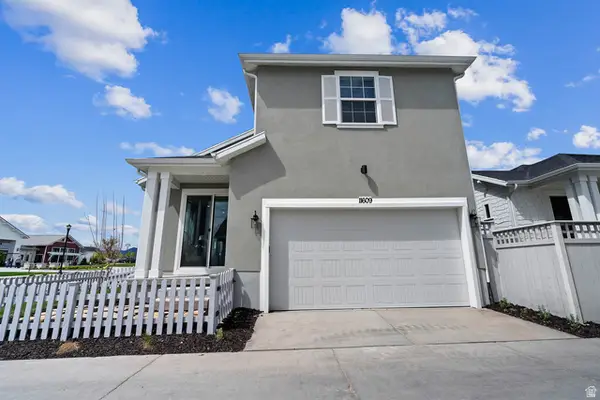 $556,190Pending3 beds 3 baths1,890 sq. ft.
6171 W Stone Mount Way #588, South Jordan, UT 84009
MLS# 2128366Listed by: ADVANTAGE REAL ESTATE, LLC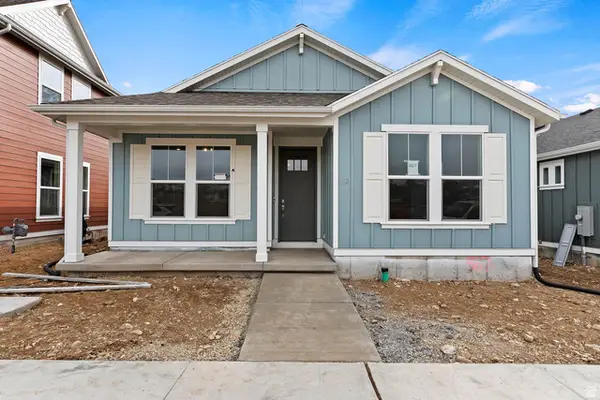 $454,920Pending2 beds 2 baths1,371 sq. ft.
6153 W Franciscotti Dr #525, South Jordan, UT 84009
MLS# 2128349Listed by: ADVANTAGE REAL ESTATE, LLC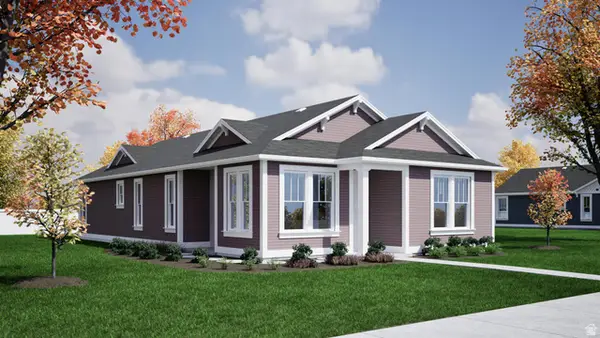 $470,390Pending2 beds 2 baths1,424 sq. ft.
6142 W Franciscotti Dr #609, South Jordan, UT 84009
MLS# 2128275Listed by: ADVANTAGE REAL ESTATE, LLC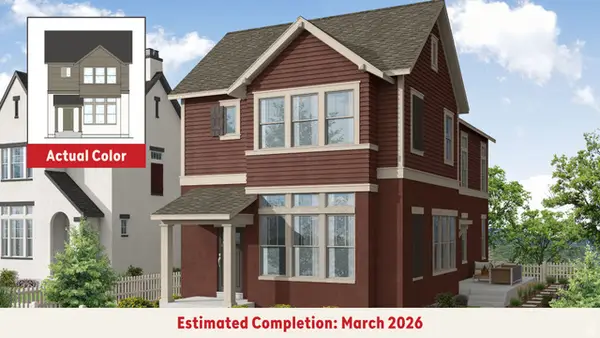 $605,990Pending3 beds 2 baths2,588 sq. ft.
7033 W Lake Ave, South Jordan, UT 84009
MLS# 2128304Listed by: DESTINATION REAL ESTATE $537,940Pending3 beds 3 baths1,889 sq. ft.
6127 W Franciscotti Dr #499, South Jordan, UT 84009
MLS# 2128161Listed by: ADVANTAGE REAL ESTATE, LLC $554,325Pending3 beds 3 baths1,889 sq. ft.
6089 W Franciscotti Dr #470, South Jordan, UT 84009
MLS# 2128163Listed by: ADVANTAGE REAL ESTATE, LLC $673,266Pending3 beds 3 baths3,372 sq. ft.
6157 W Stone Mount Way #586, South Jordan, UT 84009
MLS# 2128146Listed by: ADVANTAGE REAL ESTATE, LLC $685,390Pending2 beds 3 baths3,372 sq. ft.
6132 W 11800 S #501, South Jordan, UT 84009
MLS# 2128147Listed by: ADVANTAGE REAL ESTATE, LLC $662,365Pending3 beds 3 baths3,372 sq. ft.
6129 W Franciscotti Dr #498, South Jordan, UT 84009
MLS# 2128156Listed by: ADVANTAGE REAL ESTATE, LLC $486,840Pending2 beds 2 baths1,321 sq. ft.
6123 W Franciscotti Dr #500, South Jordan, UT 84009
MLS# 2128158Listed by: ADVANTAGE REAL ESTATE, LLC $472,505Pending2 beds 2 baths1,321 sq. ft.
11726 S Gannet Way #611, South Jordan, UT 84009
MLS# 2128159Listed by: ADVANTAGE REAL ESTATE, LLC $478,475Pending2 beds 2 baths1,321 sq. ft.
6156 W Franciscotti Dr #607, South Jordan, UT 84009
MLS# 2128006Listed by: ADVANTAGE REAL ESTATE, LLC $470,505Pending2 beds 2 baths1,321 sq. ft.
6164 W 11800 S #505, South Jordan, UT 84009
MLS# 2128011Listed by: ADVANTAGE REAL ESTATE, LLC $707,955Pending3 beds 3 baths3,546 sq. ft.
6187 W Franciscotti Dr #520, South Jordan, UT 84009
MLS# 2128003Listed by: ADVANTAGE REAL ESTATE, LLC $684,320Pending3 beds 3 baths3,372 sq. ft.
6127 Stone Mount Way #582, South Jordan, UT 84009
MLS# 2128004Listed by: ADVANTAGE REAL ESTATE, LLC $465,645Pending2 beds 2 baths1,371 sq. ft.
11734 S Gannet Way #612, South Jordan, UT 84009
MLS# 2127912Listed by: ADVANTAGE REAL ESTATE, LLC $449,990Pending2 beds 2 baths1,234 sq. ft.
6109 W Franciscotti Dr #497, South Jordan, UT 84009
MLS# 2127917Listed by: ADVANTAGE REAL ESTATE, LLC $559,740Pending3 beds 3 baths1,890 sq. ft.
11722 S Gannet Way #610, South Jordan, UT 84009
MLS# 2127928Listed by: ADVANTAGE REAL ESTATE, LLC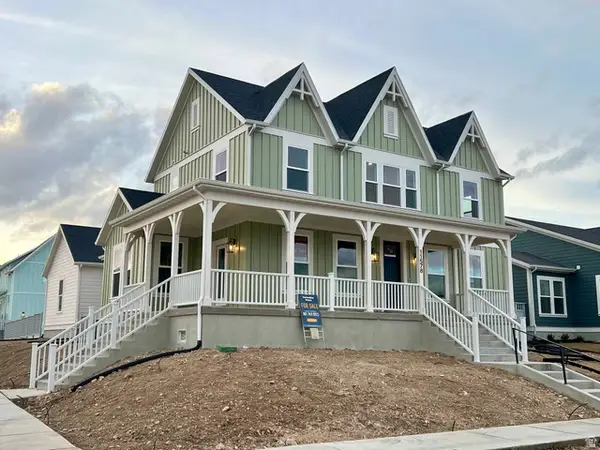 $1,198,990Pending6 beds 4 baths5,192 sq. ft.
11578 S Flying Fish Dr #1-120, South Jordan, UT 84009
MLS# 2127751Listed by: DESTINATION REAL ESTATE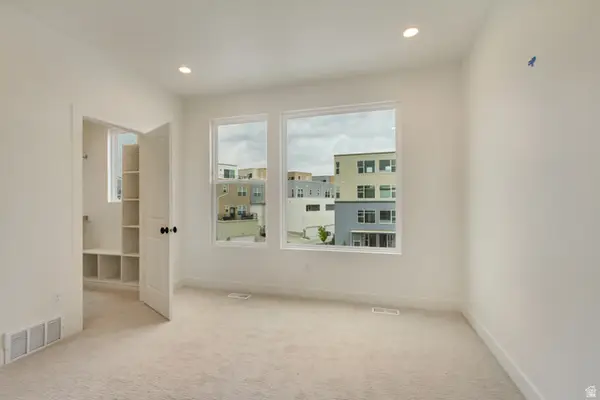 $471,110Active4 beds 3 baths1,698 sq. ft.
10995 S Freestone Rd W #109, South Jordan, UT 84009
MLS# 2127151Listed by: S H REALTY LC $511,850Pending3 beds 3 baths1,707 sq. ft.
10991 S Freestone Rd W #107, South Jordan, UT 84009
MLS# 2127156Listed by: S H REALTY LC $465,145Active4 beds 3 baths1,698 sq. ft.
11017 S Freestone Rd W #119, South Jordan, UT 84009
MLS# 2127158Listed by: S H REALTY LC $387,290Pending2 beds 2 baths1,463 sq. ft.
11011 S Freestone Rd W #116, South Jordan, UT 84009
MLS# 2127127Listed by: S H REALTY LC $388,855Pending2 beds 2 baths1,463 sq. ft.
11013 S Freestone Rd W #117, South Jordan, UT 84009
MLS# 2127137Listed by: S H REALTY LC $1,739,990Pending5 beds 6 baths5,019 sq. ft.
11048 S Paddle Board Way #3-332, South Jordan, UT 84009
MLS# 2126849Listed by: DESTINATION REAL ESTATE $899,875Active4 beds 4 baths3,574 sq. ft.
6803 W South Jordan Pkwy S #252, South Jordan, UT 84009
MLS# 2126711Listed by: S H REALTY LC $1,181,990Pending6 beds 6 baths5,026 sq. ft.
11292 S Restless Rd W #1-129, South Jordan, UT 84009
MLS# 2126601Listed by: DESTINATION REAL ESTATE $534,990Active3 beds 3 baths1,932 sq. ft.
11349 S Lake Run Rd W #101, South Jordan, UT 84009
MLS# 2126526Listed by: WEEKLEY HOMES, LLC $1,499,990Pending5 beds 5 baths4,667 sq. ft.
11037 S Lake Island Dr #3-378, South Jordan, UT 84009
MLS# 2126506Listed by: DESTINATION REAL ESTATE $663,555Active4 beds 4 baths2,720 sq. ft.
10982 S Lake Run Rd #157, South Jordan, UT 84009
MLS# 2125637Listed by: S H REALTY LC $626,205Active3 beds 3 baths2,596 sq. ft.
10976 S Lake Run Rd W #159, South Jordan, UT 84009
MLS# 2125627Listed by: S H REALTY LC $449,990Pending2 beds 2 baths1,321 sq. ft.
6173 W Sparrow View Dr #559, South Jordan, UT 84009
MLS# 2124859Listed by: ADVANTAGE REAL ESTATE, LLC $1,202,686Pending5 beds 6 baths5,026 sq. ft.
11111 S Bingham Rim Rd #5-424, South Jordan, UT 84009
MLS# 2124925Listed by: DESTINATION REAL ESTATE $499,990Pending3 beds 3 baths1,852 sq. ft.
11307 S Lake Run Rd W #117, South Jordan, UT 84009
MLS# 2124862Listed by: WEEKLEY HOMES, LLC $534,990Pending3 beds 3 baths1,889 sq. ft.
6169 W Sparrow View Dr #558, South Jordan, UT 84009
MLS# 2123908Listed by: ADVANTAGE REAL ESTATE, LLC $675,000Pending5 beds 4 baths3,019 sq. ft.
6798 W Docksider Dr #304, South Jordan, UT 84009
MLS# 2122569Listed by: AIM REALTY $1,029,990Pending5 beds 4 baths5,106 sq. ft.
11568 S Flying Fish Dr #1-119, South Jordan, UT 84009
MLS# 2122401Listed by: DESTINATION REAL ESTATE $791,900Pending3 beds 3 baths2,524 sq. ft.
9553 S Ember Glow Ct #D, South Jordan, UT 84095
MLS# 2122325Listed by: VALLEY VU REALTY $569,990Pending2 beds 2 baths1,736 sq. ft.
6148 W Franciscotti Dr #608, South Jordan, UT 84009
MLS# 2122345Listed by: ADVANTAGE REAL ESTATE, LLC $1,400,000Pending5 beds 4 baths5,644 sq. ft.
2834 W Proudest Ln #247, South Jordan, UT 84095
MLS# 2121569Listed by: KW SOUTH VALLEY KELLER WILLIAMS $822,643Pending4 beds 4 baths3,062 sq. ft.
11592 S Prosperity Rd #133, South Jordan, UT 84009
MLS# 2120800Listed by: HOLMES HOMES REALTY $1,400,000Pending5 beds 4 baths5,110 sq. ft.
10868 S Reta View Ct #232, South Jordan, UT 84095
MLS# 2120341Listed by: KW SOUTH VALLEY KELLER WILLIAMS $579,990Pending3 beds 3 baths3,546 sq. ft.
11727 S Willow Walk Dr #597, South Jordan, UT 84009
MLS# 2119998Listed by: ADVANTAGE REAL ESTATE, LLC $529,990Pending3 beds 3 baths1,852 sq. ft.
5072 W Rambutan Way S #123, South Jordan, UT 84009
MLS# 2119639Listed by: WEEKLEY HOMES, LLC $459,990Pending2 beds 2 baths1,321 sq. ft.
11654 Gannett Way S #555, South Jordan, UT 84009
MLS# 2118914Listed by: ADVANTAGE REAL ESTATE, LLC $454,990Pending2 beds 2 baths1,321 sq. ft.
6198 W Franciscotti Dr #600, South Jordan, UT 84009
MLS# 2117369Listed by: ADVANTAGE REAL ESTATE, LLC $755,050Active4 beds 4 baths2,904 sq. ft.
11373 S Watercourse Rd W #203, South Jordan, UT 84009
MLS# 2116713Listed by: S H REALTY LC $1,199,990Pending5 beds 4 baths3,680 sq. ft.
10991 S Lake Island Dr #311, South Jordan, UT 84009
MLS# 2116228Listed by: DESTINATION REAL ESTATE $685,000Pending5 beds 4 baths2,949 sq. ft.
6808 W Docksider Dr #307, South Jordan, UT 84009
MLS# 2116329Listed by: AIM REALTY $602,990Pending4 beds 4 baths2,680 sq. ft.
6788 W South Jordan Pkwy S #484, South Jordan, UT 84009
MLS# 2115396Listed by: DESTINATION REAL ESTATE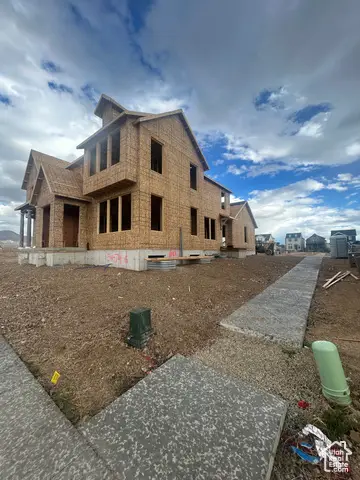 $570,990Pending3 beds 3 baths2,851 sq. ft.
6798 W South Jordan Pkwy S #474, South Jordan, UT 84009
MLS# 2115410Listed by: DESTINATION REAL ESTATE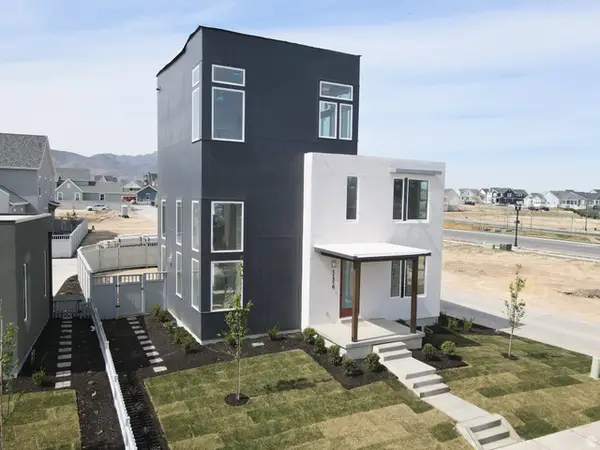 $879,255Active3 beds 3 baths3,729 sq. ft.
11318 S Silver Pond Dr W #319, South Jordan, UT 84009
MLS# 2140921Listed by: S H REALTY LC $604,798Pending3 beds 3 baths2,842 sq. ft.
11757 S Rini Rd W #6905, South Jordan, UT 84009
MLS# 2114958Listed by: HOLMES HOMES REALTY $594,454Pending3 beds 3 baths2,645 sq. ft.
11668 S Outfitter Way, South Jordan, UT 84009
MLS# 2114936Listed by: HOLMES HOMES REALTY $894,300Pending3 beds 3 baths3,510 sq. ft.
6726 W Docksider Dr S #367, South Jordan, UT 84009
MLS# 2114391Listed by: S H REALTY LC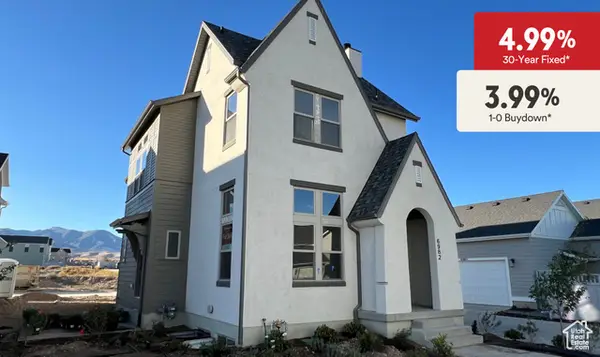 $645,990Pending4 beds 3 baths2,471 sq. ft.
6982 W Lake Ave, South Jordan, UT 84009
MLS# 2114248Listed by: DESTINATION REAL ESTATE $483,900Active3 beds 2 baths1,423 sq. ft.
5263 W Reventon Rd S #404, South Jordan, UT 84009
MLS# 2134375Listed by: HOLMES HOMES REALTY $958,010Pending3 beds 3 baths3,729 sq. ft.
11372 S Aqua St W #228, South Jordan, UT 84009
MLS# 2113006Listed by: S H REALTY LC $483,900Pending3 beds 2 baths1,417 sq. ft.
5263 W Reventon Rd S #401, South Jordan, UT 84009
MLS# 2112920Listed by: HOLMES HOMES REALTY $644,900Pending5 beds 3 baths3,288 sq. ft.
1727 W Brocious Way #302, South Jordan, UT 84095
MLS# 2112210Listed by: UTAH REAL ESTATE PC $474,990Pending3 beds 4 baths1,822 sq. ft.
11277 S Lake Run Rd W #127, South Jordan, UT 84009
MLS# 2111323Listed by: WEEKLEY HOMES, LLC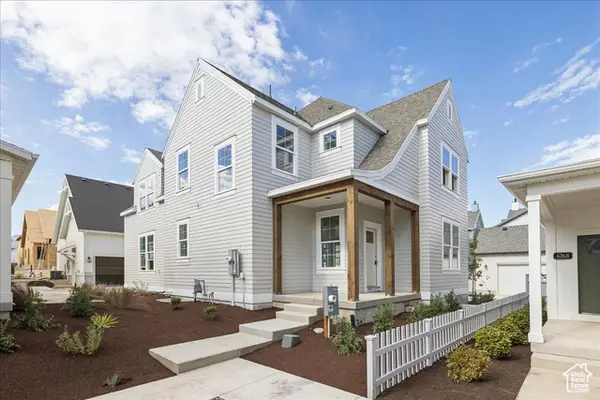 $664,900Pending5 beds 4 baths3,019 sq. ft.
6774 W Docksider Dr #301, South Jordan, UT 84009
MLS# 2110935Listed by: AIM REALTY $599,990Pending2 beds 2 baths2,633 sq. ft.
6189 W Stone Mount Way #591, South Jordan, UT 84009
MLS# 2110386Listed by: ADVANTAGE REAL ESTATE, LLC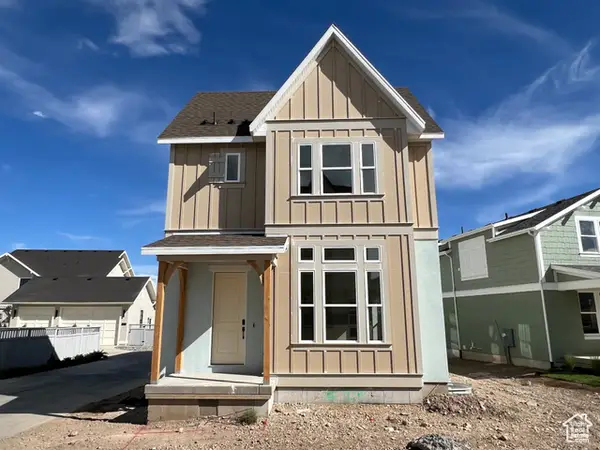 $599,990Pending3 beds 2 baths2,588 sq. ft.
6976 W Lake Ave, South Jordan, UT 84009
MLS# 2108338Listed by: DESTINATION REAL ESTATE $520,091Pending4 beds 3 baths1,852 sq. ft.
5074 W Rambutan Way S #124, South Jordan, UT 84009
MLS# 2108155Listed by: WEEKLEY HOMES, LLC $529,990Pending3 beds 3 baths1,889 sq. ft.
6196 W Franciscotti Dr #601, South Jordan, UT 84009
MLS# 2107470Listed by: ADVANTAGE REAL ESTATE, LLC $574,990Pending2 beds 2 baths3,151 sq. ft.
6177 W Stone Mount Way #589, South Jordan, UT 84009
MLS# 2107322Listed by: ADVANTAGE REAL ESTATE, LLC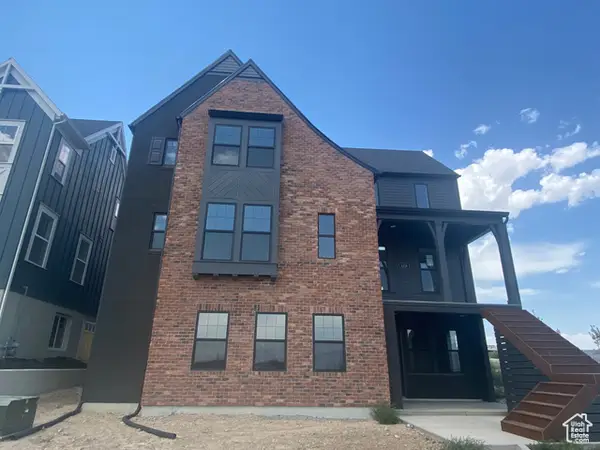 $1,155,437Pending6 beds 6 baths4,948 sq. ft.
11228 S Watercourse Rd W, South Jordan, UT 84009
MLS# 2106398Listed by: HOLMES HOMES REALTY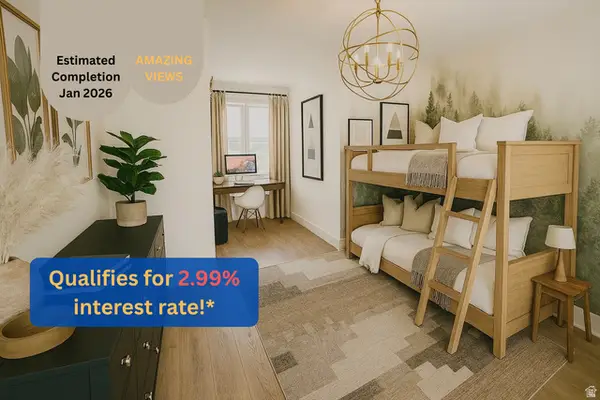 $474,990Pending3 beds 4 baths1,822 sq. ft.
11267 S Lake Run Rd W #130, South Jordan, UT 84009
MLS# 2105601Listed by: WEEKLEY HOMES, LLC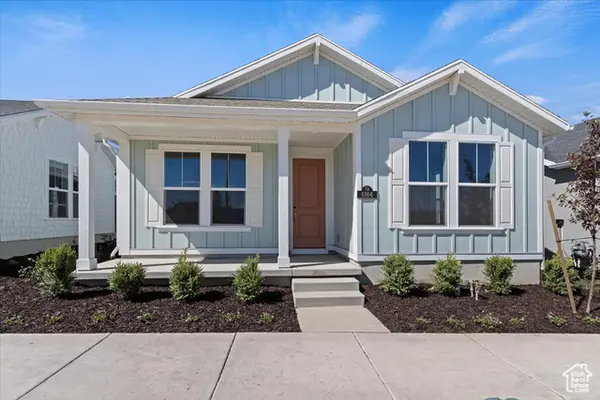 $509,990Pending3 beds 3 baths1,890 sq. ft.
6184 W Franciscotti Dr #603, South Jordan, UT 84009
MLS# 2105242Listed by: ADVANTAGE REAL ESTATE, LLC $589,990Pending2 beds 2 baths2,642 sq. ft.
6176 W Franciscotti Dr #604, South Jordan, UT 84009
MLS# 2105213Listed by: ADVANTAGE REAL ESTATE, LLC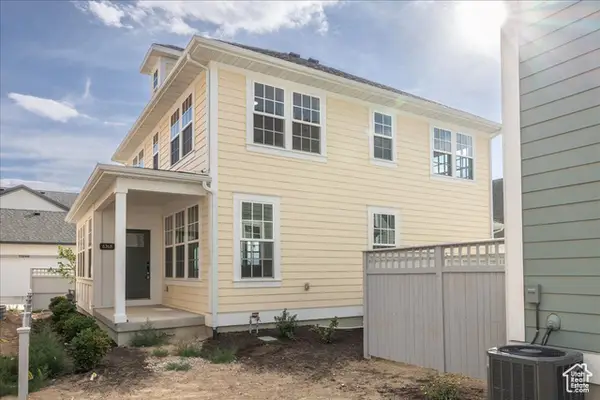 $629,900Pending5 beds 4 baths2,832 sq. ft.
6768 W Docksider Dr #298, South Jordan, UT 84009
MLS# 2104402Listed by: AIM REALTY $859,900Pending3 beds 2 baths4,757 sq. ft.
10804 S Haven Landing Dr, South Jordan, UT 84095
MLS# 2104287Listed by: PETERSON HOMES $689,900Pending5 beds 4 baths2,974 sq. ft.
6778 W Docksider Dr #300, South Jordan, UT 84009
MLS# 2102637Listed by: AIM REALTY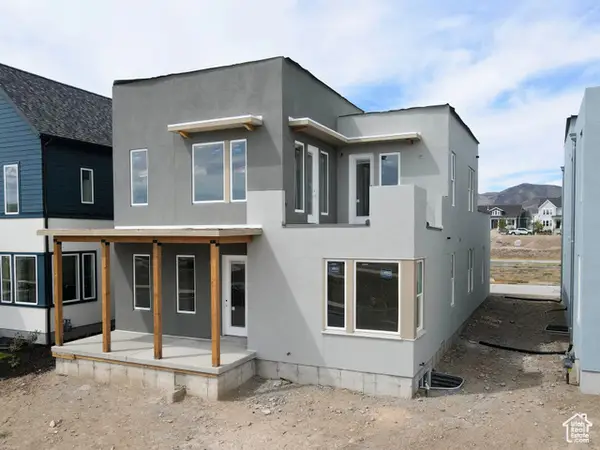 $799,900Pending5 beds 4 baths3,382 sq. ft.
11378 S Aqua St W #229, South Jordan, UT 84009
MLS# 2120519Listed by: S H REALTY LC $559,990Pending3 beds 3 baths2,841 sq. ft.
11377 S Offshore Way #378, South Jordan, UT 84009
MLS# 2098109Listed by: DESTINATION REAL ESTATE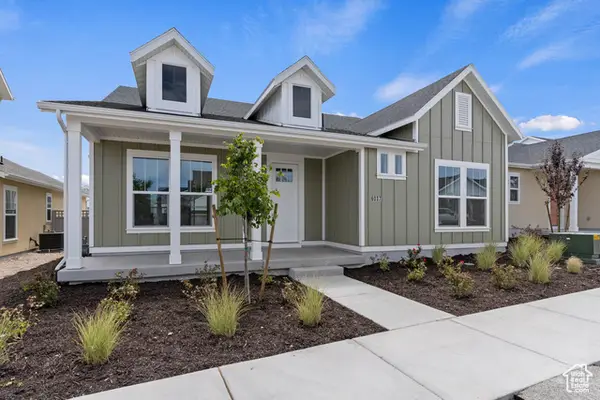 $639,990Pending2 beds 2 baths2,633 sq. ft.
6143 W Stone Mountain Way #584, South Jordan, UT 84009
MLS# 2097561Listed by: ADVANTAGE REAL ESTATE, LLC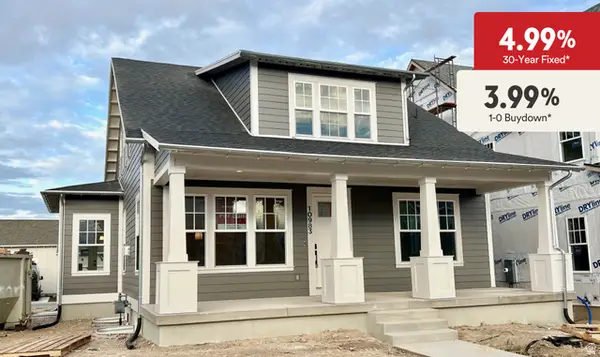 $999,990Pending4 beds 3 baths3,624 sq. ft.
10983 S Lake Island Dr #312, South Jordan, UT 84009
MLS# 2097291Listed by: DESTINATION REAL ESTATE $574,990Pending3 beds 3 baths2,688 sq. ft.
11361 S Offshore Way #380, South Jordan, UT 84009
MLS# 2097233Listed by: DESTINATION REAL ESTATE $584,990Active3 beds 4 baths2,197 sq. ft.
5063 W Rambutan Way S #121, South Jordan, UT 84009
MLS# 2119841Listed by: WEEKLEY HOMES, LLC $439,990Pending2 beds 2 baths1,371 sq. ft.
6168 W Franciscotti Dr #605, South Jordan, UT 84009
MLS# 2093397Listed by: ADVANTAGE REAL ESTATE, LLC $559,900Pending4 beds 3 baths2,620 sq. ft.
1719 W Brocious Way #301, South Jordan, UT 84095
MLS# 2112180Listed by: UTAH REAL ESTATE PC $799,990Pending4 beds 3 baths3,859 sq. ft.
6718 W Salt Marsh Rd S #5-433, South Jordan, UT 84009
MLS# 2090010Listed by: DESTINATION REAL ESTATE $599,990Pending3 beds 3 baths3,151 sq. ft.
6133 W Stone Mount Way #583, South Jordan, UT 84009
MLS# 2089945Listed by: ADVANTAGE REAL ESTATE, LLC $753,945Pending6 beds 4 baths3,306 sq. ft.
11357 S Watercourse Rd #196, South Jordan, UT 84009
MLS# 2088247Listed by: HOLMES HOMES REALTY $816,083Pending3 beds 3 baths3,062 sq. ft.
6743 W Docksider Dr #101, South Jordan, UT 84009
MLS# 2088201Listed by: HOLMES HOMES REALTY $744,996Pending4 beds 3 baths3,306 sq. ft.
11228 S Silver Pond Dr #442, South Jordan, UT 84009
MLS# 2088223Listed by: HOLMES HOMES REALTY $715,900Pending4 beds 4 baths2,572 sq. ft.
9566 S Ember Glow Ct #C, South Jordan, UT 84095
MLS# 2086901Listed by: VALLEY VU REALTY $599,990Pending3 beds 2 baths2,471 sq. ft.
11578 S Nimitz Dr, South Jordan, UT 84009
MLS# 2085566Listed by: DESTINATION REAL ESTATE $1,500,000Pending5 beds 5 baths4,703 sq. ft.
10999 S Lake Dr, South Jordan, UT 84009
MLS# 2083981Listed by: DESTINATION REAL ESTATE $941,489Pending3 beds 4 baths3,574 sq. ft.
6807 W South Jordan Pkwy S #251, South Jordan, UT 84009
MLS# 2080094Listed by: S H REALTY LC $399,900Pending3 beds 2 baths1,329 sq. ft.
5263 W Reventon Rd S #2A-101, South Jordan, UT 84009
MLS# 2072136Listed by: HOLMES HOMES REALTY $833,695Pending4 beds 4 baths3,348 sq. ft.
11381 S Watercourse Rd W #205, South Jordan, UT 84009
MLS# 2108524Listed by: S H REALTY LC $708,890Pending5 beds 4 baths3,633 sq. ft.
7042 W Granbury Dr #218, South Jordan, UT 84009
MLS# 2069851Listed by: HOLMES HOMES REALTY $407,400Pending3 beds 2 baths1,329 sq. ft.
5222 W Black Twig Rd S #2A-302, South Jordan, UT 84009
MLS# 2059716Listed by: HOLMES HOMES REALTY $406,900Pending3 beds 2 baths1,329 sq. ft.
5222 W Black Twig Rd S #2A-303, South Jordan, UT 84009
MLS# 2059717Listed by: HOLMES HOMES REALTY $705,410Pending3 beds 3 baths3,633 sq. ft.
11351 S Watercourse Rd #197, South Jordan, UT 84009
MLS# 2069235Listed by: HOLMES HOMES REALTY $1,358,656Pending4 beds 4 baths5,484 sq. ft.
10238 S 3667 W, South Jordan, UT 84095
MLS# 2032235Listed by: BERKSHIRE HATHAWAY HOMESERVICES ELITE REAL ESTATE
Local realty services provided by:CENTURY 21 Lifestyle Real Estate
Neighborhoods near South Jordan, UT
Zip codes near South Jordan, UT
- 84006 homes for sale
- 84009 homes for sale
- 84020 homes for sale
- 84047 homes for sale
- 84065 homes for sale
- 84070 homes for sale
- 84081 homes for sale
- 84084 homes for sale
- 84088 homes for sale
- 84093 homes for sale
- 84094 homes for sale
- 84095 homes for sale
- 84096 homes for sale
- 84107 homes for sale
- 84118 homes for sale
- 84119 homes for sale
- 84120 homes for sale
- 84123 homes for sale
- 84128 homes for sale
- 84129 homes for sale
Popular searches near South Jordan, UT
- Bingham homes for sale
- Bingham Canyon homes for sale
- Bluffdale homes for sale
- Copperton homes for sale
- Cottonwood Heights homes for sale
- Draper homes for sale
- Granite homes for sale
- Herriman homes for sale
- Holladay homes for sale
- Kearns homes for sale
- Lehi homes for sale
- Midvale homes for sale
- Millcreek homes for sale
- Murray homes for sale
- Riverton homes for sale
- Sandy homes for sale
- Taylorsville homes for sale
- West Jordan homes for sale
- West Valley City homes for sale
- White City homes for sale
Protect your home and budget from life's surprises with an Assurant Home Warranty, backed by a partner that supports you through every step of homeownership. Explore Plans.
©2026 Century 21 Real Estate LLC. All rights reserved. CENTURY 21®, the CENTURY 21 Logo and C21® are service marks owned by Century 21 Real Estate LLC. Century 21 Real Estate LLC fully supports the principles of the Fair Housing Act and the Equal Opportunity Act. Each office is independently owned and operated. Listing information is deemed reliable but not guaranteed accurate.