- Clarkdale, Culver City homes for sale
- Culver - West, Los Angeles homes for sale
- Del Mar, Los Angeles homes for sale
- Del Rey, Culver City homes for sale
- East of Lincoln, Venice homes for sale
- Mar Vista, Los Angeles homes for sale
- McLaughlin, Los Angeles homes for sale
- Milwood Trapezoid, Venice homes for sale
- Oxford Triangle, Marina Del Rey homes for sale
- Palms, Los Angeles homes for sale
- Park East, Culver City homes for sale
- Park West, Culver City homes for sale
- Playa Vista, Playa Vista homes for sale
- President's Row, Venice homes for sale
- Rancho Park, Los Angeles homes for sale
- Sunkist Park, Culver City homes for sale
- Sunset Park, Santa Monica homes for sale
- Villa Marina, Marina Del Rey homes for sale
- Westdale, Los Angeles homes for sale
- Westside Village, Los Angeles homes for sale
South Mar Vista, Los Angeles, CA - homes for sale
8 of 8 results displayed
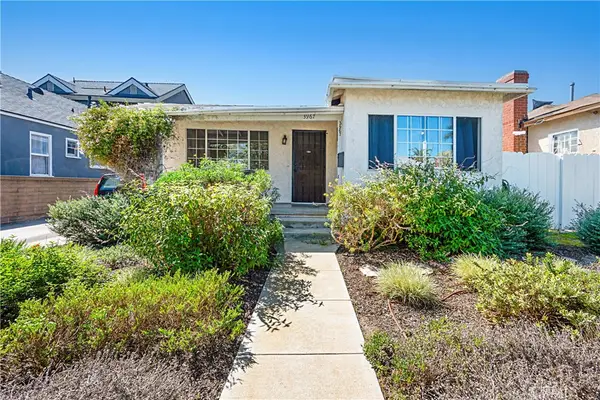 $1,100,000Active2 beds 1 baths779 sq. ft.
3967 Berryman Avenue, Los Angeles, CA 90066
MLS# SB26050938Listed by: COLDWELL BANKER RESIDENTIAL BR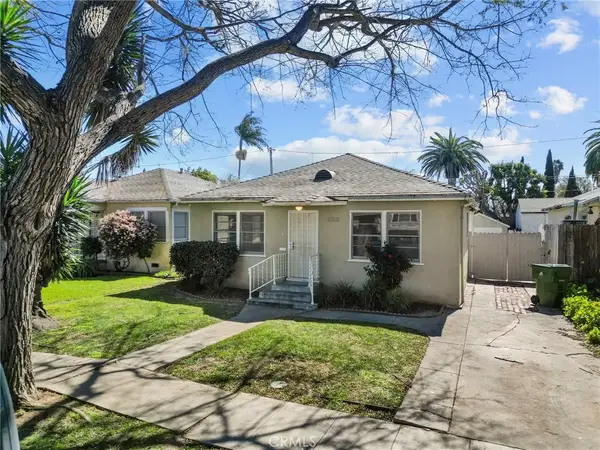 $1,299,000Active3 beds 2 baths1,456 sq. ft.
12132 Herbert, Los Angeles, CA 90066
MLS# OC26049961Listed by: FIRST TEAM REAL ESTATE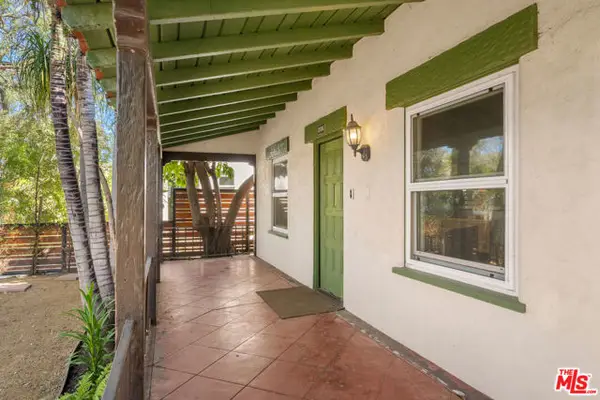 $1,525,000Pending2 beds 2 baths1,115 sq. ft.
12106 Herbert Street, Los Angeles, CA 90066
MLS# CL26659645Listed by: COMPASS $3,345,000Active5 beds 6 baths4,168 sq. ft.
4232 East Boulevard, Los Angeles, CA 90066
MLS# CL26642655Listed by: THOMAS JAMES REAL ESTATE SERVICES, INC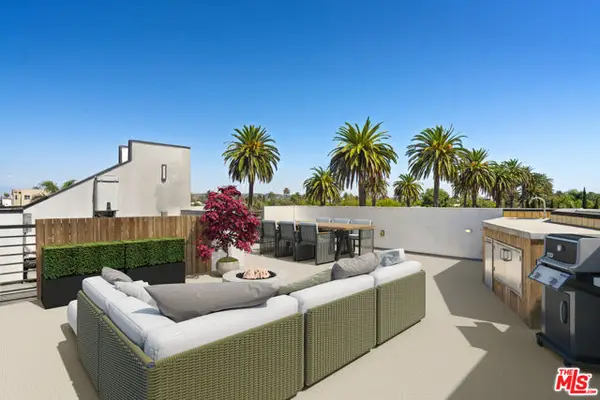 $1,649,000Active3 beds 4 baths2,143 sq. ft.
11900 Washington Place, Los Angeles, CA 90066
MLS# CL26638543Listed by: DOUGLAS ELLIMAN OF CALIFORNIA, INC. $3,380,000Active6 beds 7 baths3,188 sq. ft.
3932 S Minerva Avenue, Los Angeles, CA 90066
MLS# WS25264856Listed by: CAL BEST REALTY $3,995,000Active4 beds 5 baths3,522 sq. ft.
3985 Mclaughlin Avenue, Los Angeles, CA 90066
MLS# CL26651445Listed by: BERKSHIRE HATHAWAY HOMESERVICES CALIFORNIA PROPERTIES $2,495,000Active2 beds 2 baths1,588 sq. ft.
3875 Marcasel Avenue, Los Angeles, CA 90066
MLS# 21796130Listed by: COMPASS
Local realty services provided by:CENTURY 21 Adams & Barnes, CENTURY 21 Affiliated, CENTURY 21 Wildwood Properties, Inc.
The information being provided by California Regional MLS (Southern California) is for the consumer's personal, non-commercial use and may not be used for any purpose other than to identify prospective properties consumer may be interested in purchasing. Any information relating to real estate for sale referenced on this web site comes from the Internet Data Exchange (IDX) program of the California Regional MLS (Southern California). CENTURY 21 Adams & Barnes is not a Multiple Listing Service (MLS), nor does it offer MLS access. This website is a service of CENTURY 21 Adams & Barnes, a broker participant of California Regional MLS (Southern California). This web site may reference real estate listing(s) held by a brokerage firm other than the broker and/or agent who owns this web site.
The accuracy of all information, regardless of source, including but not limited to open house information, square footages and lot sizes, is deemed reliable but not guaranteed and should be personally verified through personal inspection by and/or with the appropriate professionals. The data contained herein is copyrighted by California Regional MLS (Southern California) and is protected by all applicable copyright laws. Any unauthorized dissemination of this information is in violation of copyright laws and is strictly prohibited.
Copyright 2021 California Regional MLS (Southern California). All rights reserved.
This information is deemed reliable but not guaranteed. You should rely on this information only to decide whether or not to further investigate a particular property. BEFORE MAKING ANY OTHER DECISION, YOU SHOULD PERSONALLY INVESTIGATE THE FACTS (e.g. square footage and lot size) with the assistance of an appropriate professional. You may use this information only to identify properties you may be interested in investigating further. All uses except for personal, non-commercial use in accordance with the foregoing purpose are prohibited. Redistribution or copying of this information, any photographs or video tours is strictly prohibited. This information is derived from the Internet Data Exchange (IDX) service provided by San Diego MLS®. Displayed property listings may be held by a brokerage firm other than the broker and/or agent responsible for this display. The information and any photographs and video tours and the compilation from which they are derived is protected by copyright. Compilation © 2020 San Diego MLS®, Inc.
Popular neighborhoods near South Mar Vista, Los Angeles, CA
Zip codes near South Mar Vista, Los Angeles, CA
- 90024 homes for sale
- 90025 homes for sale
- 90034 homes for sale
- 90035 homes for sale
- 90045 homes for sale
- 90056 homes for sale
- 90064 homes for sale
- 90066 homes for sale
- 90067 homes for sale
- 90094 homes for sale
- 90212 homes for sale
- 90230 homes for sale
- 90232 homes for sale
- 90291 homes for sale
- 90292 homes for sale
- 90293 homes for sale
- 90401 homes for sale
- 90403 homes for sale
- 90404 homes for sale
- 90405 homes for sale
Counties near South Mar Vista, Los Angeles, CA
Protect your home and budget from life's surprises with an Assurant Home Warranty, backed by a partner that supports you through every step of homeownership. Explore Plans.
©2026 Century 21 Real Estate LLC. All rights reserved. CENTURY 21®, the CENTURY 21 Logo and C21® are service marks owned by Century 21 Real Estate LLC. Century 21 Real Estate LLC fully supports the principles of the Fair Housing Act and the Equal Opportunity Act. Each office is independently owned and operated. Listing information is deemed reliable but not guaranteed accurate.