- Central Torrance, Torrance homes for sale
- Hermosa Beach East, Hermosa Beach homes for sale
- Hermosa Beach Sand, Hermosa Beach homes for sale
- Hermosa Beach Valley, Hermosa Beach homes for sale
- Hollywood Riviera, Redondo Beach homes for sale
- Malaga Cove, Palos Verdes Peninsula homes for sale
- Manhattan Beach Mira Costa, Manhattan Beach homes for sale
- Monte Malaga, Palos Verdes Peninsula homes for sale
- North Redondo Beach, Redondo Beach homes for sale
- Silver Spur, Rancho Palos Verdes homes for sale
- South Bay, Torrance homes for sale
- South East Torrance - West, Torrance homes for sale
- South Redondo Beach North of Torrance Blvd., Redondo Beach homes for sale
- South Redondo Beach South of Torrance Blvd., Redondo Beach homes for sale
- South Redondo Beach West of Pacific Coast Highway, Redondo Beach homes for sale
- South Torrance, Torrance homes for sale
- Southwood, Torrance homes for sale
- Valmonte, Palos Verdes Peninsula homes for sale
- Walteria, Torrance homes for sale
- West Torrance, Torrance homes for sale
South Redondo Beach, Redondo Beach, CA - homes for sale
29 of 29 results displayed
- New
 $1,249,000Active3 beds 3 baths1,449 sq. ft.
408 Avenue G #30, Redondo Beach, CA 90227
MLS# CRSB26046953Listed by: BEACH CITY BROKERS - New
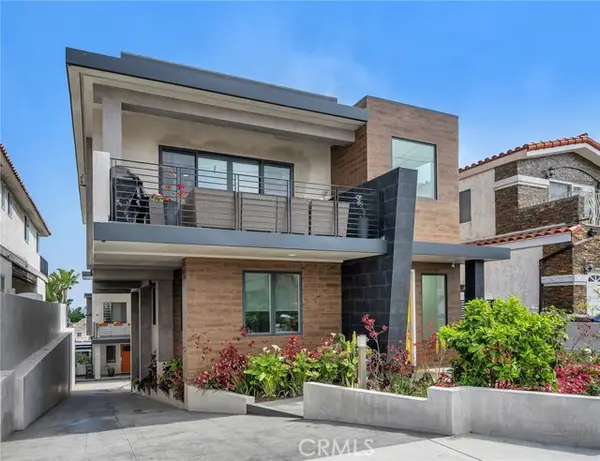 $2,195,000Active4 beds 4 baths2,674 sq. ft.
130 S Prospect #A, Redondo Beach, CA 90277
MLS# CRSB26065323Listed by: COMPASS - New
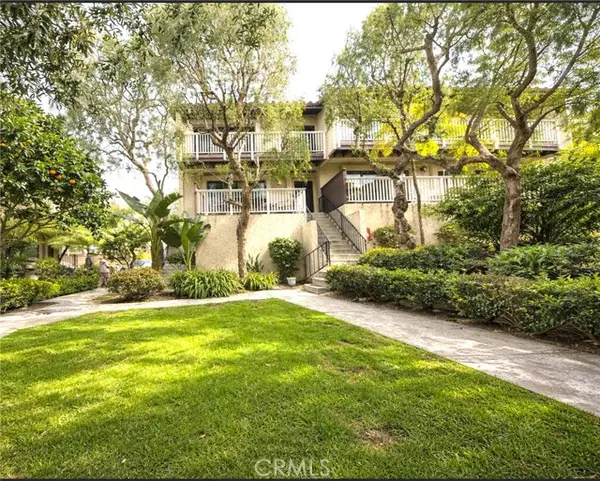
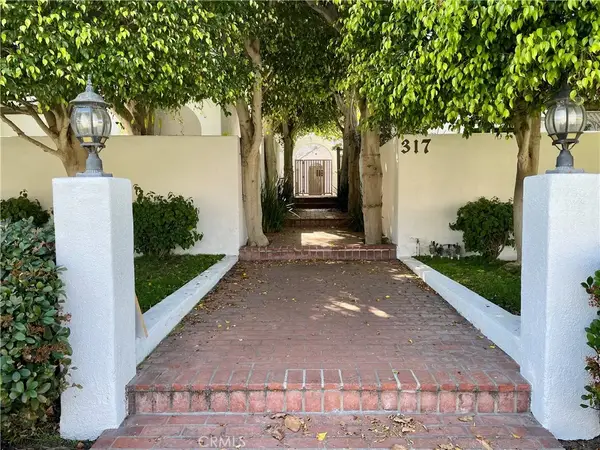 $1,649,000Active3 beds 3 baths1,519 sq. ft.
317 S Broadway #C, Redondo Beach, CA 90277
MLS# SB26064829Listed by: ESTATE PROPERTIES - New
 $1,499,000Active4 beds 3 baths2,324 sq. ft.
117 S Prospect Ave #a, Redondo Beach, CA 90277
MLS# SB26046161Listed by: MORNING STAR PROPERTIES - New
 $2,199,000Active4 beds 3 baths2,754 sq. ft.
121 S Helberta Avenue #A, Redondo Beach, CA 90277
MLS# CRSB26058255Listed by: COMPASS - New
 $2,495,000Active4 beds 4 baths2,800 sq. ft.
617 N Irena Avenue #A, Redondo Beach, CA 90277
MLS# CRSB26058284Listed by: BEACH CITY BROKERS 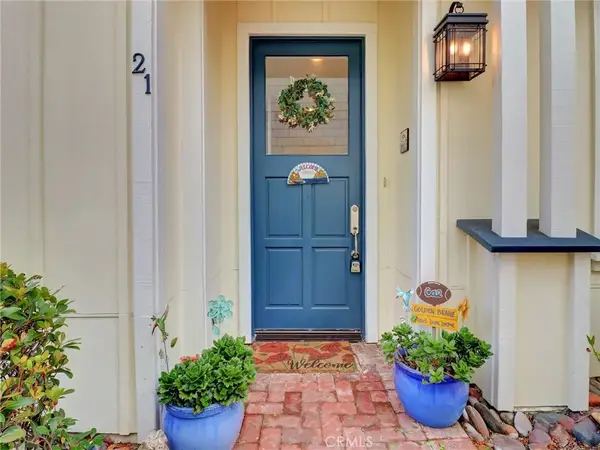 $1,279,000Active3 beds 3 baths1,672 sq. ft.
1800 S Pacific Coast #21, Redondo Beach, CA 90277
MLS# SB26059008Listed by: WEST SHORES REALTY, INC. $1,450,000Active2 beds 3 baths1,400 sq. ft.
1301 S Catalina #L, Redondo Beach, CA 90277
MLS# SB26032303Listed by: VISTA SOTHEBYS INTERNATIONAL REALTY $2,159,000Active4 beds 4 baths2,480 sq. ft.
227 S Helberta Avenue #B, Redondo Beach, CA 90277
MLS# PV25266489Listed by: PROPERTYCHAT REALTY, INC. $1,579,000Active4 beds 3 baths2,640 sq. ft.
222 S Guadalupe Avenue #1, Redondo Beach, CA 90277
MLS# PV26043920Listed by: MERIT REAL ESTATE $1,450,000Active3 beds 3 baths2,361 sq. ft.
619 N Guadalupe #4, Redondo Beach, CA 90277
MLS# SB26043936Listed by: DOUGLAS ELLIMAN OF CALIFORNIA, INC. $1,849,000Active3 beds 3 baths1,881 sq. ft.
611 N Lucia #B, Redondo Beach, CA 90277
MLS# SB26029249Listed by: VISTA SOTHEBYS INTERNATIONAL REALTY $1,299,000Pending2 beds 3 baths1,497 sq. ft.
231 N Broadway #3, Redondo Beach, CA 90277
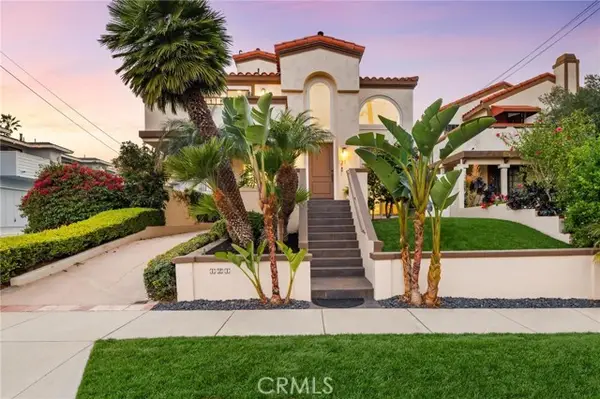
MLS# SB26032586Listed by: ESTATE PROPERTIES $1,795,000Pending3 beds 3 baths2,242 sq. ft.
200 S Juanita Avenue, Redondo Beach, CA 90277
MLS# CL26654541Listed by: RITZ PROPERTIES, INC. $1,199,000Pending3 beds 3 baths1,330 sq. ft.
506 N Helberta Avenue #1, Redondo Beach, CA 90277
MLS# SB26036032Listed by: COMPASS $1,799,000Active3 beds 3 baths1,903 sq. ft.
718 S Catalina #4, Redondo Beach, CA 90277
MLS# SB25276655Listed by: COMPASS $1,799,000Active3 beds 3 baths1,903 sq. ft.
718 S Catalina #4, Redondo Beach, CA 90277
MLS# SB25276655Listed by: COMPASS $1,899,000Active4 beds 3 baths2,440 sq. ft.
235 S Irena Avenue #B, Redondo Beach, CA 90277
MLS# CRSB25262418Listed by: EXP REALTY OF GREATER LOS ANGELES, INC. $2,399,000Active4 beds 4 baths2,400 sq. ft.
110 S Irena Avenue #A, Redondo Beach, CA 90277
MLS# SB25218545Listed by: THOMPSON TEAM REAL ESTATE, INC. $2,349,000Active3 beds 5 baths2,391 sq. ft.
110 S Irena Avenue #B, Redondo Beach, CA 90277
MLS# SB25225745Listed by: THOMPSON TEAM REAL ESTATE, INC. $1,335,000Active3 beds 3 baths1,672 sq. ft.
1800 S Pacific Coast, Redondo Beach, CA 90277
MLS# PV25254000Listed by: ESTATE PROPERTIES $1,639,000Pending3 beds 3 baths2,075 sq. ft.
222 S Juanita Avenue #A, Redondo Beach, CA 90277
MLS# PV25251228Listed by: PENINSULA ESTATES AGENCY $2,399,000Active4 beds 4 baths2,400 sq. ft.
110 S Irena Avenue #A, Redondo Beach, CA 90277
MLS# SB25218545Listed by: THOMPSON TEAM REAL ESTATE, INC. $2,349,000Active3 beds 5 baths2,391 sq. ft.
110 S Irena Avenue #B, Redondo Beach, CA 90277
MLS# SB25225745Listed by: THOMPSON TEAM REAL ESTATE, INC. $899,000Pending2 beds 2 baths955 sq. ft.
520 Avenue B #7, Redondo Beach, CA 90277
MLS# SB25226186Listed by: COMPASS $1,650,000Active3 beds 3 baths2,072 sq. ft.
202 N Irena Avenue #B, Redondo Beach, CA 90277
MLS# SB26017950Listed by: VISTA SOTHEBYS INTERNATIONAL REALTY $1,395,000Pending2 beds 2 baths1,238 sq. ft.
218 N Broadway, Redondo Beach, CA 90277
MLS# SB25078741Listed by: PACIFIC REAL ESTATE & MORTGAGE $1,499,000Active4 beds 3 baths2,324 sq. ft.
117 S Prospect Ave #a, Redondo Beach, CA 90277
MLS# SB26046161Listed by: MORNING STAR PROPERTIES $1,213,170Pending2 beds 2 baths1,450 sq. ft.
500 S Catalina Avenue #5, Redondo Beach, CA 90277
MLS# CRSB23173707Listed by: ENGEL & VOLKERS LA SOUTH BAY
Local realty services provided by:CENTURY 21 Sierra Properties, CENTURY 21 Affiliated, CENTURY 21 Masters
This information is deemed reliable but not guaranteed. You should rely on this information only to decide whether or not to further investigate a particular property. BEFORE MAKING ANY OTHER DECISION, YOU SHOULD PERSONALLY INVESTIGATE THE FACTS (e.g. square footage and lot size) with the assistance of an appropriate professional. You may use this information only to identify properties you may be interested in investigating further. All uses except for personal, non-commercial use in accordance with the foregoing purpose are prohibited. Redistribution or copying of this information, any photographs or video tours is strictly prohibited. This information is derived from the Internet Data Exchange (IDX) service provided by San Diego MLS®. Displayed property listings may be held by a brokerage firm other than the broker and/or agent responsible for this display. The information and any photographs and video tours and the compilation from which they are derived is protected by copyright. Compilation © 2020 San Diego MLS®, Inc.
The information being provided by California Regional MLS (Southern California) is for the consumer's personal, non-commercial use and may not be used for any purpose other than to identify prospective properties consumer may be interested in purchasing. Any information relating to real estate for sale referenced on this web site comes from the Internet Data Exchange (IDX) program of the California Regional MLS (Southern California). CENTURY 21 Masters is not a Multiple Listing Service (MLS), nor does it offer MLS access. This website is a service of CENTURY 21 Masters, a broker participant of California Regional MLS (Southern California). This web site may reference real estate listing(s) held by a brokerage firm other than the broker and/or agent who owns this web site.
The accuracy of all information, regardless of source, including but not limited to open house information, square footages and lot sizes, is deemed reliable but not guaranteed and should be personally verified through personal inspection by and/or with the appropriate professionals. The data contained herein is copyrighted by California Regional MLS (Southern California) and is protected by all applicable copyright laws. Any unauthorized dissemination of this information is in violation of copyright laws and is strictly prohibited.
Copyright 2021 California Regional MLS (Southern California). All rights reserved.
Popular neighborhoods near South Redondo Beach, Redondo Beach, CA
Zip codes near South Redondo Beach, Redondo Beach, CA
- 90245 homes for sale
- 90247 homes for sale
- 90248 homes for sale
- 90249 homes for sale
- 90250 homes for sale
- 90254 homes for sale
- 90260 homes for sale
- 90266 homes for sale
- 90274 homes for sale
- 90275 homes for sale
- 90277 homes for sale
- 90278 homes for sale
- 90501 homes for sale
- 90502 homes for sale
- 90503 homes for sale
- 90504 homes for sale
- 90505 homes for sale
- 90710 homes for sale
- 90717 homes for sale
- 90745 homes for sale
Counties near South Redondo Beach, Redondo Beach, CA
Protect your home and budget from life's surprises with an Assurant Home Warranty, backed by a partner that supports you through every step of homeownership. Explore Plans.
©2026 Century 21 Real Estate LLC. All rights reserved. CENTURY 21®, the CENTURY 21 Logo and C21® are service marks owned by Century 21 Real Estate LLC. Century 21 Real Estate LLC fully supports the principles of the Fair Housing Act and the Equal Opportunity Act. Each office is independently owned and operated. Listing information is deemed reliable but not guaranteed accurate.