- Aquebogue, Riverhead homes for sale
- Bridgehampton, Bridgehampton homes for sale
- Cutchogue, Cutchogue homes for sale
- East Hampton North, East Hampton homes for sale
- East Quogue, East Quogue homes for sale
- Flanders, Riverhead homes for sale
- Hampton Bays, Hampton Bays homes for sale
- Jamesport, Riverhead homes for sale
- Laurel, Laurel homes for sale
- Mattituck, Mattituck homes for sale
- North Sea, Southampton homes for sale
- Northville, Riverhead homes for sale
- Northwest Harbor, East Hampton homes for sale
- Noyack, Sag Harbor homes for sale
- Peconic, Peconic homes for sale
- Shinnecock Hills, Southampton homes for sale
- Tuckahoe, Southampton homes for sale
- Wainscott, East Hampton homes for sale
- Water Mill, Water Mill homes for sale
- Westhampton, Westhampton Beach homes for sale
Southampton, NY - homes for sale
41 of 41 results displayed
- New
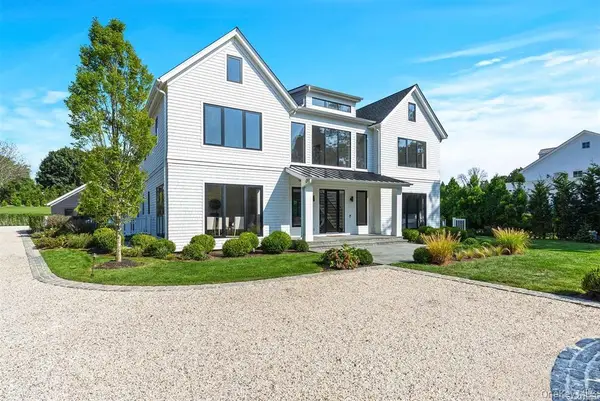
 $2,395,000Active4 beds 4 baths2,600 sq. ft.
27 Atterbury Road, Southampton, NY 11968
MLS# 975324Listed by: NEST SEEKERS INTERNATIONAL LLC - New
 $2,625,000Active7 beds 4 baths3,212 sq. ft.
191 Shinnecock Hills Road, Southampton, NY 11968
MLS# 972909Listed by: NEST SEEKERS INTERNATIONAL LLC 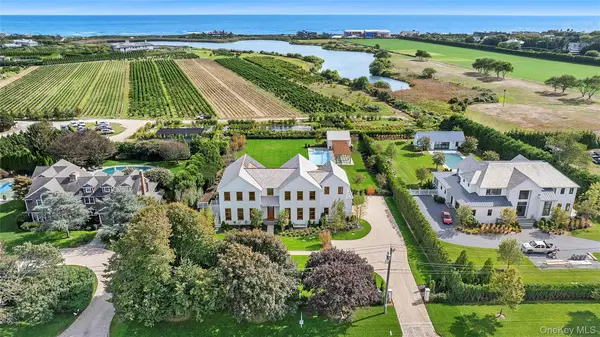 $14,695,000Active7 beds 10 baths8,941 sq. ft.
522 Wickapogue Road, Southampton, NY 11968
MLS# 968892Listed by: NEST SEEKERS INTERNATIONAL LLC- Open Sat, 2 to 4pm
 $3,850,000Active5 beds 3 baths2,026 sq. ft.
33 Hildreth Street, Southampton, NY 11968
MLS# 967575Listed by: SOTHEBYS INT'L REALTY HAMPTONS 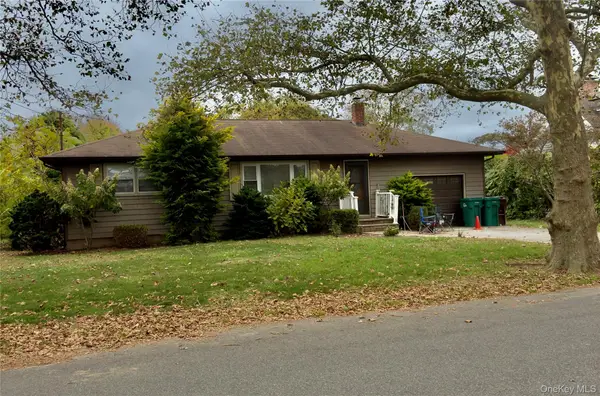 $2,200,000Pending3 beds 1 baths1,080 sq. ft.
166 Pulaski Street, Southampton, NY 11968
MLS# 958619Listed by: ESSENCE REALTY CORP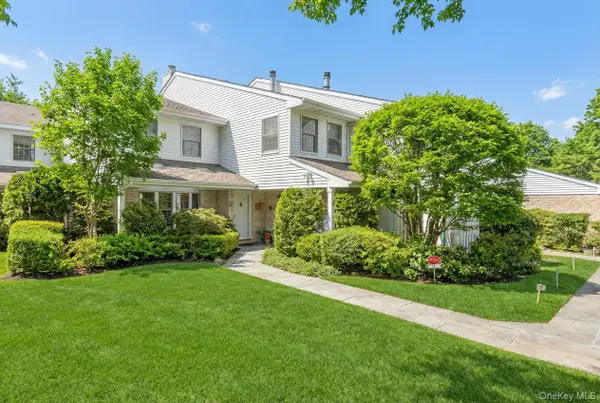 $1,850,000Active3 beds 3 baths2,364 sq. ft.
520 Hampton Road #5, Southampton, NY 11968
MLS# 958352Listed by: NEST SEEKERS INTERNATIONAL LLC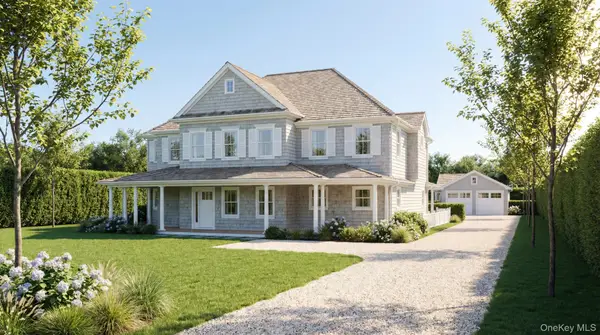 $7,295,000Active6 beds 8 baths5,700 sq. ft.
39 Hildreth Street, Southampton, NY 11968
MLS# 957909Listed by: NEST SEEKERS INTERNATIONAL LLC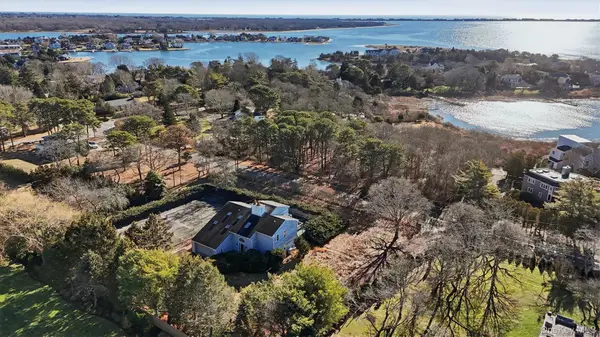 $2,095,000Active4 beds 3 baths2,718 sq. ft.
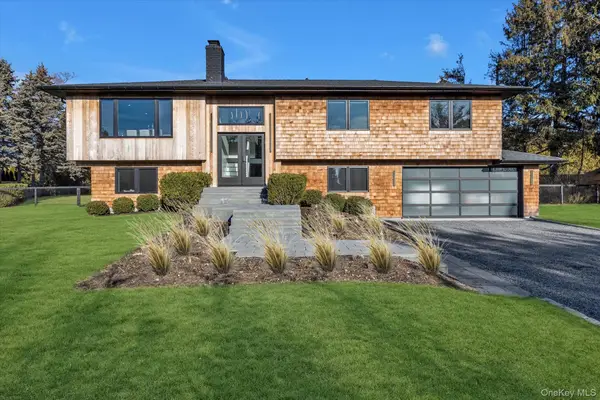
103 Middle Pond Road, Southampton, NY 11968
MLS# 949783Listed by: DANIEL GALE SOTHEBYS INTL RLTY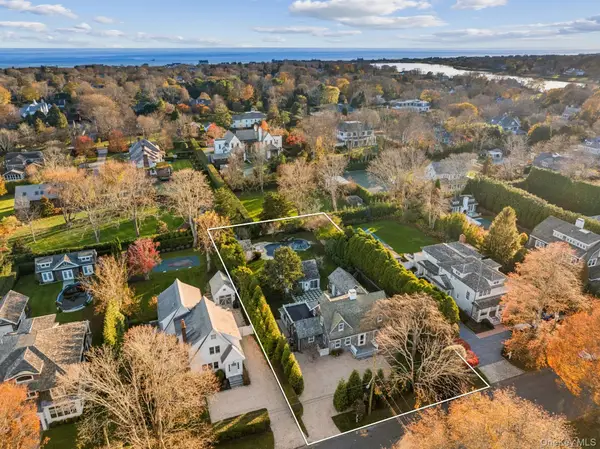 $6,795,000Active4 beds 4 baths3,000 sq. ft.
94 Post Lane, Southampton, NY 11968
MLS# 942706Listed by: CORCORAN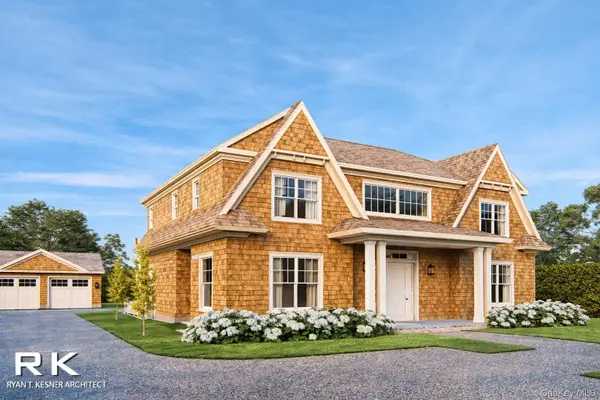 $9,250,000Pending6 beds 8 baths5,763 sq. ft.
27 Adams Lane, Southampton, NY 11968
MLS# 948766Listed by: NEST SEEKERS INTERNATIONAL LLC- Open Sat, 11am to 1pm
 $2,995,000Active5 beds 4 baths2,800 sq. ft.
40 Knollwood Drive, Southampton, NY 11968
MLS# 949089Listed by: DOUGLAS ELLIMAN REAL ESTATE 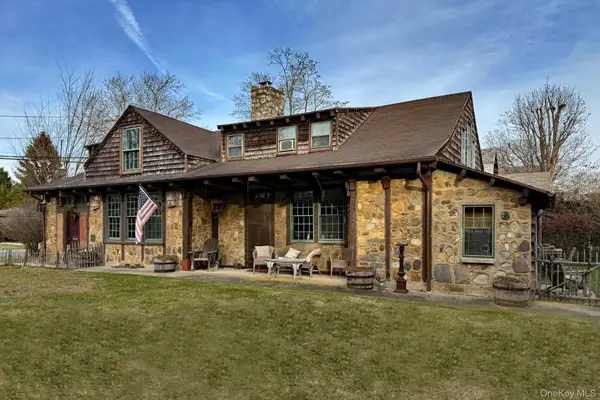 $2,250,000Pending5 beds 2 baths2,126 sq. ft.
10 John Street, Southampton, NY 11968
MLS# 947491Listed by: BROWN HARRIS STEVENS HAMPTONS $1,395,000Active2 beds 2 baths880 sq. ft.
21 N Sea Road, Southampton, NY 11968
MLS# 944598Listed by: BROWN HARRIS STEVENS HAMPTONS $2,100,000Active1.1 Acres
39 Cedar Drive, Southampton, NY 11968
MLS# 942952Listed by: WILLIAM RAVEIS NEW YORK LLC $2,100,000Active3 beds 4 baths3,200 sq. ft.
39 Cedar Drive, Southampton, NY 11968
MLS# 942735Listed by: WILLIAM RAVEIS NEW YORK LLC $7,295,000Active6 beds 9 baths6,000 sq. ft.
100 Narrow Lane, Southampton, NY 11968
MLS# 939794Listed by: DOUGLAS ELLIMAN REAL ESTATE $1,595,000Pending0.97 Acres
34 Scotch Mist Lane, Southampton, NY 11968
MLS# 933685Listed by: BROWN HARRIS STEVENS HAMPTONS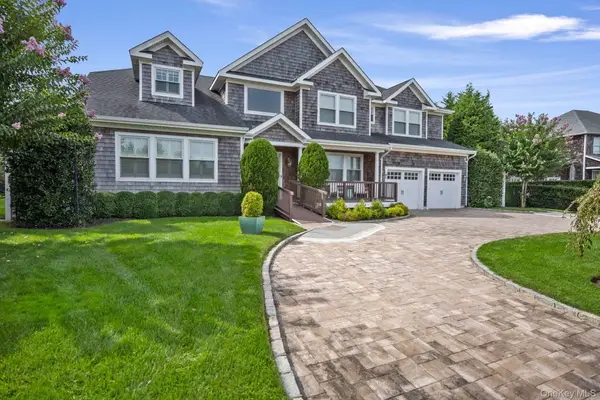 $3,895,000Active6 beds 6 baths3,972 sq. ft.
4 Spring Lane, Southampton, NY 11968
MLS# 920991Listed by: BROWN HARRIS STEVENS HAMPTONS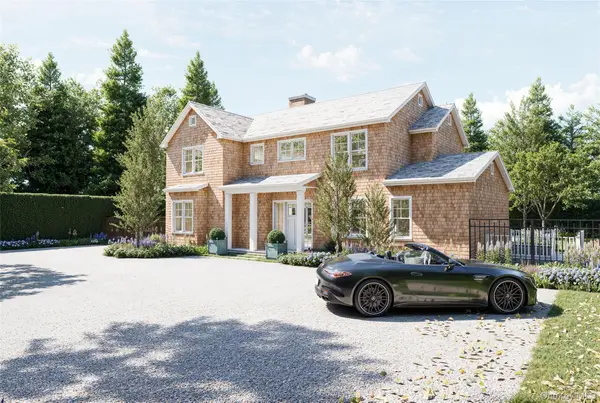 $10,495,000Active6 beds 8 baths4,500 sq. ft.
60 Culver Street, Southampton, NY 11968
MLS# 916731Listed by: NEST SEEKERS INTERNATIONAL LLC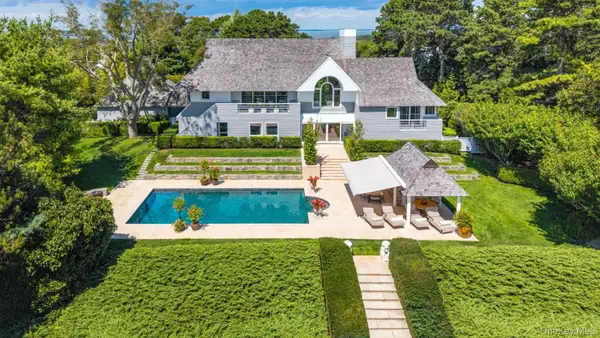 $4,975,000Active4 beds 5 baths3,853 sq. ft.
20 Hillside Road, Southampton, NY 11968
MLS# 914642Listed by: SOTHEBYS INT'L REALTY HAMPTONS- New
 $2,995,000Active4 beds 3 baths2,270 sq. ft.
8 Landsend Lane, Southampton, NY 11968
MLS# 973459Listed by: DOUGLAS ELLIMAN REAL ESTATE 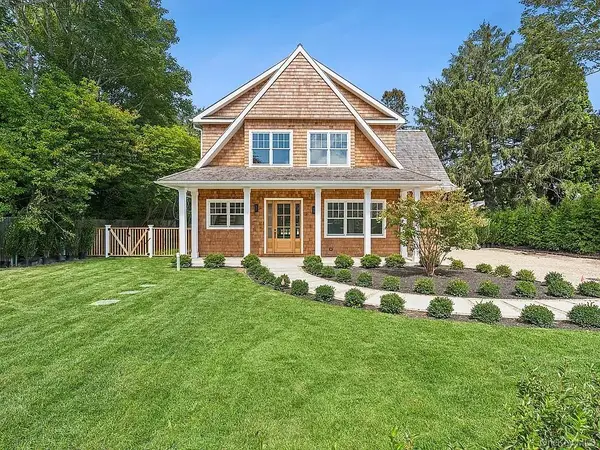 $6,999,000Active8 beds 10 baths5,500 sq. ft.
69 Halsey Street, Southampton, NY 11968
MLS# 911692Listed by: UTOPIA REAL ESTATE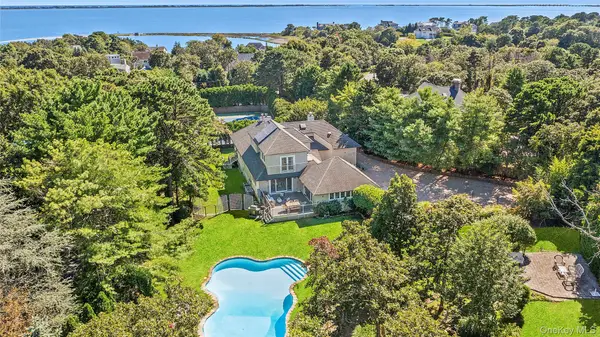 $3,895,000Pending5 beds 6 baths5,800 sq. ft.
141 Middle Pond Road, Southampton, NY 11968
MLS# 904993Listed by: HAMPTONS REALTY ASSOCIATES LLC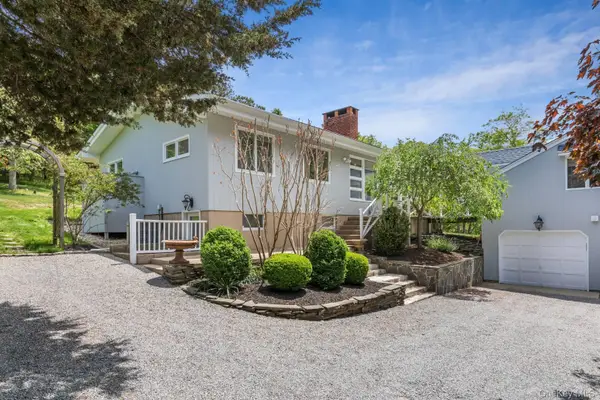 $1,495,000Pending2 beds 1 baths1,000 sq. ft.
16 S Beach Road, Southampton, NY 11968
MLS# 907251Listed by: DOUGLAS ELLIMAN REAL ESTATE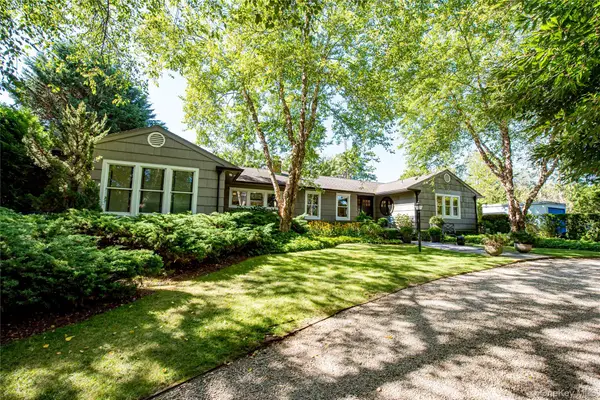 $1,800,000Pending2 beds 3 baths2,152 sq. ft.
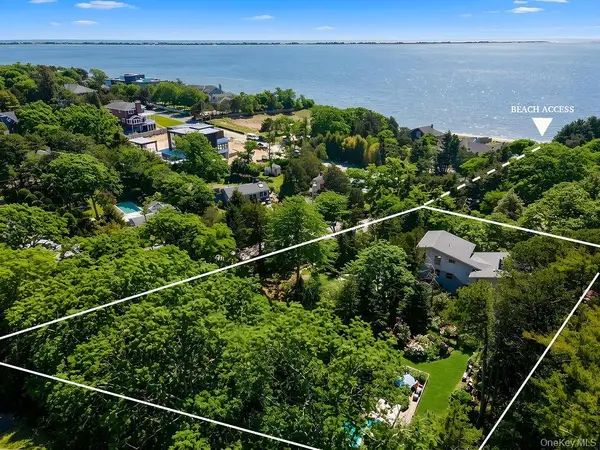
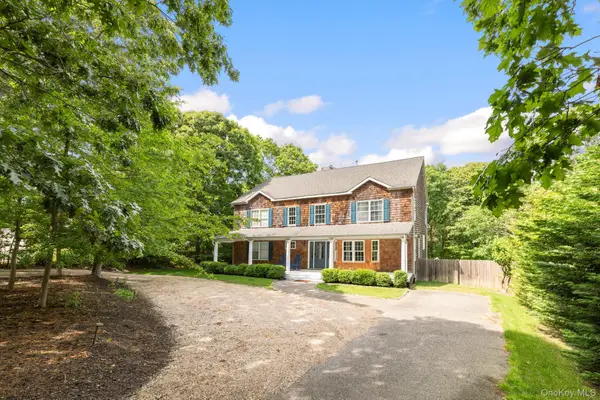
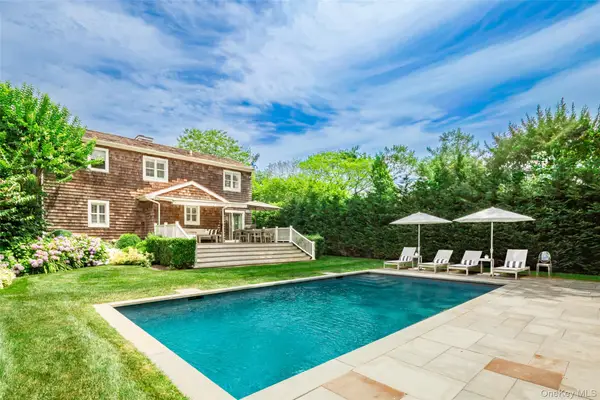
56 Shinnecock Hills Road, Southampton, NY 11968
MLS# 906262Listed by: REALTY CONNECT USA L I INC $8,995,000Active6 beds 9 baths7,307 sq. ft.
50 Tuckahoe Lane, Southampton, NY 11968
MLS# 960949Listed by: NEST SEEKERS INTERNATIONAL LLC $1,995,000Pending3 beds 2 baths1,208 sq. ft.
129 David Whites Lane, Southampton, NY 11968
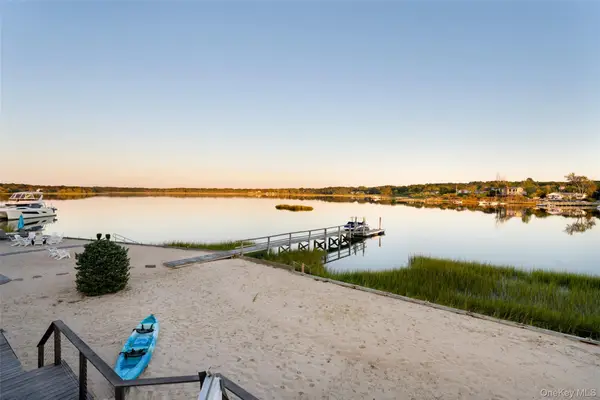
MLS# 895644Listed by: SIGNATURE PREMIER PROPERTIES $9,329,000Pending5 beds 7 baths3,345 sq. ft.
40 Oceanview Drive, Southampton, NY 11968
MLS# 880324Listed by: NEST SEEKERS INTERNATIONAL LLC $1,399,989Pending4 beds 2 baths1,652 sq. ft.
542 Montauk Highway, Southampton, NY 11968
MLS# 878372Listed by: COMPASS GREATER NY LLC $4,795,000Active7 beds 8 baths5,900 sq. ft.
59 Shinnecock Hills Road, Southampton, NY 11968
MLS# 874778Listed by: DOUGLAS ELLIMAN REAL ESTATE $1,100,000Active4 beds 3 baths1,496 sq. ft.
1806 County Road 39, Southampton, NY 11968
MLS# 861494Listed by: CORCORAN- Open Sat, 12 to 2pm
 $7,995,000Active7 beds 10 baths6,500 sq. ft.
276 N Main Street, Southampton, NY 11968
MLS# 852599Listed by: BROWN HARRIS STEVENS W HAMPTON 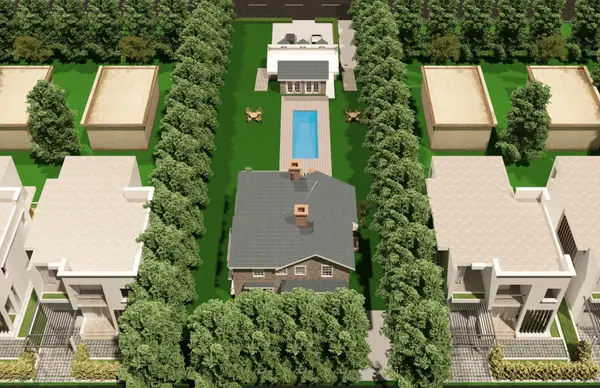 $1,100,000Active0.24 Acres
20 Hillcrest Avenue, Southampton, NY 11968
MLS# 852664Listed by: DOUGLAS ELLIMAN REAL ESTATE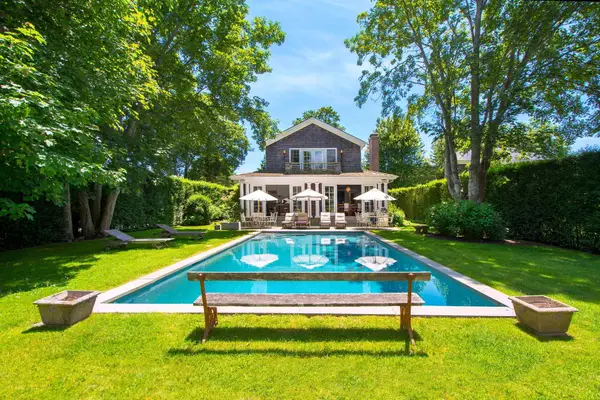 $3,750,000Pending5 beds 5 baths4,356 sq. ft.
97 Pelletreau Street, Southampton, NY 11968
MLS# 800288Listed by: LESLIE J GARFIELD & CO INC $3,250,000Active5 beds 3 baths2,537 sq. ft.
32 Cooper Street, Southampton, NY 11968
MLS# 951193Listed by: CORCORAN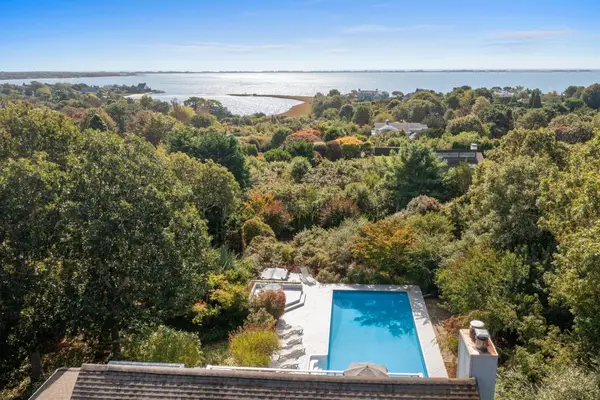 $2,865,000Active4 beds 4 baths3,500 sq. ft.
29 Kenwood Road, Southampton, NY 11968
MLS# 828703Listed by: NEST SEEKERS INTERNATIONAL LLC $2,300,000Active6 beds 5 baths
39 Halsey Avenue, Southampton, NY 11968
MLS# L3582974Listed by: BERKSHIRE HATHAWAY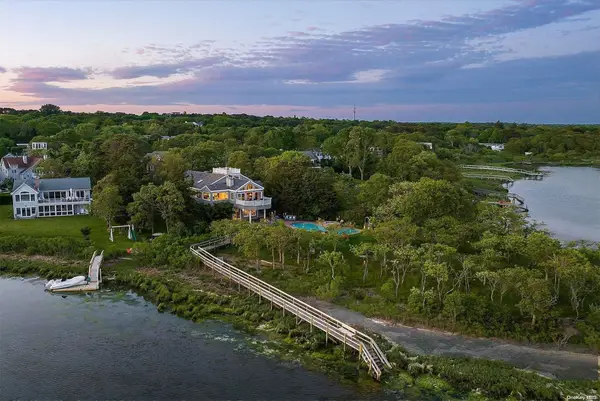 $5,500,000Active4 beds 6 baths3,800 sq. ft.
134 Middle Pond Road, Southampton, NY 11968
MLS# L3562658Listed by: BROWN HARRIS STEVENS HAMPTONS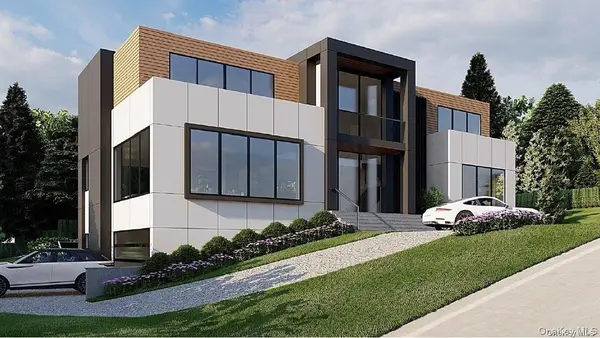 $5,495,000Pending5 beds 6 baths5,419 sq. ft.
15 Oceanview Drive, Southampton, NY 11968
MLS# 885524Listed by: COLDWELL BANKER RELIABLE R E $6,995,000Pending9 beds 12 baths
1 Cameron Way, Southampton, NY 11968
MLS# L3563808Listed by: UTOPIA REAL ESTATE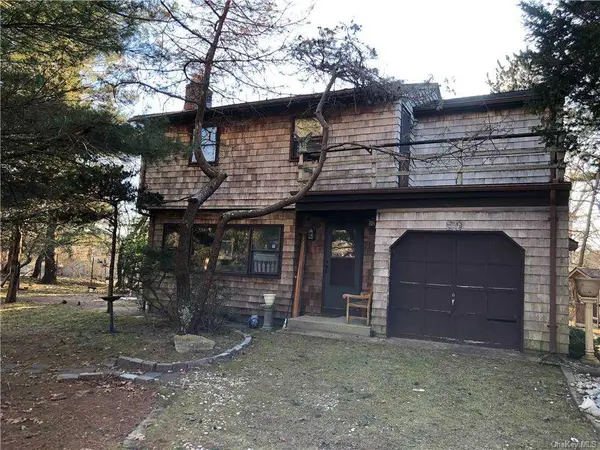 $750,000Pending3 beds 2 baths1,700 sq. ft.
49 Shrubland Road, Southampton, NY 11968
MLS# L3293021Listed by: EXIT REALTY EVERYDAY
Local realty services provided by:CENTURY 21 AllPoints Realty
Neighborhoods near Southampton, NY
Zip codes near Southampton, NY
- 11901 homes for sale
- 11931 homes for sale
- 11932 homes for sale
- 11935 homes for sale
- 11937 homes for sale
- 11942 homes for sale
- 11946 homes for sale
- 11947 homes for sale
- 11948 homes for sale
- 11952 homes for sale
- 11958 homes for sale
- 11959 homes for sale
- 11963 homes for sale
- 11964 homes for sale
- 11965 homes for sale
- 11968 homes for sale
- 11971 homes for sale
- 11975 homes for sale
- 11976 homes for sale
- 11978 homes for sale
Popular searches near Southampton, NY
- Aquebogue homes for sale
- Bridgehampton homes for sale
- Cutchogue homes for sale
- East Hampton homes for sale
- East Quogue homes for sale
- Flanders homes for sale
- Hampton Bays homes for sale
- Jamesport homes for sale
- Laurel homes for sale
- North Haven homes for sale
- North Sea homes for sale
- Noyack homes for sale
- Peconic homes for sale
- Quogue homes for sale
- Sag Harbor homes for sale
- Shinnecock Hills homes for sale
- Southampton town homes for sale
- Tuckahoe homes for sale
- Wainscott homes for sale
- Water Mill homes for sale
Protect your home and budget from life's surprises with an Assurant Home Warranty, backed by a partner that supports you through every step of homeownership. Explore Plans.
©2026 Century 21 Real Estate LLC. All rights reserved. CENTURY 21®, the CENTURY 21 Logo and C21® are service marks owned by Century 21 Real Estate LLC. Century 21 Real Estate LLC fully supports the principles of the Fair Housing Act and the Equal Opportunity Act. Each office is independently owned and operated. Listing information is deemed reliable but not guaranteed accurate.