- Astrodome Area, Houston homes for sale
- Easthaven, Houston homes for sale
- Garden Villas, Houston homes for sale
- Golfcrest / Bellfort / Reveille, Houston homes for sale
- Greater Hobby Area, Houston homes for sale
- Greater Ost / South Union, Houston homes for sale
- Gulfgate Riverview / Pine Valley, Houston homes for sale
- Lawndale / Wayside, Houston homes for sale
- Macgregor, Houston homes for sale
- Meadowbrook, Houston homes for sale
- Minnetex, Houston homes for sale
- Morningside Place, Houston homes for sale
- Park Place, Houston homes for sale
- Park Place Acre Villa Homes, Houston homes for sale
- Pecan Park, Houston homes for sale
- South Acres / Crestmont Park, Houston homes for sale
- South Park, Houston homes for sale
- Southcrest, Houston homes for sale
- Southwood, Houston homes for sale
- Sunnyside, Houston homes for sale
Southeast Houston, Houston, TX - homes for sale
300 of 1,294 results displayed
- New
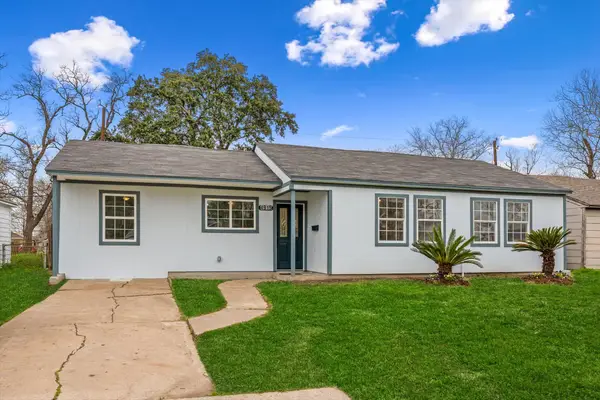
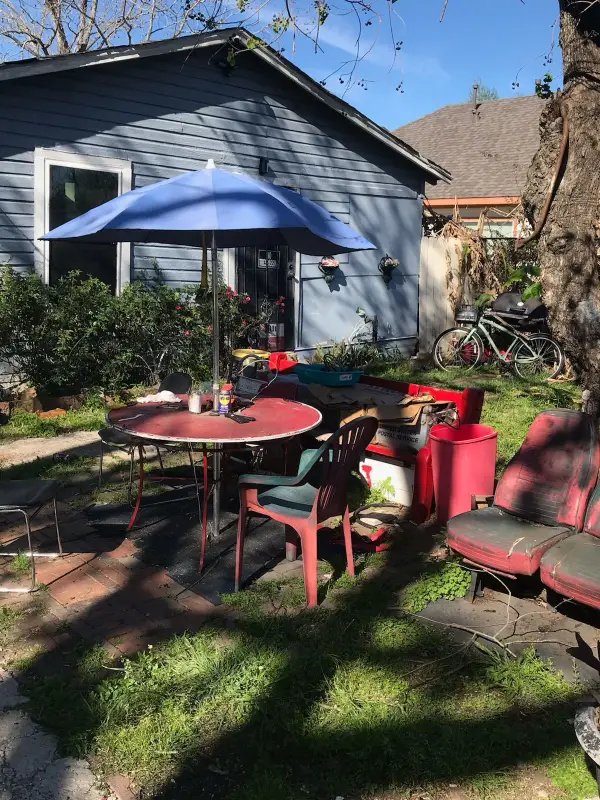
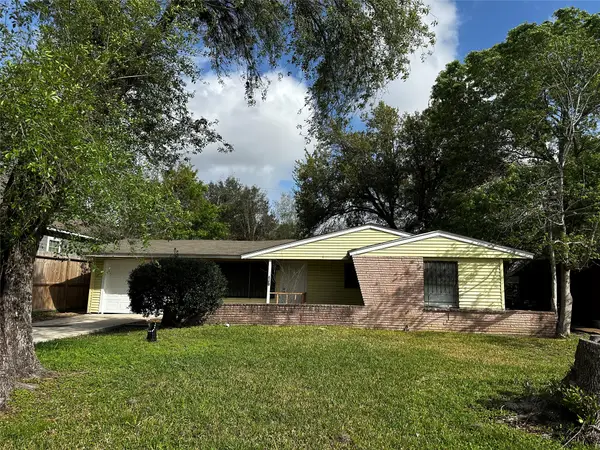
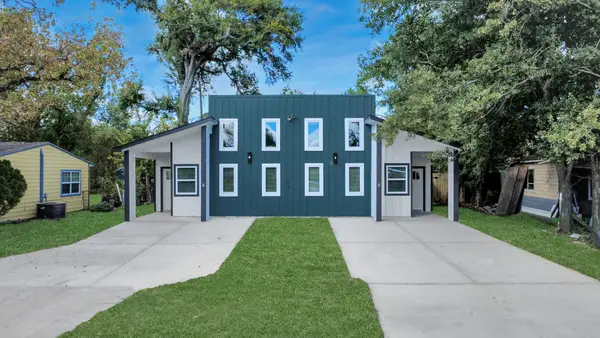
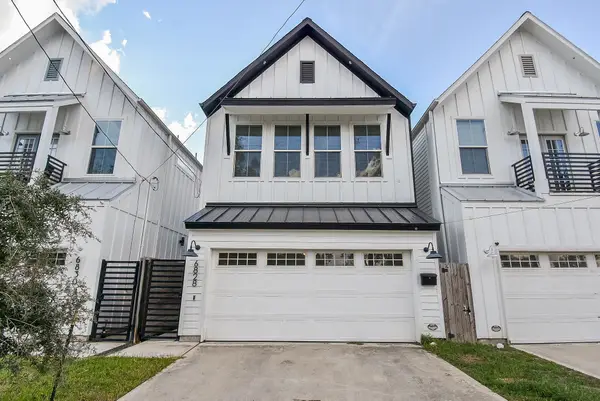
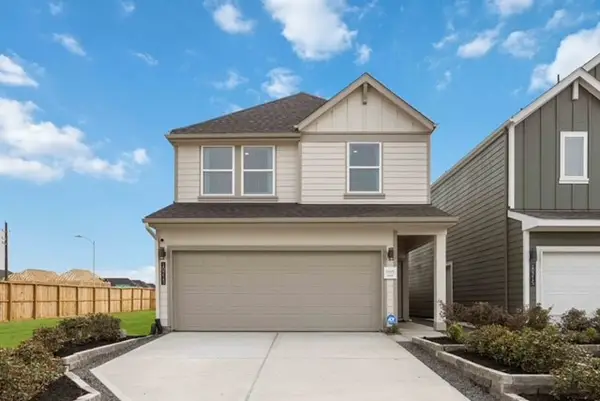
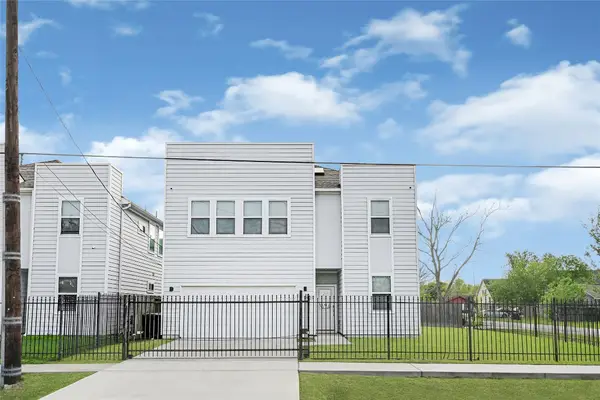 $339,995Active5 beds 3 baths2,078 sq. ft.
9431 Jutland Road, Houston, TX 77033
MLS# 73576544Listed by: NAN & COMPANY PROPERTIES - CORPORATE OFFICE (HEIGHTS) - New
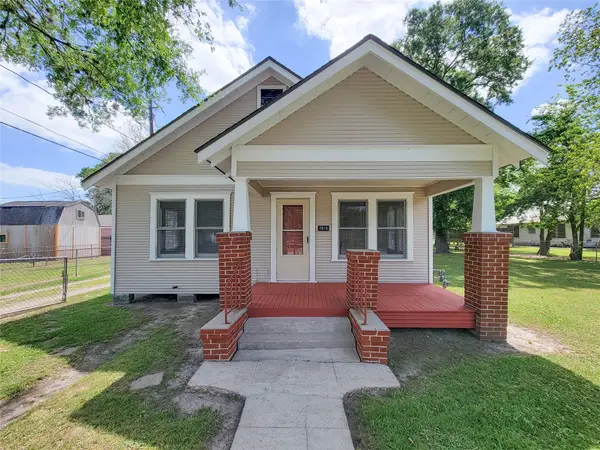
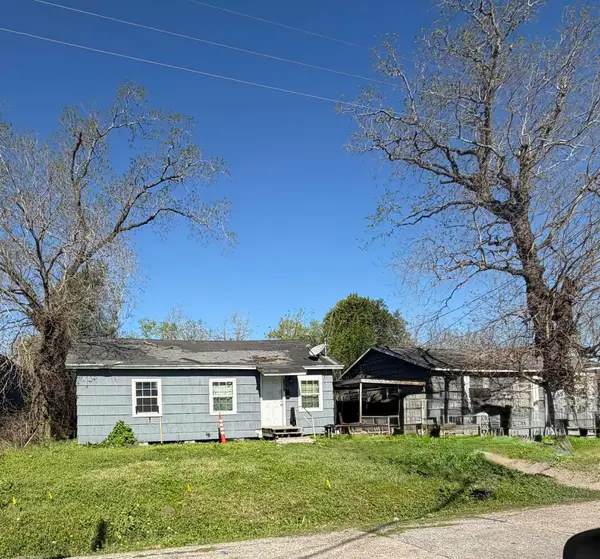
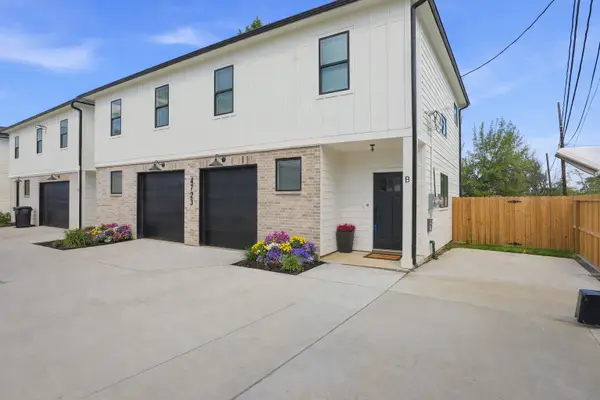
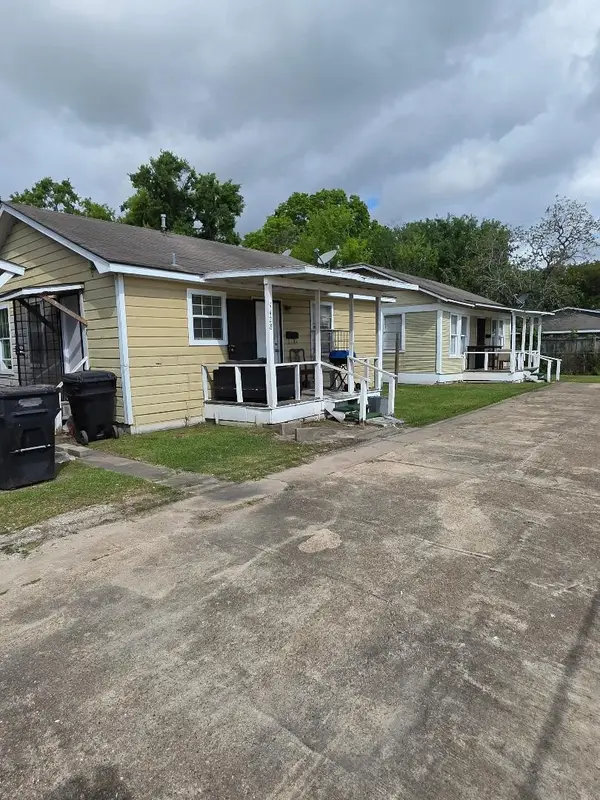 $290,000Active2 beds 3 baths690 sq. ft.
3717 Dawson Lane, Houston, TX 77051
MLS# 82386723Listed by: BAILEY BANKS & GOLDRICH LLC - New
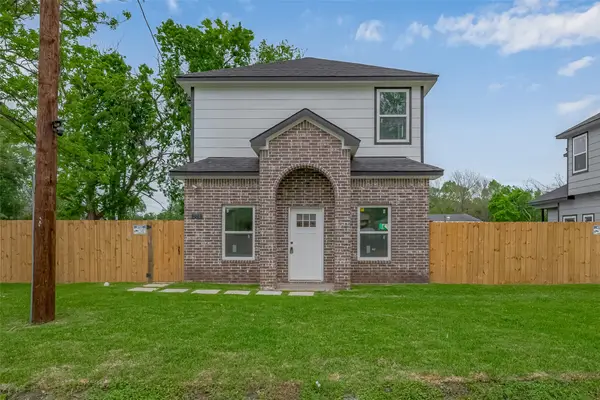
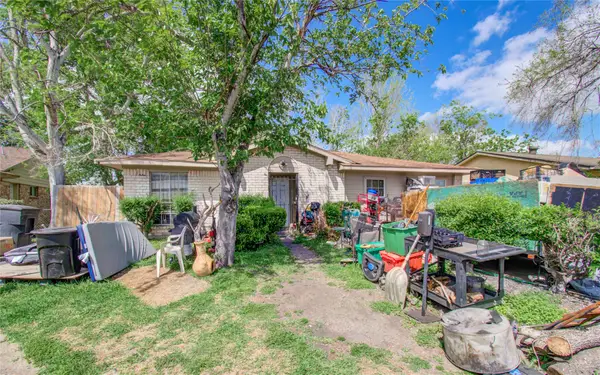
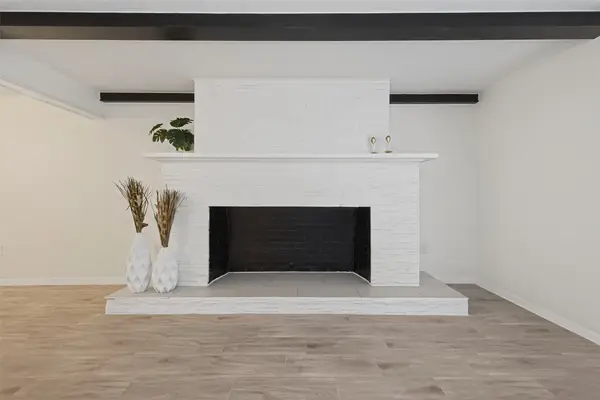
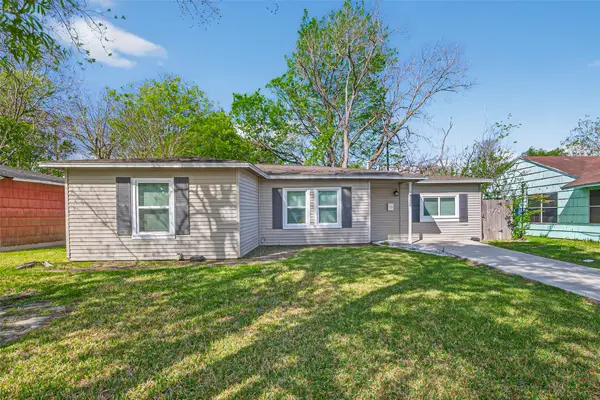
 $270,000Active4 beds 3 baths1,634 sq. ft.
9007 Hilda Street, Houston, TX 77033
MLS# 22562874Listed by: FYI REALTY - KATY - New
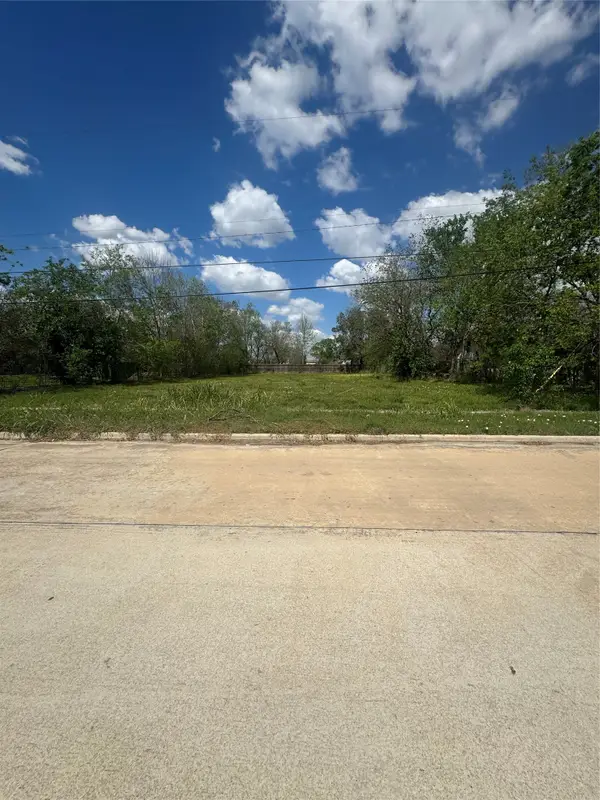
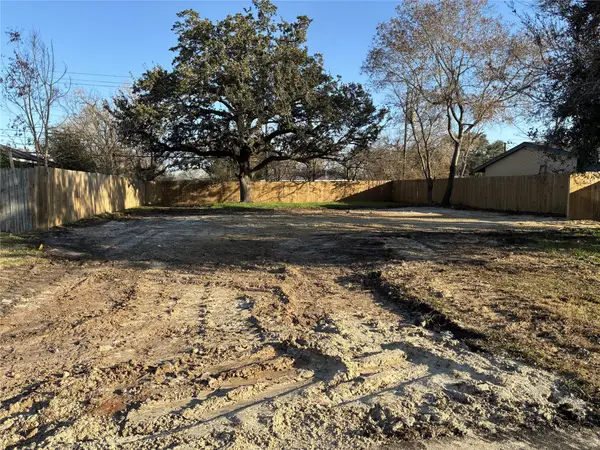 $97,500Active0.17 Acres
5839 Flamingo Drive, Houston, TX 77033
MLS# 37724212Listed by: ROBIN HARRIS, BROKER - New
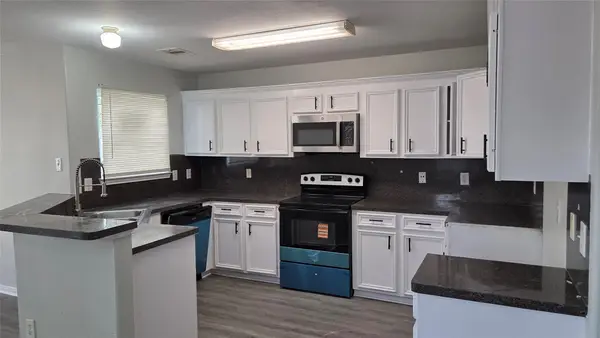
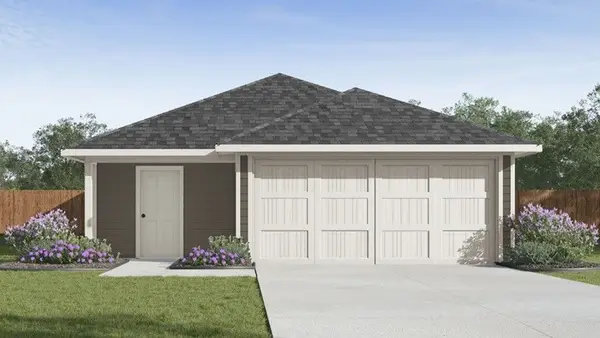
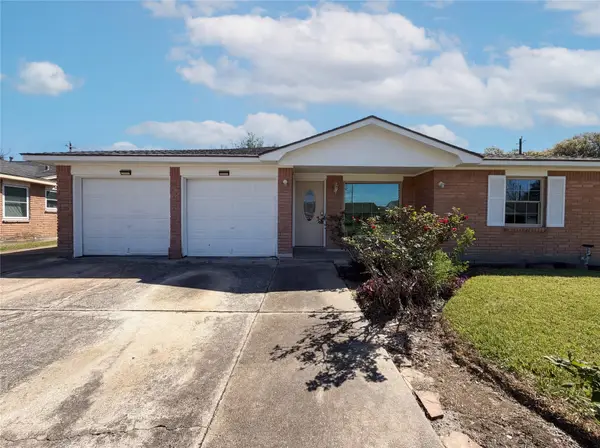
 $290,000Active4 beds 3 baths1,634 sq. ft.
9009 Hilda Street, Houston, TX 77033
MLS# 95263062Listed by: FYI REALTY - KATY - New
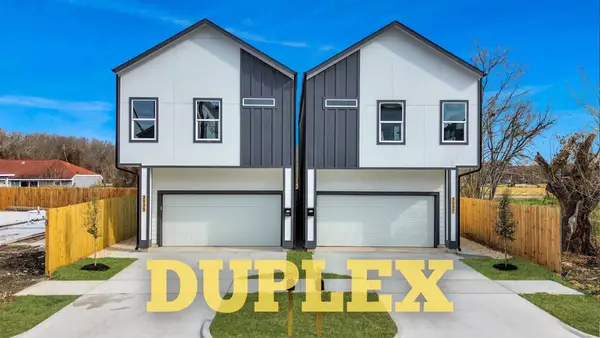
 $549,900Active3 beds 2 baths3,828 sq. ft.
5955 Southseas Street #A/B, Houston, TX 77033
MLS# 80951993Listed by: NEXTGEN REAL ESTATE PROPERTIES - New
 $57,000Active0.06 Acres
6515 England Street, Houston, TX 77021
MLS# 14742876Listed by: HOLLAND & HOLLAND REALTY LLC - New
 $57,000Active0.06 Acres
6513 England Street, Houston, TX 77021
MLS# 4606951Listed by: HOLLAND & HOLLAND REALTY LLC - New
 $1,800,000Active0 Acres
5551 Allison Road, Houston, TX 77048
MLS# 98255125Listed by: LA PALMA REALTY - New
 $204,900Active0.22 Acres
TBD Arrowhead Lane, Houston, TX 77075
MLS# 39797578Listed by: REALTY ASSOCIATES - New
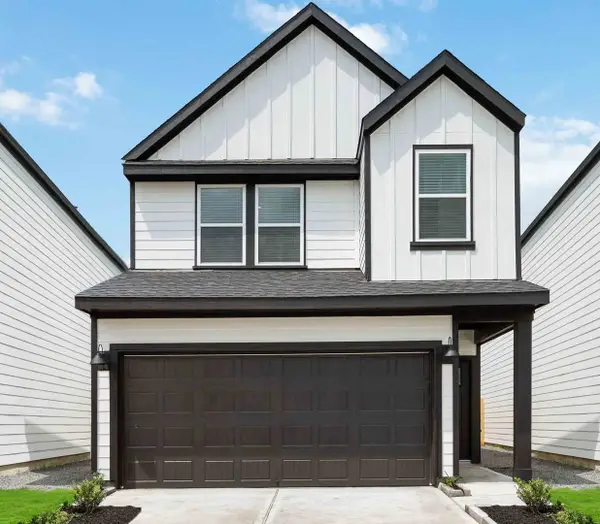
 $345,990Active4 beds 3 baths2,017 sq. ft.
2612 Afton Heights Way, Houston, TX 77051
MLS# 47314383Listed by: EXCLUSIVE PRIME REALTY, LLC - New
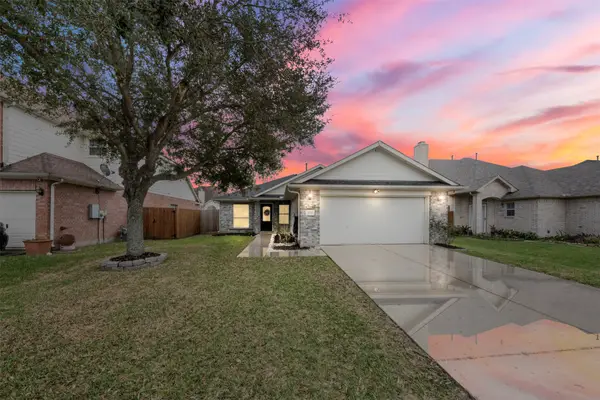
 $285,000Active3 beds 2 baths1,331 sq. ft.
7418 Thurow Street, Houston, TX 77087
MLS# 75739280Listed by: J.L. WYATT PROPERTIES - New
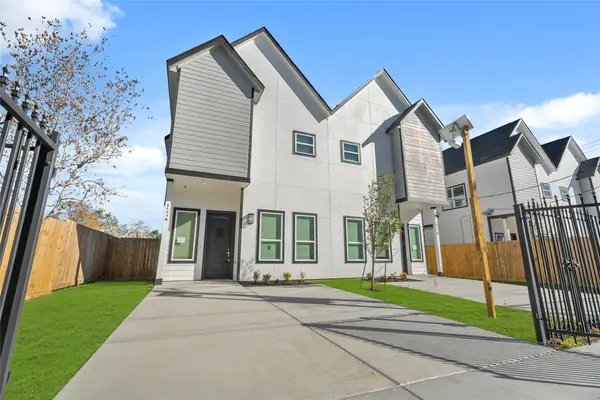
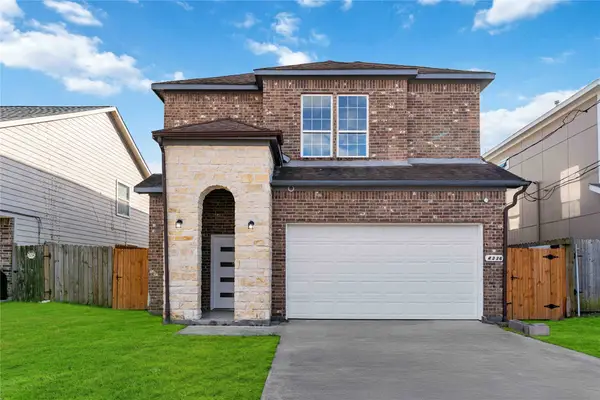
 $271,990Active4 beds 3 baths2,121 sq. ft.
7905 Elowen Grove Drive, Houston, TX 77016
MLS# 5696237Listed by: STARLIGHT HOMES - New
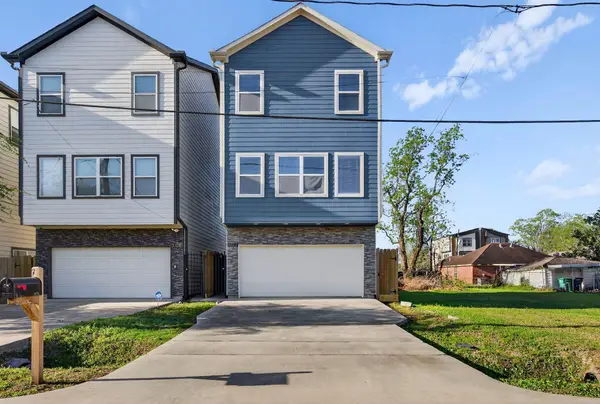
 $185,000Active3 beds 1 baths1,174 sq. ft.
4114 Dacca Drive, Houston, TX 77047
MLS# 72163018Listed by: KELLER WILLIAMS MEMORIAL - New
 $162,900Active3 beds 1 baths936 sq. ft.
4418 Dacca Drive, Houston, TX 77047
MLS# 74232498Listed by: SIERRA VISTA REALTY LLC - New
 $235,000Active4 beds 3 baths1,672 sq. ft.
4614 Phlox Street, Houston, TX 77051
MLS# 87106424Listed by: TIDAL REALTY SERVICES LLC - New
 $85,000Active3 beds 1 baths1,310 sq. ft.
4817 Wenda Street, Houston, TX 77033
MLS# 19264987Listed by: JASON MITCHELL GROUP - New
 $85,000Active3 beds 1 baths1,263 sq. ft.
4809 Wenda Street, Houston, TX 77033
MLS# 29942162Listed by: JASON MITCHELL GROUP - New
 $235,000Active4 beds 2 baths1,230 sq. ft.
4915 Andrea Street, Houston, TX 77021
MLS# 57357465Listed by: EXP REALTY LLC - New
 $210,000Active2 beds 1 baths832 sq. ft.
7818 Dixie Drive, Houston, TX 77087
MLS# 67586303Listed by: COMPASS RE TEXAS, LLC - HOUSTON  $319,990Pending4 beds 3 baths1,719 sq. ft.
2626 Afton Heights Way, Houston, TX 77051
MLS# 37565052Listed by: EXCLUSIVE PRIME REALTY, LLC- New
 $160,000Active4 beds 3 baths1,447 sq. ft.
5011 Cresthaven Circle, Houston, TX 77048
MLS# 60239824Listed by: ALL CITY REAL ESTATE - New
 $459,900Active4 beds 3 baths3,968 sq. ft.
4121 Mallow Street #A/B, Houston, TX 77051
MLS# 37806585Listed by: INTERCONTINENTAL PROPERTIES - New
 $359,000Active4 beds 4 baths2,304 sq. ft.
9215 Noel Street, Houston, TX 77033
MLS# 64396030Listed by: KELLER WILLIAMS MEMORIAL - New$135,000Active0.14 Acres
3902 Southlawn Street, Houston, TX 77021
MLS# 69473676Listed by: KELLER WILLIAMS REALTY-FM - New
 $399,999Active3 beds 2 baths2,156 sq. ft.
5838 Beldart Street, Houston, TX 77033
MLS# 88882522Listed by: 5TH STREAM REALTY - New
 $249,000Active2 beds 1 baths796 sq. ft.
7922 Jutland Road Road, Houston, TX 77033
MLS# 60321949Listed by: NB ELITE REALTY - New
 $679,900Active2 beds 2 baths3,273 sq. ft.
4562 Teton Street #A-D, Houston, TX 77051
MLS# 33101875Listed by: BROOKS & DAVIS REAL ESTATE - New
 $160,000Active0.12 Acres
8536 Scott Street, Houston, TX 77051
MLS# 11740227Listed by: RODNEY JACKSON REALTY GROUP, LLC - New
 $539,500Active3 beds 2 baths3,200 sq. ft.
6734 Paris Street #A-B, Houston, TX 77021
MLS# 8814305Listed by: REAL PROPERTIES - New
 $499,900Active4 beds 3 baths3,656 sq. ft.
4505 Maggie Street #A, Houston, TX 77051
MLS# 51001289Listed by: THE SEARS GROUP - New
 $299,000Active4 beds 3 baths1,977 sq. ft.
7309 Hobby Wind Ridge Drive, Houston, TX 77075
MLS# 65633452Listed by: CB&A, REALTORS - New
 $339,900Active4 beds 2 baths1,830 sq. ft.
5119 Selinsky Road, Houston, TX 77048
MLS# 17360400Listed by: EXCLUSIVE REALTY GROUP LLC - New
 $448,000Active3 beds 3 baths1,918 sq. ft.
5613 Leonard Street, Houston, TX 77023
MLS# 30710535Listed by: HCA INVESTMENT CO. - New
 $229,000Active4 beds 2 baths1,665 sq. ft.
10609 Murr Way, Houston, TX 77048
MLS# 67715714Listed by: EXP REALTY LLC - New
 $448,000Active3 beds 3 baths1,918 sq. ft.
5617 Leonard Street, Houston, TX 77023
MLS# 9550671Listed by: HCA INVESTMENT CO. - New
 $499,000Active3 beds 2 baths3,189 sq. ft.
8447 Jutland Road, Houston, TX 77033
MLS# 16140011Listed by: KELLER WILLIAMS REALTY SOUTHWEST - New
 $79,000Active2 beds 1 baths720 sq. ft.
4425 Galesburg Street, Houston, TX 77051
MLS# 40039305Listed by: EXP REALTY LLC 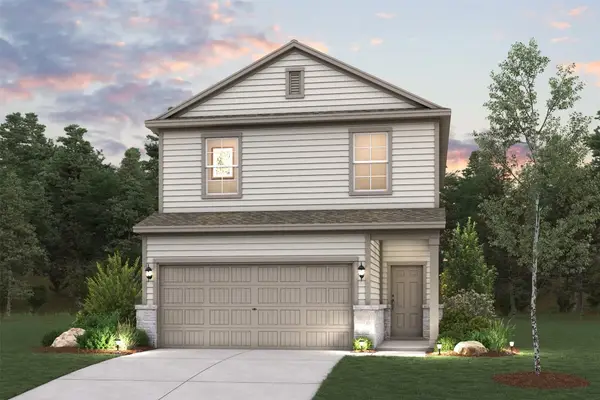 $277,900Pending4 beds 3 baths1,556 sq. ft.
11408 Waterford Spring Trail, Houston, TX 77047
MLS# 40788922Listed by: CENTURY COMMUNITIES- New
 $499,000Active3 beds 2 baths3,189 sq. ft.
8445 Jutland Road, Houston, TX 77033
MLS# 53672326Listed by: KELLER WILLIAMS REALTY SOUTHWEST - New
 $344,900Active3 beds 4 baths1,881 sq. ft.
3732 Nathaniel Brown St, Houston, TX 77021
MLS# 89375996Listed by: REALM REAL ESTATE PROFESSIONALS - WEST HOUSTON - New
 $415,000Active3 beds 2 baths2,458 sq. ft.
4818 Paula Street, Houston, TX 77033
MLS# 28080782Listed by: SUGAR VALLEY REALTY - New
 $150,000Active3 beds 3 baths1,516 sq. ft.
3903 Hickok Lane, Houston, TX 77047
MLS# 2854471Listed by: BK REAL ESTATE - New
 $350,000Active3 beds 2 baths2,230 sq. ft.
3006 Corksie Street, Houston, TX 77051
MLS# 33837393Listed by: RE/MAX REAL ESTATE ASSOC. - New
 $195,000Active0.08 Acres
4607 Larkspur Street, Houston, TX 77051
MLS# 35832310Listed by: NEXTGEN REAL ESTATE PROPERTIES - New
 $159,999Active4 beds 1 baths1,232 sq. ft.
5101 Mallow Street, Houston, TX 77033
MLS# 56869615Listed by: UNITED REAL ESTATE  $256,000Pending3 beds 2 baths1,362 sq. ft.
5108 Frisch Street, Houston, TX 77048
MLS# 65895742Listed by: HOMESMART- New
 $395,000Active3 beds 3 baths1,872 sq. ft.
4607 Clover Street, Houston, TX 77051
MLS# 70988604Listed by: BURKI REALTY GROUP - New
 $315,000Active3 beds 2 baths1,474 sq. ft.
7015 Kopman Drive, Houston, TX 77061
MLS# 91824985Listed by: CITY GROUP PROPERTIES - New
 $105,000Active3 beds 1 baths1,212 sq. ft.
5831 Lyndhurst Drive, Houston, TX 77033
MLS# 10118108Listed by: ALPHAMAX REALTY INC. - New
 $344,000Active3 beds 3 baths2,380 sq. ft.
4336 Maggie Street, Houston, TX 77051
MLS# 10439965Listed by: MR. REAL ESTATE 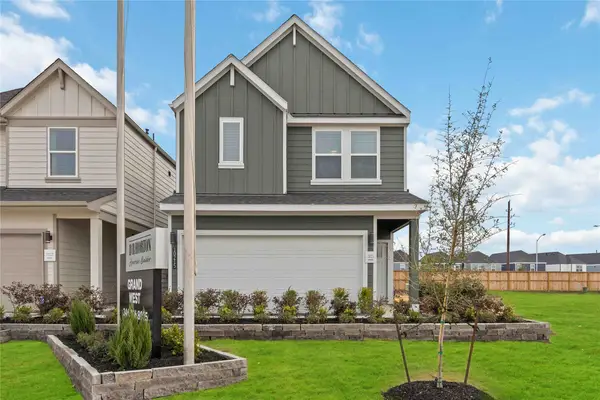 $299,990Pending3 beds 3 baths1,586 sq. ft.
2618 Afton Heights Way, Houston, TX 77051
MLS# 10916569Listed by: EXCLUSIVE PRIME REALTY, LLC- New
 $249,900Active3 beds 1 baths792 sq. ft.
6306 London Street, Houston, TX 77021
MLS# 16817161Listed by: KELLER WILLIAMS HOUSTON CENTRAL - New
 $342,990Active3 beds 3 baths1,718 sq. ft.
3537 Amos Street, Houston, TX 77021
MLS# 17273574Listed by: ATLAS REAL ESTATE - New
 $265,000Active3 beds 3 baths2,029 sq. ft.
13309 Myrtle Meadows Lane, Houston, TX 77048
MLS# 24350370Listed by: FATHOM REALTY - New
 $439,900Active3 beds 2 baths2,279 sq. ft.
4139 Brinkley Street, Houston, TX 77051
MLS# 2583699Listed by: BROOKS & DAVIS REAL ESTATE - New
 $322,000Active4 beds 2 baths1,303 sq. ft.
2281 Des Jardines Street, Houston, TX 77023
MLS# 27257313Listed by: MIDPOINT REALTORS - New
 $99,000Active3 beds 3 baths1,556 sq. ft.
4407 Mowery Road, Houston, TX 77047
MLS# 27557813Listed by: COMPASS RE TEXAS, LLC - MEMORIAL - New
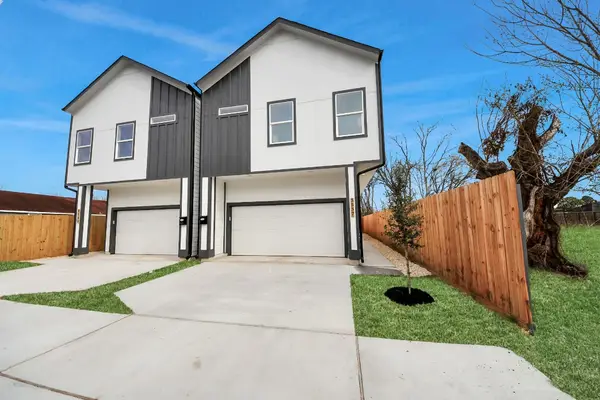
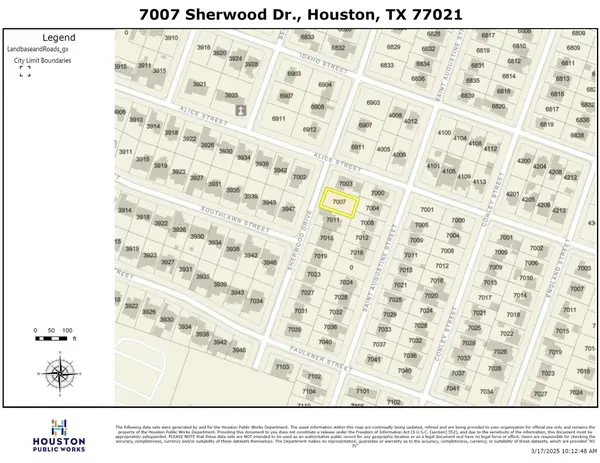 $90,000Active0.14 Acres
7007 Sherwood Drive, Houston, TX 77021
MLS# 28499569Listed by: NB ELITE REALTY - New
 $329,900Active4 beds 3 baths2,570 sq. ft.
5324 Cj Walker Lane, Houston, TX 77048
MLS# 30278312Listed by: EPIQUE REALTY LLC - New
 $280,000Active4 beds 2 baths1,326 sq. ft.
3605 Corder Street, Houston, TX 77021
MLS# 30698261Listed by: WALZEL PROPERTIES - CORPORATE OFFICE - New
 $649,990Active3 beds 3 baths1,893 sq. ft.
3509 Goodhope Street #A, Houston, TX 77021
MLS# 33634661Listed by: ROOTS BROKERAGE - New
 $439,000Active5 beds 3 baths2,893 sq. ft.
4219 Redbud Street Sw, Houston, TX 77051
MLS# 36503334Listed by: BETTER HOMES AND GARDENS REAL ESTATE GARY GREENE - CHAMPIONS - New
 $375,000Active0 Acres
0 Balkin Street, Houston, TX 77021
MLS# 37789452Listed by: NEXTGEN REAL ESTATE PROPERTIES - New
 $499,900Active3 beds 2 baths2,816 sq. ft.
5941 Southlea Street, Houston, TX 77033
MLS# 3841588Listed by: PREMIER HAUS REALTY, LLC - New
 $485,000Active3 beds 3 baths2,944 sq. ft.
4723 Mallow Street, Houston, TX 77033
MLS# 42449279Listed by: ADEO HOMES REALTY - New
 $290,000Active5 beds 3 baths1,904 sq. ft.
7718 Morley Street, Houston, TX 77061
MLS# 44963814Listed by: ALLIANCE PROPERTIES - New
 $288,990Active3 beds 2 baths1,434 sq. ft.
4814 Peanut Butter And Jelly Drive, Houston, TX 77048
MLS# 45276738Listed by: BRADEN REAL ESTATE GROUP - New
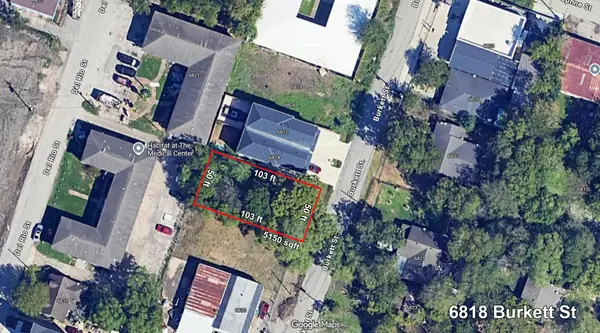 $128,750Active0.12 Acres
6818 Burkett Street, Houston, TX 77021
MLS# 47565138Listed by: SUNTRUST REALTY - New
 $274,999Active3 beds 2 baths1,539 sq. ft.
6938 Hobby Wind Ridge Drive, Houston, TX 77075
MLS# 47682424Listed by: THE VINCERE GROUP LLC - New
 $180,000Active3 beds 2 baths1,207 sq. ft.
5237 Carmen Street, Houston, TX 77033
MLS# 49852542Listed by: KELLER WILLIAMS REALTY METROPOLITAN - New
 $140,000Active0 Acres
0 Foster Street, Houston, TX 77021
MLS# 49910297Listed by: NEXTGEN REAL ESTATE PROPERTIES - New
 $324,700Active4 beds 5 baths2,265 sq. ft.
4004 Weslow Street, Houston, TX 77087
MLS# 50664942Listed by: PREMIER HAUS REALTY, LLC - New
 $380,000Active3 beds 3 baths2,300 sq. ft.
7115 England Street #A, Houston, TX 77021
MLS# 52802992Listed by: LSNC REALTY - New
 $175,000Active4 beds 2 baths1,403 sq. ft.
5322 Westover Street, Houston, TX 77033
MLS# 52820684Listed by: FYI REALTY - KATY - New
 $70,000Active2 beds 1 baths858 sq. ft.
6309 Buford Street, Houston, TX 77023
MLS# 54006525Listed by: THE SEARS GROUP - New
 $125,000Active0.14 Acres
5017 Southwind Street, Houston, TX 77033
MLS# 56493272Listed by: PREMIER HAUS REALTY, LLC - New
 $684,990Active3 beds 2 baths3,436 sq. ft.
3535 & 3537 Amos Street, Houston, TX 77021
MLS# 56697055Listed by: ATLAS REAL ESTATE - New
 $270,000Active4 beds 3 baths1,634 sq. ft.
9005 Hilda Street, Houston, TX 77033
MLS# 56895843Listed by: FYI REALTY - KATY - New
 $179,900Active3 beds 1 baths1,189 sq. ft.
9314 Ashville Drive, Houston, TX 77051
MLS# 56956265Listed by: HOMESMART - New
 $264,999Active4 beds 2 baths1,648 sq. ft.
6152 Doulton Drive, Houston, TX 77033
MLS# 59909344Listed by: LOFT REALTY - New
 $124,900Active3 beds 1 baths1,100 sq. ft.
4303 Mowery Road, Houston, TX 77047
MLS# 69970033Listed by: WFI MANAGEMENT LLC - New
 $225,000Active3 beds 2 baths1,496 sq. ft.
5763 Thrush Drive, Houston, TX 77033
MLS# 71278340Listed by: REAL PROPERTIES - New
 $94,900Active0 Acres
4917 Paula Street, Houston, TX 77033
MLS# 72399317Listed by: BROOKS & DAVIS REAL ESTATE - New
 $349,500Active3 beds 3 baths1,967 sq. ft.
6828 Liverpool Street, Houston, TX 77021
MLS# 72853560Listed by: EXP REALTY LLC - New
 $279,990Active3 beds 3 baths1,384 sq. ft.
10321 Lancaster Forest Lane, Houston, TX 77051
MLS# 76269801Listed by: EXCLUSIVE PRIME REALTY, LLC - New
 $289,900Active4 beds 2 baths1,625 sq. ft.
6322 Atlasridge Drive, Houston, TX 77048
MLS# 7873937Listed by: CITY GROUP PROPERTIES 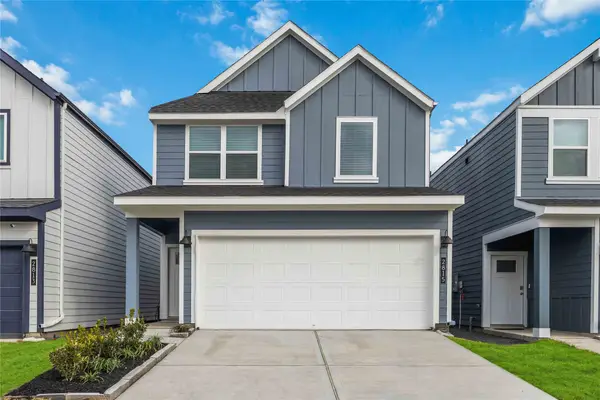 $329,990Pending4 beds 3 baths2,017 sq. ft.
10313 Lancaster Forest Lane, Houston, TX 77051
MLS# 83808127Listed by: EXCLUSIVE PRIME REALTY, LLC- New
 $319,990Active4 beds 3 baths1,719 sq. ft.
10302 Largent Hollow Trail, Houston, TX 77051
MLS# 84181654Listed by: EXCLUSIVE PRIME REALTY, LLC - New
 $195,000Active4 beds 2 baths1,240 sq. ft.
8126 Marcy Drive, Houston, TX 77033
MLS# 88707248Listed by: NEXT TREND REALTY LLC - New
 $235,000Active4 beds 2 baths1,634 sq. ft.
6023 Winterhaven Drive, Houston, TX 77087
MLS# 92162950Listed by: OPENDOOR BROKERAGE, LLC - New
 $450,000Active0.11 Acres
0 Scott Street, Houston, TX 77021
MLS# 92780254Listed by: GOOD DAY REALTY - New
 $110,000Active0.46 Acres
0 Glengarry Road, Houston, TX 77048
MLS# 93626537Listed by: MOVE FORWARD TX LLC - New
 $334,900Active3 beds 4 baths1,971 sq. ft.
6402 Pregonero Lane, Houston, TX 77048
MLS# 96139854Listed by: CITIQUEST PROPERTIES - New
 $550,000Active3 beds 3 baths2,635 sq. ft.
5519 Ospre Y Drive #A/B, Houston, TX 77048
MLS# 96970419Listed by: UNITED REAL ESTATE - Open Sat, 1 to 3pm
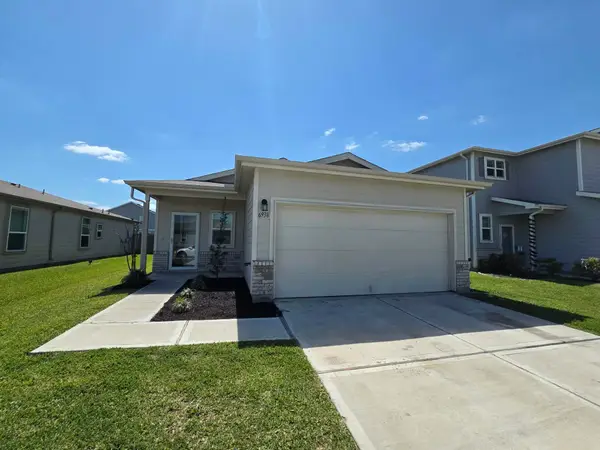
 $384,990Active3 beds 3 baths1,968 sq. ft.
6814 Burkett Street, Houston, TX 77021
MLS# 24931759Listed by: CITIQUEST PROPERTIES - New
 $288,000Active5 beds 4 baths
4356 Phlox Street, Houston, TX 77051
MLS# 20774269Listed by: ADILA REALTY LLC - New
 $95,000Active3 beds 1 baths1,106 sq. ft.
3121 Nita Street, Houston, TX 77051
MLS# 24099979Listed by: EXP REALTY LLC - New
 $248,000Active4 beds 2 baths846 sq. ft.
3910 Luca St Street, Houston, TX 77021
MLS# 25111199Listed by: ADILA REALTY LLC - New
 $250,000Active4 beds 4 baths1,961 sq. ft.
4418 Rosemont Street, Houston, TX 77051
MLS# 67908466Listed by: NYDAN LLC DBA NYDAN REAL ESTATE GROUP - New
 $450,000Active0.17 Acres
4230 Sterling Street, Houston, TX 77051
MLS# 45123035Listed by: BERKSHIRE HATHAWAY HOMESERVICES PREMIER PROPERTIES - New
 $200,000Active2 beds 1 baths1,100 sq. ft.
4235 Elmwood Street, Houston, TX 77051
MLS# 48669932Listed by: BERKSHIRE HATHAWAY HOMESERVICES PREMIER PROPERTIES - New
 $337,000Active4 beds 3 baths2,092 sq. ft.
7134 Eastwood Street #A, Houston, TX 77021
MLS# 55567372Listed by: TEXAS USA REALTY - New
 $250,000Active2 beds 1 baths1,152 sq. ft.
4228 Sterling Street, Houston, TX 77051
MLS# 61632628Listed by: BERKSHIRE HATHAWAY HOMESERVICES PREMIER PROPERTIES - New
 $335,000Active4 beds 3 baths2,092 sq. ft.
7134 Eastwood Street #B, Houston, TX 77021
MLS# 94521528Listed by: TEXAS USA REALTY - New
 $165,000Active3 beds 2 baths1,226 sq. ft.
5326 Wenda Street, Houston, TX 77033
MLS# 10590484Listed by: REALM REAL ESTATE PROFESSIONALS - NORTH HOUSTON - New
 $120,000Active-- beds 1 baths1,046 sq. ft.
6654 Crosswell Street, Houston, TX 77087
MLS# 28924624Listed by: PAK HOME REALTY - New
 $119,000Active0.12 Acres
6620 England Street, Houston, TX 77021
MLS# 37977061Listed by: NB ELITE REALTY - New
 $520,000Active3 beds 2 baths2,768 sq. ft.
7555 Calhoun Road #A/B, Houston, TX 77033
MLS# 61497855Listed by: NEXTGEN REAL ESTATE PROPERTIES - New
 $520,000Active3 beds 2 baths2,768 sq. ft.
7646 Calhoun Road #A/B, Houston, TX 77033
MLS# 95361181Listed by: NEXTGEN REAL ESTATE PROPERTIES  $215,000Active4 beds 2 baths1,326 sq. ft.
7108 Eastwood Street, Houston, TX 77021
MLS# 26838495Listed by: URBAN LOOP REALTY $119,500Active3 beds 1 baths1,020 sq. ft.
7314 Forrestal Street, Houston, TX 77033
MLS# 39814457Listed by: REALM REAL ESTATE PROFESSIONALS - KATY $200,000Active0.43 Acres
0 Mykawa Road, Houston, TX 77048
MLS# 66573951Listed by: WHITE PICKET REALTY LLC $475,000Active3 beds 2 baths2,422 sq. ft.
8318 Brandon Street, Houston, TX 77051
MLS# 68558436Listed by: COLDWELL BANKER REALTY - SUGAR LAND $270,000Active3 beds 3 baths2,057 sq. ft.
6259 El Topacio Drive, Houston, TX 77048
MLS# 86904285Listed by: SURGE REALTY- New
 $295,000Active3 beds 2 baths1,422 sq. ft.
2909 Newington Lane, Houston, TX 77047
MLS# 26699823Listed by: SIMIEN PROPERTIES  $190,000Active3 beds 2 baths1,838 sq. ft.
3127 Brisbane Street, Houston, TX 77051
MLS# 10121233Listed by: GIRARD PROPERTIES $175,000Active3 beds 1 baths905 sq. ft.
3129 Airport Boulevard, Houston, TX 77051
MLS# 25248950Listed by: SURGE REALTY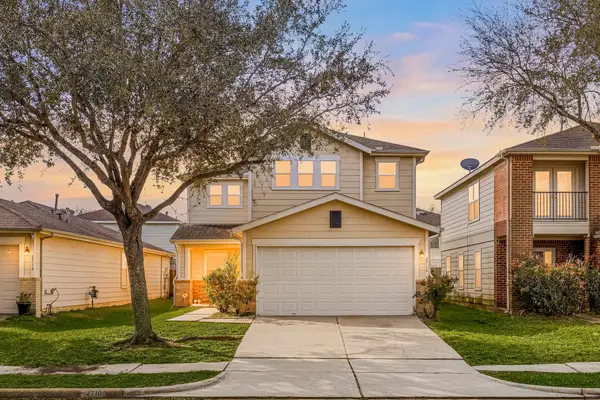 $298,000Active3 beds 3 baths2,569 sq. ft.
2710 Skyview Ridge Court, Houston, TX 77047
MLS# 27200484Listed by: REDFIN CORPORATION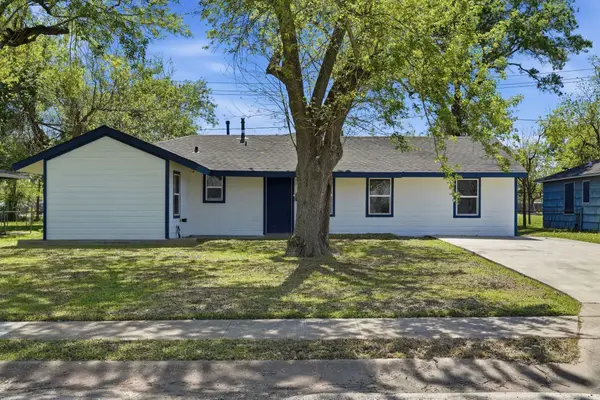 $225,000Active4 beds 2 baths1,332 sq. ft.
5962 Ridgeway Drive, Houston, TX 77033
MLS# 60407338Listed by: JLA REALTY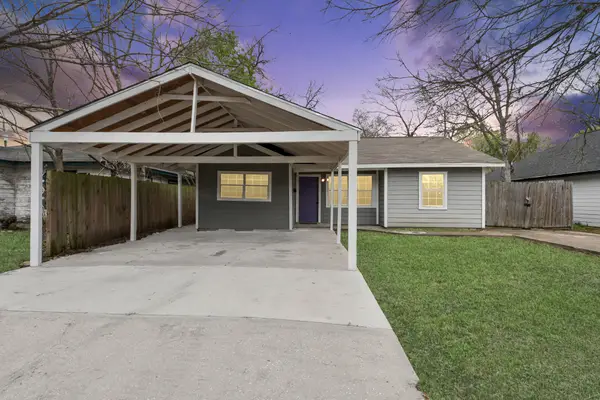 $211,900Active4 beds 2 baths1,466 sq. ft.
5521 Southlea Street, Houston, TX 77033
MLS# 56777963Listed by: SURGE REALTY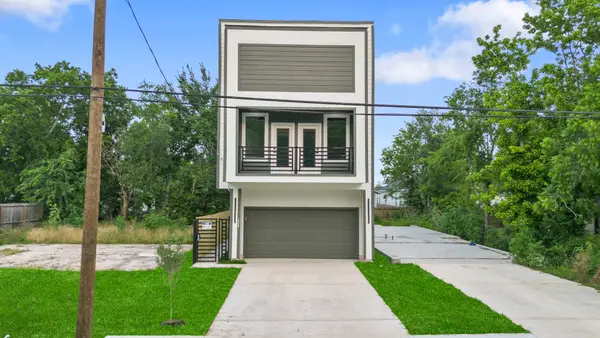 $315,000Active3 beds 3 baths2,500 sq. ft.
6631 Foster Street, Houston, TX 77021
MLS# 70895214Listed by: KELLER WILLIAMS PREFERRED $549,000Active4 beds 4 baths3,428 sq. ft.
5806 Southlea Street, Houston, TX 77033
MLS# 97458120Listed by: CJM REALTY ADVISORS $364,800Pending3 beds 4 baths2,012 sq. ft.
3617B Mt Pleasant Street, Houston, TX 77021
MLS# 72135912Listed by: HAPPEN HOUSTON $305,000Active3 beds 2 baths1,958 sq. ft.
8150 Bassett Street, Houston, TX 77051
MLS# 22573323Listed by: CJM REALTY ADVISORS- Open Sat, 12 to 4pm
 $293,999Active3 beds 2 baths1,740 sq. ft.
12902 Wempe Way, Houston, TX 77047
MLS# 22940691Listed by: HOME REALTY, LLC  $649,000Active0.46 Acres
8243 Telephone Road, Houston, TX 77061
MLS# 31995253Listed by: EXCEED REALTY LLC- Open Thu, 11am to 5pm
 $325,000Active3 beds 3 baths1,637 sq. ft.
13402 Sombrero Cay Drive, Houston, TX 77047
MLS# 49241520Listed by: NAN & COMPANY PROPERTIES - CORPORATE OFFICE (HEIGHTS) - Open Thu, 11am to 5pm
 $349,900Active3 beds 3 baths1,637 sq. ft.
13445 Sun Cay Drive, Houston, TX 77047
MLS# 53140334Listed by: NAN & COMPANY PROPERTIES - CORPORATE OFFICE (HEIGHTS)  $289,990Active3 beds 2 baths1,628 sq. ft.
5602 Belmark Street, Houston, TX 77033
MLS# 59489704Listed by: ATLAS REAL ESTATE- Open Thu, 11am to 5pm
 $379,900Active3 beds 3 baths2,045 sq. ft.
3003A Ventas Drive, Houston, TX 77047
MLS# 81746285Listed by: NAN & COMPANY PROPERTIES - CORPORATE OFFICE (HEIGHTS)  $198,500Active4 beds 1 baths1,180 sq. ft.
5402 Flamingo Drive, Houston, TX 77033
MLS# 90504731Listed by: RE/MAX PEARLAND $459,000Active3 beds 4 baths2,174 sq. ft.
5025 Mallow Street #A and B, Houston, TX 77033
MLS# 92940112Listed by: CHAMPIONS NEXTGEN REAL ESTATE $279,000Active2 beds 1 baths1,600 sq. ft.
6201 Saint Augustine Street, Houston, TX 77021
MLS# 10777916Listed by: SUMMIT REALTY & ASSOCIATES LLC $247,995Active3 beds 2 baths1,243 sq. ft.
6444 Wenlock Drive, Houston, TX 77048
MLS# 38359826Listed by: STEP REAL ESTATE $495,000Active0.15 Acres
8935 Jutland Road, Houston, TX 77033
MLS# 56504058Listed by: COMPASS RE TEXAS, LLC - HOUSTON $155,000Pending3 beds 2 baths2,019 sq. ft.
4819 Lingonberry Street, Houston, TX 77033
MLS# 48798075Listed by: HOMESMART $299,000Active4 beds 4 baths1,485 sq. ft.
5325 Basquiat Drive, Houston, TX 77048
MLS# 56567056Listed by: STEP REAL ESTATE $237,000Active4 beds 3 baths1,614 sq. ft.
5231 Lyndhurst Drive, Houston, TX 77033
MLS# 92723651Listed by: HOME ALLIANCE GROUP $329,000Active3 beds 3 baths1,671 sq. ft.
2948 Pitzlin Street, Houston, TX 77023
MLS# 75061213Listed by: TRUSS REAL ESTATE, LLC $129,900Active0.11 Acres
3558 Goodhope Street, Houston, MS 77021
MLS# 79227148Listed by: WALZEL PROPERTIES - CORPORATE OFFICE $349,000Active3 beds 3 baths2,070 sq. ft.
7341 Oak Hill Drive, Houston, TX 77087
MLS# 10649364Listed by: HOMESMART $190,000Active4 beds 2 baths1,176 sq. ft.
10602 Buffum Street, Houston, TX 77051
MLS# 16293645Listed by: TEXAS TIER REALTY $400,000Active3 beds 3 baths2,313 sq. ft.
10406 Ballantine Street, Houston, TX 77075
MLS# 34749404Listed by: COLDWELL BANKER REALTY - HOUSTON BAY AREA $220,000Active3 beds 2 baths1,903 sq. ft.
11810 Mosscrest Drive, Houston, TX 77048
MLS# 45285196Listed by: KELLER WILLIAMS REALTY PROFESSIONALS $240,000Active3 beds 3 baths1,925 sq. ft.
4843 Bricker Street, Houston, TX 77033
MLS# 55398615Listed by: KELLER WILLIAMS REALTY AUSTIN- Open Wed, 10:30am to 12pm
 $605,900Active3 beds 2 baths3,490 sq. ft.
8312 Comal Street, Houston, TX 77051
MLS# 74500241Listed by: KELLER WILLIAMS MEMORIAL  $250,000Active3 beds 2 baths969 sq. ft.
7530 Park Place Boulevard, Houston, TX 77087
MLS# 75418565Listed by: MOVE HOUSTON REAL ESTATE- Open Wed, 10:30am to 12pm
 $570,900Active6 beds 4 baths3,740 sq. ft.
8023 Brandon Street, Houston, TX 77051
MLS# 91388948Listed by: KELLER WILLIAMS MEMORIAL  $484,900Active3 beds 2 baths2,500 sq. ft.
4015 Stassen Street #A-B, Houston, TX 77051
MLS# 95986714Listed by: BROOKS & DAVIS REAL ESTATE $585,000Active-- beds -- baths3,360 sq. ft.
5027 Willow Glen Drive #A-B, Houston, TX 77033
MLS# 48372487Listed by: BETTER HOMES AND GARDENS REAL ESTATE GARY GREENE - BAY AREA $120,000Active0.23 Acres
00 Saylynn Lane, Houston, TX 77075
MLS# 35515024Listed by: TEXAS NEON REALTY $269,990Active3 beds 2 baths1,280 sq. ft.
4820 Peanut Butter And Jelly Drive, Houston, TX 77048
MLS# 61670303Listed by: BRADEN REAL ESTATE GROUP $350,000Active4 beds 3 baths2,320 sq. ft.
5807 Doulton Drive, Houston, TX 77033
MLS# 82804138Listed by: HOMESMART $250,000Active3 beds 2 baths1,577 sq. ft.
7118 Heron Drive, Houston, TX 77087
MLS# 85276784Listed by: EXP REALTY LLC $950,000Active4 beds 2 baths2,134 sq. ft.
4425 Fuqua Street, Houston, TX 77048
MLS# 17652199Listed by: BROOKS BALLARD INTERNATIONAL REAL ESTATE $327,540Active4 beds 3 baths2,250 sq. ft.
5714 Adamite Way, Houston, TX 77048
MLS# 57387320Listed by: MERITAGE HOMES REALTY $207,000Pending3 beds 2 baths1,475 sq. ft.
5640 Giving Grace Way, Houston, TX 77048
MLS# 11182383Listed by: CASEY CASTLES, LLC $229,999Active3 beds 2 baths1,100 sq. ft.
5433 Chennault Road, Houston, TX 77033
MLS# 91223893Listed by: EXP REALTY LLC $244,999Active3 beds 2 baths1,403 sq. ft.
3538 Cork Drive, Houston, TX 77047
MLS# 71860811Listed by: BLUEBERRIE HOMES $214,900Active3 beds 1 baths1,440 sq. ft.
9413 Arden Court, Houston, TX 77033
MLS# 14748696Listed by: NAN & COMPANY PROPERTIES - CORPORATE OFFICE (HEIGHTS) $187,500Active3 beds 2 baths1,292 sq. ft.
9309 Cathedral Drive, Houston, TX 77051
MLS# 28987742Listed by: LOUTEX REALTY $299,000Active3 beds 3 baths1,447 sq. ft.
7160 Rook Boulevard, Houston, TX 77087
MLS# 70227884Listed by: INNOVA REALTY GROUP $478,999Active3 beds 2 baths2,420 sq. ft.
4314 Stassen Street, Houston, TX 77051
MLS# 64751642Listed by: EXP REALTY LLC $75,000Active0.1 Acres
5002 Higgins Street, Houston, TX 77033
MLS# 47942724Listed by: KBH SIGNATURE REALTY GROUP- $155,000Active0.15 Acres
4503 Dewberry Street, Houston, TX 77021
MLS# 55097064Listed by: KBH SIGNATURE REALTY GROUP  $315,640Pending4 beds 3 baths1,981 sq. ft.
5719 Adamite Way, Houston, TX 77048
MLS# 94782106Listed by: MERITAGE HOMES REALTY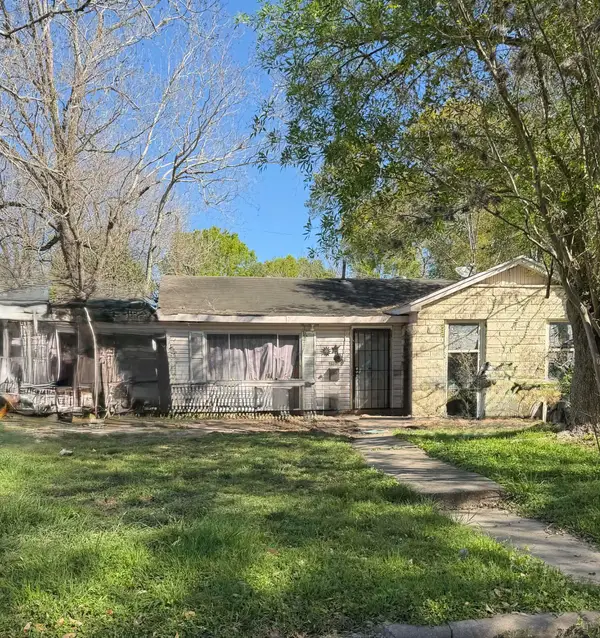 $154,900Active3 beds 1 baths1,722 sq. ft.
4827 Ventura Lane, Houston, TX 77021
MLS# 12885323Listed by: KELLER WILLIAMS HOUSTON CENTRAL $283,940Active3 beds 2 baths1,440 sq. ft.
5710 Adamite Way, Houston, TX 77048
MLS# 18473791Listed by: MERITAGE HOMES REALTY $313,640Active4 beds 3 baths1,981 sq. ft.
5727 Adamite Way, Houston, TX 77048
MLS# 28634866Listed by: MERITAGE HOMES REALTY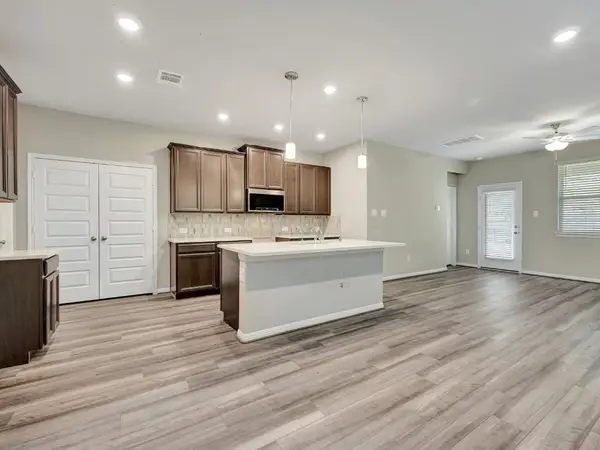 $286,640Active4 beds 3 baths1,981 sq. ft.
5723 Adamite Way, Houston, TX 77048
MLS# 31754542Listed by: MERITAGE HOMES REALTY $380,000Active3 beds 3 baths2,045 sq. ft.
3007 Ventas Drive, Houston, TX 77047
MLS# 51951049Listed by: REALTY OF AMERICA, LLC $119,000Active2 beds 1 baths888 sq. ft.
4505 Perry Street, Houston, TX 77021
MLS# 61754674Listed by: KELLER WILLIAMS HOUSTON CENTRAL $209,000Active3 beds 3 baths1,583 sq. ft.
6418 England Street, Houston, TX 77021
MLS# 6264336Listed by: EXP REALTY LLC $281,940Active3 beds 2 baths1,440 sq. ft.
5718 Adamite Way, Houston, TX 77048
MLS# 69022149Listed by: MERITAGE HOMES REALTY $310,000Active3 beds 3 baths2,388 sq. ft.
6712 Winton Street, Houston, TX 77021
MLS# 88296653Listed by: LUXELY REAL ESTATE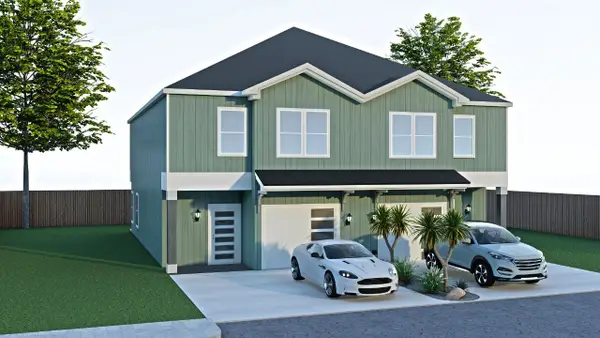 $99,990Active0.11 Acres
8507 Rubin Street, Houston, TX 77051
MLS# 93878814Listed by: ROOTS BROKERAGE $220,000Pending3 beds 2 baths1,230 sq. ft.
7338 Hurtgen Forest Road, Houston, TX 77033
MLS# 35227630Listed by: NEXT TREND REALTY LLC $225,000Active4 beds 2 baths1,482 sq. ft.
6527 Beekman Road, Houston, TX 77021
MLS# 87268677Listed by: REAL BROKER, LLC $999,000Active3.99 Acres
0 Carson Road, Houston, TX 77048
MLS# 87390002Listed by: RE/MAX OPPORTUNITIES $315,000Active4 beds 3 baths2,172 sq. ft.
2823 Kennet Manor Drive, Houston, TX 77047
MLS# 27119957Listed by: THE AGENCY TEAM $194,000Active0.8 Acres
4707 Allison Road, Houston, TX 77048
MLS# 39245490Listed by: KELLER WILLIAMS REALTY METROPOLITAN $160,000Active3 beds 1 baths1,200 sq. ft.
5602 Southlea Street, Houston, TX 77033
MLS# 98019955Listed by: KELLER WILLIAMS MEMORIAL $194,700Active3 beds 2 baths1,185 sq. ft.
5842 Beldart Street, Houston, TX 77033
MLS# 19785622Listed by: VIVE REALTY LLC- Open Wed, 4 to 7pm
 $535,000Active4 beds 3 baths3,428 sq. ft.
4818 Briscoe Street, Houston, TX 77033
MLS# 17133645Listed by: COLDWELL BANKER REALTY - SUGAR LAND 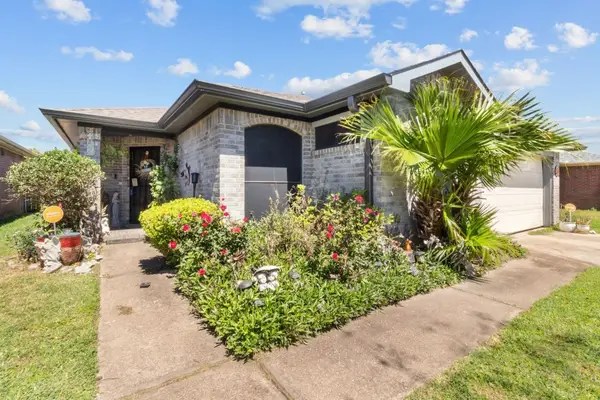 $199,000Active3 beds 2 baths1,407 sq. ft.
5227 Honeyvine Drive, Houston, TX 77048
MLS# 36675168Listed by: FATHOM REALTY $319,990Pending4 beds 3 baths1,719 sq. ft.
10319 Lancaster Forest Lane, Houston, TX 77051
MLS# 39587184Listed by: EXCLUSIVE PRIME REALTY, LLC $377,500Active6 beds 4 baths2,280 sq. ft.
10137 Teneha Drive, Houston, TX 77033
MLS# 17191254Listed by: KELLER WILLIAMS REALTY SOUTHWEST $300,000Active0.33 Acres
0 Wilmington Street, Houston, TX 77033
MLS# 98457369Listed by: ALLSOURCE PROPERTIES $699,999Active3 beds 3 baths3,660 sq. ft.
7012 & 7014 Saint Augustine Street, Houston, TX 77021
MLS# 3859712Listed by: ATLAS REAL ESTATE $305,000Active4 beds 3 baths2,273 sq. ft.
12610 Skyview Creek Court, Houston, TX 77047
MLS# 74762940Listed by: MEGA REALTY $81,900Active2 beds 2 baths1,122 sq. ft.
7818 Grove Ridge Drive, Houston, TX 77061
MLS# 7504278Listed by: VINH PHUONG NGUYEN $55,000Active0 Acres
0 Mount Pleasant Street, Houston, TX 77021
MLS# 88249074Listed by: ROOTS BROKERAGE $147,000Active3 beds 1 baths850 sq. ft.
5634 Schevers Street, Houston, TX 77033
MLS# 28192238Listed by: UP REALTY $242,500Active3 beds 2 baths1,388 sq. ft.
4218 Richmeadow Drive, Houston, TX 77048
MLS# 17525383Listed by: INTERO RIVER OAKS OFFICE $649,900Active5 beds 5 baths3,590 sq. ft.
21102 Chelton Beach Drive, Cypress, TX 77433
MLS# 95708561Listed by: COLDWELL BANKER REALTY - GREATER NORTHWEST $310,000Active3 beds 2 baths1,790 sq. ft.
5339 Basquiat Drive, Houston, TX 77048
MLS# 78388261Listed by: NEXT TREND REALTY LLC $300,000Active8 beds 4 baths1,350 sq. ft.
3804 Goodhope Street, Houston, TX 77021
MLS# 19262688Listed by: WALKER WATSON GROUP $75,000Active0.1 Acres
5004 Higgins Street, Houston, TX 77033
MLS# 76049645Listed by: KBH SIGNATURE REALTY GROUP $225,000Pending3 beds 1 baths1,288 sq. ft.
3408 Chaffin Street, Houston, TX 77087
MLS# 79234319Listed by: LUXURIOUS LIVING $354,990Active4 beds 3 baths2,040 sq. ft.
7210 England Street, Houston, TX 77021
MLS# 94904314Listed by: ROOTS BROKERAGE $248,000Pending3 beds 2 baths1,432 sq. ft.
6511 Wenlock Drive, Houston, TX 77048
MLS# 13510303Listed by: EXP REALTY LLC $149,900Active3 beds 1 baths1,293 sq. ft.
4306 Groton Drive, Houston, TX 77047
MLS# 81886349Listed by: MAINSTAY BROKERAGE, LLC $130,500Active3 beds 2 baths1,228 sq. ft.
5009 Bataan Road, Houston, TX 77033
MLS# 93570376Listed by: MAINSTAY BROKERAGE, LLC $120,000Active0.12 Acres
6629 Goforth Street, Houston, TX 77021
MLS# 97474984Listed by: IN HOUSE REALTY LLC $274,900Active3 beds 3 baths1,882 sq. ft.
13930 Enridge Lane, Houston, TX 77048
MLS# 97552712Listed by: RE/MAX GO $305,000Active3 beds 2 baths1,525 sq. ft.
5308 Cj Walker Lane, Houston, TX 77048
MLS# 9927277Listed by: KELLER WILLIAMS PREFERRED $80,000Active0.23 Acres
0 Santa Rosa Street, Houston, TX 77048
MLS# 96740606Listed by: WALZEL PROPERTIES - CORPORATE OFFICE $260,000Active4 beds 3 baths1,500 sq. ft.
6027 Kenilwood Drive, Houston, TX 77033
MLS# 11617515Listed by: KELLER WILLIAMS REALTY METROPOLITAN $79,000Active0.17 Acres
0 Anacortes Street, Houston, TX 77061
MLS# 40723968Listed by: RUTH LONGORIA, REALTORS $509,000Active3 beds 2 baths2,542 sq. ft.
6710 Kassarine Pass #A/B, Houston, TX 77033
MLS# 95585284Listed by: LPT REALTY, LLC $439,900Active3 beds 4 baths2,152 sq. ft.
5024 Winnetka Vista Street, Houston, TX 77021
MLS# 12768194Listed by: CB&A, REALTORS- LOOP CENTRAL $429,900Active3 beds 4 baths2,133 sq. ft.
5024 Winnetka Street #B, Houston, TX 77021
MLS# 24843983Listed by: CB&A, REALTORS- LOOP CENTRAL $564,900Active4 beds 5 baths4,298 sq. ft.
5215 Kelso Street, Houston, TX 77021
MLS# 58630699Listed by: J.D. RANKIN AND ASSOCIATES $429,900Active3 beds 4 baths2,133 sq. ft.
5024 Winnetka Street #C, Houston, TX 77021
MLS# 65343634Listed by: CB&A, REALTORS- LOOP CENTRAL $439,900Active8 beds 6 baths3,576 sq. ft.
3808 Dover Street, Houston, TX 77087
MLS# 73658543Listed by: JLA REALTY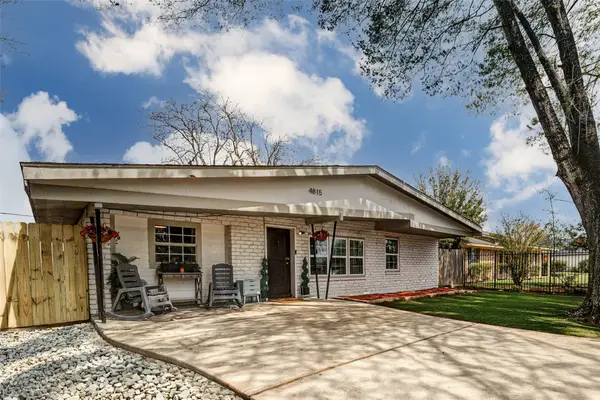 $219,990Active3 beds 2 baths1,484 sq. ft.
4815 Edfield Street, Houston, TX 77033
MLS# 61465430Listed by: LEGACY HOMES & PROPERTIES, LLC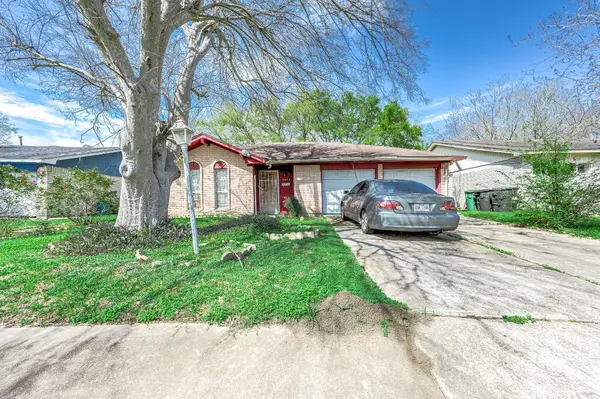 $110,000Pending3 beds 2 baths1,049 sq. ft.
5011 Brisbane Drive, Houston, TX 77048
MLS# 41138410Listed by: EXP REALTY LLC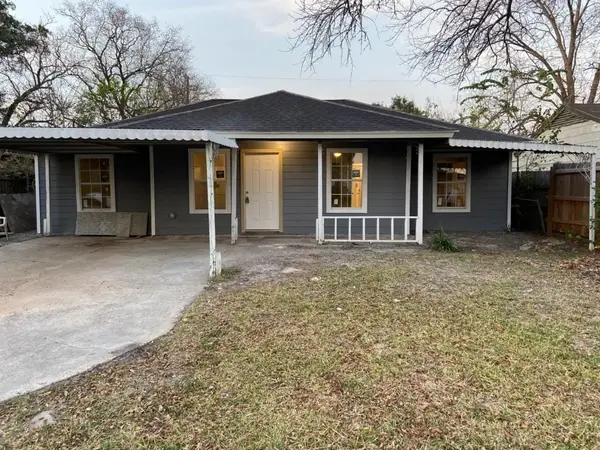 $189,000Active4 beds 2 baths1,259 sq. ft.
3031 Groton Drive, Houston, TX 77051
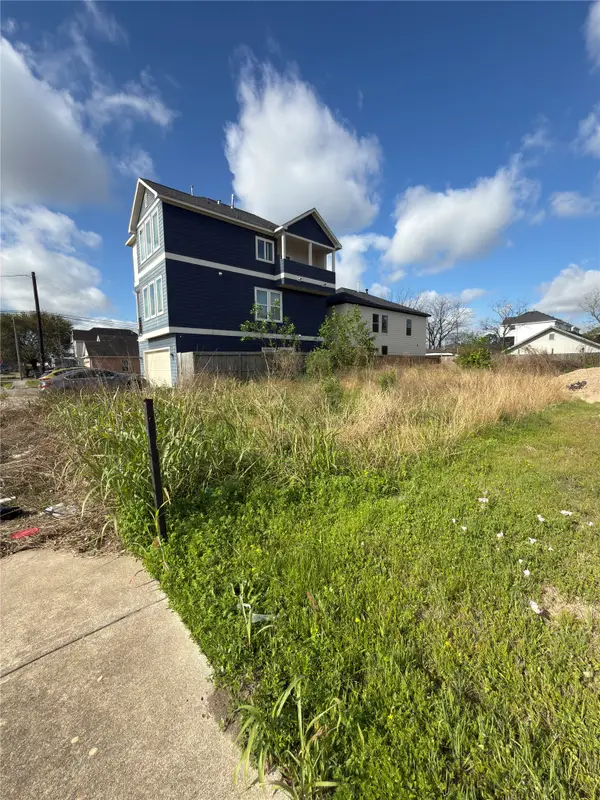
MLS# 52703790Listed by: FYI REALTY - KATY $625,000Active0.05 Acres
6710 Burkett Street, Houston, TX 77021
MLS# 95983975Listed by: CITIQUEST PROPERTIES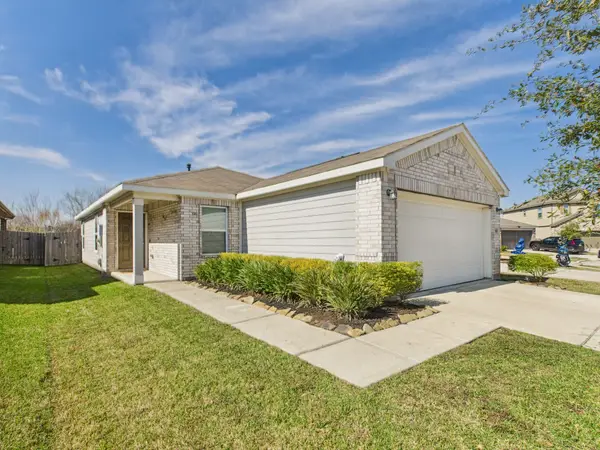 $239,999Pending3 beds 2 baths1,467 sq. ft.
11608 Moonstruck Lane, Houston, TX 77048
MLS# 21250220Listed by: NEXTGEN REAL ESTATE PROPERTIES $180,000Active4 beds 2 baths1,435 sq. ft.
10859 Fairland Drive, Houston, TX 77051
MLS# 19172505Listed by: SMALL REAL ESTATE GROUP, LLC $310,000Active4 beds 1 baths1,765 sq. ft.
5903 Belneath Street, Houston, TX 77033
MLS# 21317265Listed by: SIERRA VISTA REALTY LLC $475,000Active3 beds 2 baths1,319 sq. ft.
3808 Hiford Drive, Houston, TX 77047
MLS# 21731727Listed by: TAS REALTY GROUP $159,900Active3 beds 1 baths1,462 sq. ft.
5810 Flamingo Drive, Houston, TX 77033
MLS# 65835082Listed by: BEYCOME BROKERAGE REALTY, LLC $515,000Active3 beds 1 baths2,819 sq. ft.
4624 Mayflower Street #A/B, Houston, TX 77033
MLS# 67125837Listed by: NEXTGEN REAL ESTATE PROPERTIES $245,000Active4 beds 2 baths1,248 sq. ft.
4942 Bataan Road, Houston, TX 77033
MLS# 86077926Listed by: WOMACK DEVELOPMENT & INVESTMENT REALTORS $240,000Active4 beds 2 baths1,367 sq. ft.
3026 Sunbeam Street, Houston, TX 77051
MLS# 92417981Listed by: SIERRA VISTA REALTY LLC $175,000Active0.24 Acres
5102 Dieppe Street, Houston, TX 77033
MLS# 21296055Listed by: KELLER WILLIAMS REALTY PROFESSIONALS $125,000Active0.13 Acres
8010 Cannon Street, Houston, TX 77051
MLS# 80076206Listed by: KELLER WILLIAMS REALTY PROFESSIONALS $185,000Active4 beds 2 baths1,350 sq. ft.
11014 Segrest Drive, Houston, TX 77047
MLS# 10485731Listed by: BARGER CAPITAL REALTY PLLC $185,000Active3 beds 2 baths1,610 sq. ft.
4905 Brinkley Street, Houston, TX 77033
MLS# 27455772Listed by: FYI REALTY - KATY $99,999Active0.15 Acres
9030 Scott Street, Houston, TX 77051
MLS# 66351278Listed by: LOGOS INVESTMENT PROPERTIES & REAL ESTATE $330,000Active3 beds 3 baths2,062 sq. ft.
2934 Concord Village Way, Houston, TX 77051
MLS# 87261707Listed by: AEA REALTY, LLC $180,000Active4 beds 2 baths1,593 sq. ft.
12911 Scott Street, Houston, TX 77047
MLS# 16126819Listed by: KINGFAY INC $240,000Active4 beds 2 baths792 sq. ft.
9429 Fairland Drive, Houston, TX 77051
MLS# 24154889Listed by: SIERRA VISTA REALTY LLC $275,000Active4 beds 2 baths1,664 sq. ft.
7326 Thurow Street, Houston, TX 77087
MLS# 28906119Listed by: METROPLUS REALTY $269,900Active4 beds 3 baths1,634 sq. ft.
10622 Cashew Run Lane, Houston, TX 77075
MLS# 39432651Listed by: WINHILL ADVISORS - KIRBY $179,000Active3 beds 2 baths1,326 sq. ft.
4307 Friar Point Road, Houston, TX 77047
MLS# 43110690Listed by: EVAN S. HOWELL, INC. $320,000Active4 beds 3 baths1,967 sq. ft.
4617 White Rock Street, Houston, TX 77051
MLS# 10748456Listed by: KOBANK HOMES $570,000Active-- beds -- baths3,140 sq. ft.
7118 Eastwood Street, Houston, TX 77021
MLS# 31530904Listed by: PAK HOME REALTY NORTH WEST $219,900Active3 beds 2 baths1,344 sq. ft.
5003 Denoron Drive, Houston, TX 77048
MLS# 37629167Listed by: REALTY USA $43,000Pending0.16 Acres
13811 Mary Kay Lane, Houston, TX 77048
MLS# 39396380Listed by: CORCORAN PRESTIGE REALTY $525,000Pending3 beds 3 baths1,505 sq. ft.
5903 Doolittle Blvd, Houston, TX 77033
MLS# 5109121Listed by: KELLER WILLIAMS SIGNATURE $160,000Active2 beds 1 baths1,711 sq. ft.
3827 Erby Street, Houston, TX 77023
MLS# 67754703Listed by: KELLER WILLIAMS PREFERRED $260,000Active3 beds 3 baths1,453 sq. ft.
6406 Calhoun Road, Houston, TX 77021
MLS# 61784375Listed by: EXP REALTY LLC $222,500Active3 beds 3 baths1,089 sq. ft.
6426 Calhoun Road, Houston, TX 77021
MLS# 8179951Listed by: EXP REALTY LLC $45,000Active0.09 Acres
12523 Alamo Street, Houston, TX 77048
MLS# 26273518Listed by: TUXOR REALTY $209,000Active3 beds 2 baths1,485 sq. ft.
5879 Belcrest Street, Houston, TX 77033
MLS# 16002508Listed by: KELLER WILLIAMS HOUSTON CENTRAL $545,000Active3 beds 3 baths3,140 sq. ft.
5642 Hirondel Street, Houston, TX 77033
MLS# 42099938Listed by: RE/MAX UNIVERSAL $2,100,000Active2.5 Acres
13921 Old Chocolate Bayou Road, Houston, TX 77048
MLS# 71849500Listed by: BRECKER REALTY, LLC $247,999Pending3 beds 2 baths1,403 sq. ft.
7310 Arnim Street, Houston, TX 77087
MLS# 22010779Listed by: WORD REALTY $220,000Active3 beds 2 baths1,240 sq. ft.
5646 Belmark Street, Houston, TX 77033
MLS# 26665589Listed by: JASON MITCHELL REAL ESTATE LLC $265,000Active2 beds 1 baths1,632 sq. ft.
6109 Hertford Street, Houston, TX 77048
MLS# 2933573Listed by: TEXAS ALLY REAL ESTATE GROUP, LLC $595,000Active3 beds 2 baths1,272 sq. ft.
6004 Bois D Arc Street, Houston, TX 77087
MLS# 38576425Listed by: PEEK REALTY & PROPERTY MGMT $225,000Active3 beds 2 baths1,266 sq. ft.
6801 Kassarine Pass, Houston, TX 77033
MLS# 40657801Listed by: NEXT TREND REALTY LLC $168,000Active2 beds 2 baths1,030 sq. ft.
5941 South Loop E #503, Houston, TX 77033
MLS# 37145725Listed by: ABSOLUTE REALTY GROUP INC.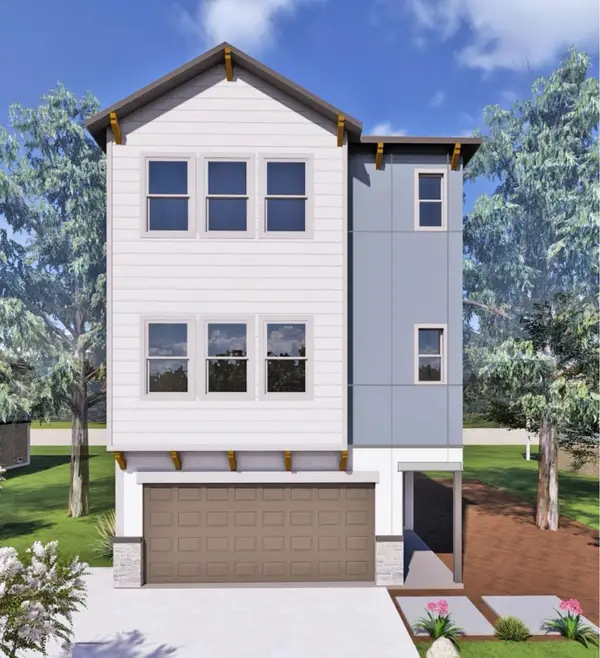 $559,888Active4 beds 4 baths2,609 sq. ft.
12502 Osceola Court, Houston, TX 77047
MLS# 14442409Listed by: SKW REALTY $249,000Active2 beds 1 baths976 sq. ft.
10424 Ballantine Street, Houston, TX 77075
MLS# 17919203Listed by: REIMAGE PROPERTIES & INVESTMENTS, LLC. $349,000Active3 beds 3 baths1,944 sq. ft.
7230 Sims Drive, Houston, TX 77061
MLS# 82190773Listed by: COLDWELL BANKER UNIVERSAL $130,000Active2 beds 1 baths810 sq. ft.
2715 Oakcliff Street, Houston, TX 77023
MLS# 82651329Listed by: SIERRA VISTA REALTY LLC $198,000Active3 beds 2 baths1,470 sq. ft.
12935 Southspring Drive, Houston, TX 77047
MLS# 49297322Listed by: REALM REAL ESTATE PROFESSIONALS - WEST HOUSTON $600,000Active4 beds 3 baths2,695 sq. ft.
9411 Coleraine Court, Tomball, TX 77375
MLS# 36090316Listed by: ZARCO PROPERTIES, LLC $325,000Active4 beds 2 baths1,730 sq. ft.
2830 Chancery Summit Court, Houston, TX 77047
MLS# 93577369Listed by: KELLER WILLIAMS MEMORIAL $359,800Active3 beds 4 baths2,018 sq. ft.
3735 Lydia Street, Houston, TX 77021
MLS# 27842855Listed by: HAPPEN HOUSTON $364,800Active3 beds 4 baths2,012 sq. ft.
3617A Mt Pleasant Street, Houston, TX 77021
MLS# 98710001Listed by: HAPPEN HOUSTON $319,990Active3 beds 2 baths1,690 sq. ft.
12812 Tokenhouse Lane, Houston, TX 77047
MLS# 64186311Listed by: CB&A, REALTORS- SOUTHEAST $695,000Active6 beds 6 baths2,998 sq. ft.
5226 Ricky Street, Houston, TX 77033
MLS# 12351126Listed by: MIH REALTY, LLC $339,990Active4 beds 3 baths2,017 sq. ft.
2628 Afton Heights Way, Houston, TX 77051
MLS# 14211726Listed by: EXCLUSIVE PRIME REALTY, LLC $212,000Active3 beds 2 baths1,168 sq. ft.
4516 Normandy Way, Houston, TX 77021
MLS# 34069656Listed by: NORLUXE REALTY HOUSTON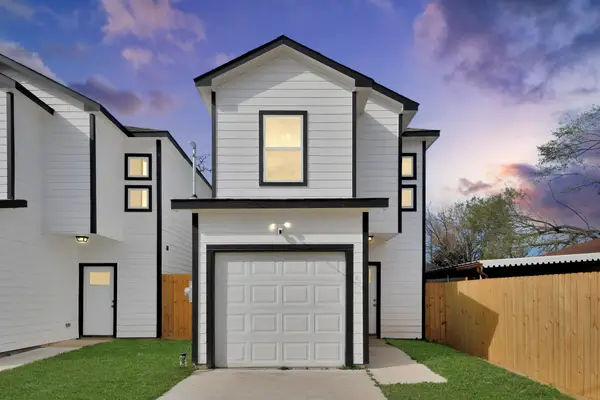 $265,900Active3 beds 3 baths1,773 sq. ft.
4013 Elmwood Street, Houston, TX 77051
MLS# 39269458Listed by: PREMIER HAUS REALTY, LLC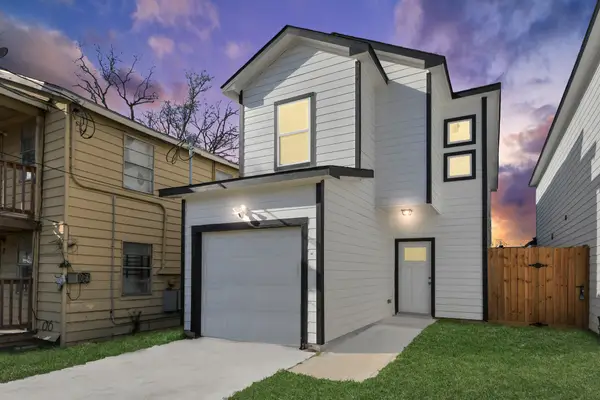 $265,900Active3 beds 3 baths1,773 sq. ft.
4011 Elmwood Street, Houston, TX 77051
MLS# 68341340Listed by: PREMIER HAUS REALTY, LLC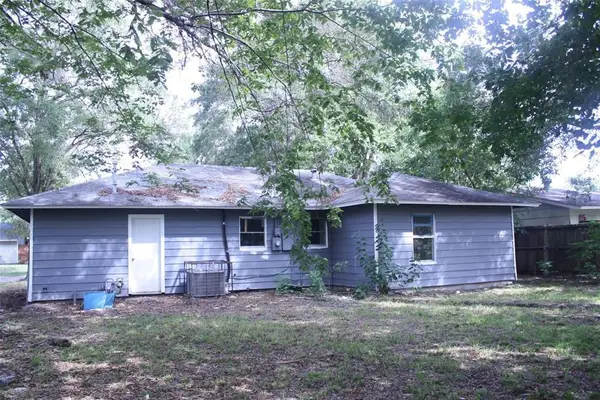 $167,000Active4 beds 2 baths1,200 sq. ft.
5818 Westover Street, Houston, TX 77033
MLS# 16342262Listed by: FYI REALTY - KATY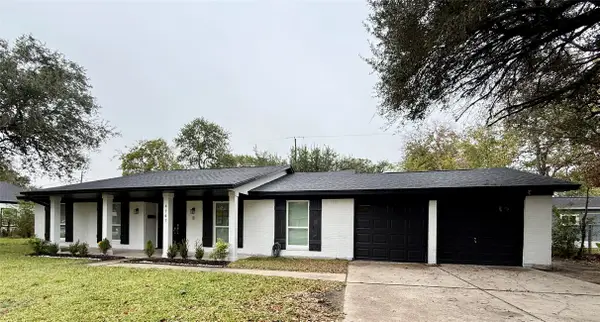 $247,500Active3 beds 2 baths1,851 sq. ft.
4747 Clover Street, Houston, TX 77033
MLS# 21467391Listed by: KEI REALTY SOLUTIONS LLC. $1,125,000Active4.31 Acres
5609 Almeda Genoa Road, Houston, TX 77048
MLS# 57865682Listed by: EXP REALTY LLC $324,900Active2 beds 1 baths1,800 sq. ft.
8424 Cannon Street, Houston, TX 77051
MLS# 84859154Listed by: REAL PROPERTY MANAGEMENT PRESTIGE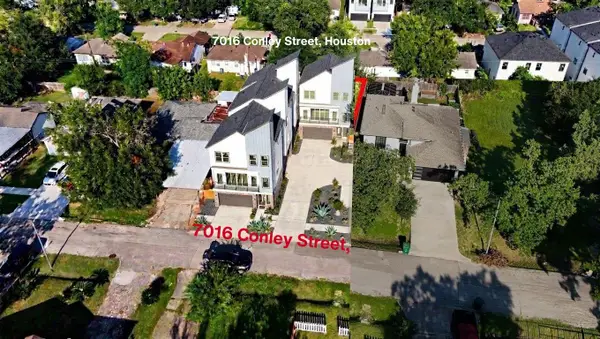 $189,900Active0.12 Acres
7016 Conley Street, Houston, TX 77021
MLS# 9305616Listed by: KELLER WILLIAMS SIGNATURE $189,000Active4 beds 2 baths2,925 sq. ft.
3147 Golfcrest Boulevard, Houston, TX 77087
MLS# 28724517Listed by: SIERRA VISTA REALTY LLC $674,900Active6 beds 6 baths3,610 sq. ft.
4746 S Mallow Street E, Houston, TX 77033
MLS# 37773920Listed by: KIANI REALTY $200,000Active3 beds 2 baths1,082 sq. ft.
11502 Fawnway Dr, Houston, TX 77048
MLS# 45605700Listed by: GO REAL ESTATE $168,900Active3 beds 1 baths1,420 sq. ft.
4509 Kingsbury Street, Houston, TX 77021
MLS# 4969617Listed by: CB&A, REALTORS $2,250,000Active3.89 Acres
10717 Cullen Boulevard, Houston, TX 77047
MLS# 42000406Listed by: COLDWELL BANKER REALTY - KATY $119,500Active0.13 Acres
4810 Lingonberry Street, Houston, TX 77033
MLS# 40866892Listed by: ROOTS BROKERAGE $398,500Pending4 beds 3 baths2,504 sq. ft.
8202 Glencrest Street, Houston, TX 77061
MLS# 62924008Listed by: CENTRAL METRO REALTY $299,900Active3 beds 2 baths1,690 sq. ft.
12820 Harlesden Lane, Houston, TX 77047
MLS# 35790237Listed by: TEXAS HOME SHOP REALTY $189,000Active2 beds 1 baths819 sq. ft.
5707 Waltrip Street, Houston, TX 77087
MLS# 36850532Listed by: KELLER WILLIAMS REALTY PROFESSIONALS $269,000Active4 beds 2 baths1,461 sq. ft.
3838 Daphne Street, Houston, TX 77021
MLS# 44439384Listed by: HOMESMART $205,840Active2 beds 2 baths1,108 sq. ft.
7543 Greenstone Street, Houston, TX 77087
MLS# 92005693Listed by: METROPLUS REALTY $185,000Pending3 beds 2 baths1,690 sq. ft.
8307 Coastway Lane, Houston, TX 77075
MLS# 64249712Listed by: REALTY KINGS PROPERTIES $813,495Active-- beds -- baths
4609 Bricker Street #A B C, Houston, TX 77051
MLS# 84780704Listed by: NEXTGEN REAL ESTATE PROPERTIES $130,000Active3 beds 1 baths978 sq. ft.
5223 Grace Point Lane, Houston, TX 77048
MLS# 22898473Listed by: ORCHARD BROKERAGE $367,999Active2 beds 3 baths1,775 sq. ft.
11408 Lucky Falls Drive, Houston, TX 77047
MLS# 42426196Listed by: K. HOVNANIAN HOMES $180,000Active0.17 Acres
3511 Corder Street, Houston, TX 77021
MLS# 58182806Listed by: DJ REALTY, LLC $285,000Active0.92 Acres
00 Fuqua Street, Houston, TX 77075
MLS# 68141953Listed by: PLATINUM 1 PROPERTIES, LLC $199,900Pending3 beds 2 baths2,089 sq. ft.
8103 Glen Vista Street, Houston, TX 77061
MLS# 24973996Listed by: J.D. RANKIN AND ASSOCIATES $49,000Active0.04 Acres
10126 Ricky Street, Houston, TX 77033
MLS# 51884297Listed by: COLDWELL BANKER REALTY - KATY $35,000Active0.03 Acres
10130 Ricky Street, Houston, TX 77033
MLS# 81254450Listed by: COLDWELL BANKER REALTY - KATY $79,900Active0 Acres
6214 Grosbeck Drive, Houston, TX 77048
MLS# 17099287Listed by: REALTY WORLD HOMES & ESTATES $210,000Active3 beds 2 baths1,258 sq. ft.
4918 Carmen Street, Houston, TX 77033
MLS# 19277657Listed by: ANGEL PRO REAL ESTATE LLC $174,000Active4 beds 2 baths1,600 sq. ft.
5431 Willow Glen Drive, Houston, TX 77033
MLS# 14351975Listed by: FYI REALTY - KATY
Local realty services provided by:CENTURY 21 Lucky Money Real Estate
Copyright 2026, Houston Realtors Information Service, Inc. All information provided is deemed reliable but is not guaranteed and should be independently verified. IDX information is provided exclusively for consumers' personal, non-commercial use, it may not be used for any purpose other than to identify prospective properties consumers may be interested in purchasing, and the data is deemed reliable but is not guaranteed accurate by the MLS.
Popular neighborhoods near Southeast Houston, Houston, TX
Zip codes near Southeast Houston, Houston, TX
- 77003 homes for sale
- 77004 homes for sale
- 77006 homes for sale
- 77011 homes for sale
- 77012 homes for sale
- 77017 homes for sale
- 77021 homes for sale
- 77023 homes for sale
- 77025 homes for sale
- 77030 homes for sale
- 77033 homes for sale
- 77045 homes for sale
- 77047 homes for sale
- 77048 homes for sale
- 77051 homes for sale
- 77054 homes for sale
- 77061 homes for sale
- 77075 homes for sale
- 77087 homes for sale
- 77587 homes for sale
Counties near Southeast Houston, Houston, TX
- Austin County homes for sale
- Brazoria County homes for sale
- Chambers County homes for sale
- Colorado County homes for sale
- Fort Bend County homes for sale
- Galveston County homes for sale
- Grimes County homes for sale
- Hardin County homes for sale
- Harris County homes for sale
- Jackson County homes for sale
- Jefferson County homes for sale
- Liberty County homes for sale
- Matagorda County homes for sale
- Montgomery County homes for sale
- Polk County homes for sale
- San Jacinto County homes for sale
- Walker County homes for sale
- Waller County homes for sale
- Washington County homes for sale
- Wharton County homes for sale
Protect your home and budget from life's surprises with an Assurant Home Warranty, backed by a partner that supports you through every step of homeownership. Explore Plans.
©2026 Century 21 Real Estate LLC. All rights reserved. CENTURY 21®, the CENTURY 21 Logo and C21® are service marks owned by Century 21 Real Estate LLC. Century 21 Real Estate LLC fully supports the principles of the Fair Housing Act and the Equal Opportunity Act. Each office is independently owned and operated. Listing information is deemed reliable but not guaranteed accurate.