- Ardsley, Ardsley homes for sale
- Briarcliff Manor, Hawthorne homes for sale
- Dobbs Ferry, Dobbs Ferry homes for sale
- Elmsford, Elmsford homes for sale
- Fanley Woods, Spring Valley homes for sale
- Greenville, Scarsdale homes for sale
- Harbors at Haverstraw, Haverstraw homes for sale
- Hartsdale, Hartsdale homes for sale
- Hastings-on-Hudson, Hastings On Hudson homes for sale
- Homecrest, Yonkers homes for sale
- Homefield, Yonkers homes for sale
- Irvington, Irvington homes for sale
- Lamartine Heights, Yonkers homes for sale
- Monastery Heights, Yonkers homes for sale
- Nepera Park, Yonkers homes for sale
- Pleasantville, Pleasantville homes for sale
- Riverside, Paterson homes for sale
- Tarrytown, Tarrytown homes for sale
- Valhalla, Valhalla homes for sale
- Woodstock Manor, Yonkers homes for sale
Spring Valley, NY - homes for sale
6 of 6 results displayed
- New
 $1,800,000Active6 beds 2 baths
31-33 Gerow Avenue, Spring Valley, NY 10977
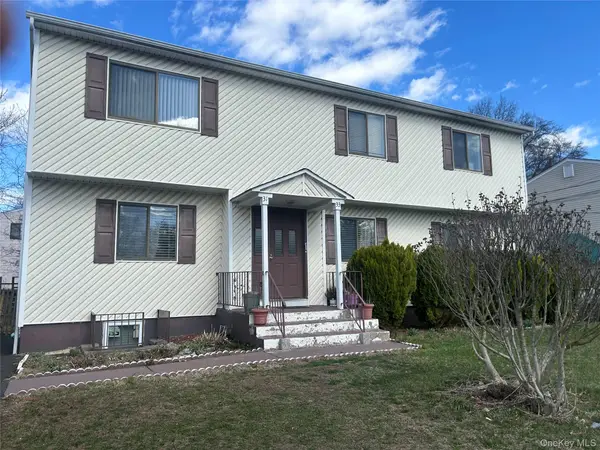
MLS# 971698Listed by: WEICHERT REALTORS 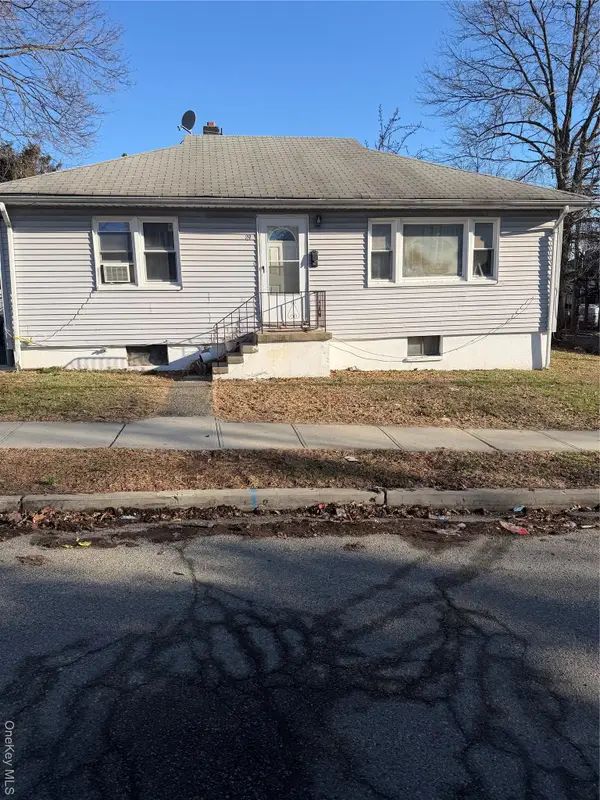 $1,800,000Active5 beds 3 baths2,128 sq. ft.
29 E Castle Avenue, Spring Valley, NY 10977
MLS# 971765Listed by: WEICHERT REALTORS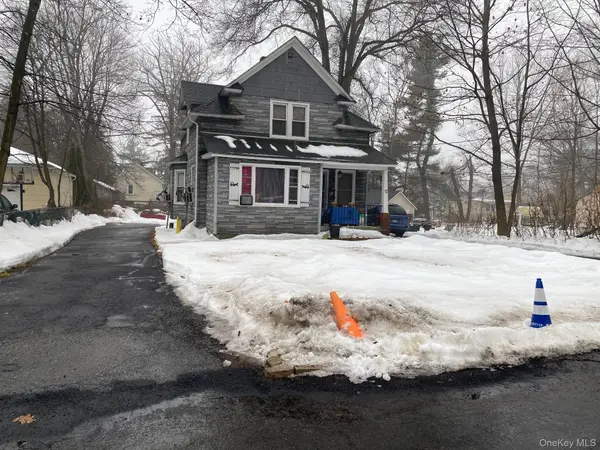 $599,000Pending4 beds 3 baths1,510 sq. ft.
10 Bird Place, Spring Valley, NY 10977
MLS# 962714Listed by: Q HOME SALES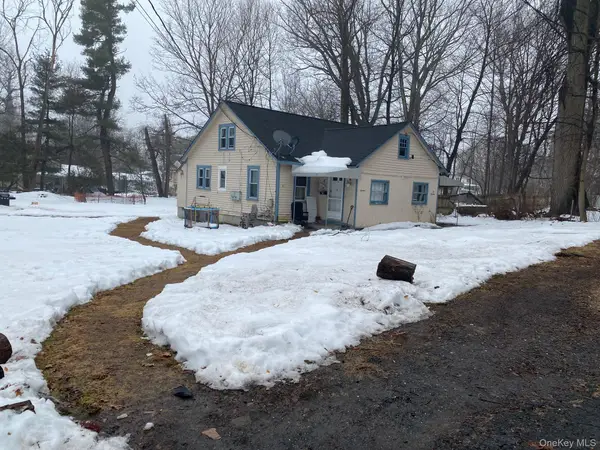 $799,000Pending3 beds 4 baths1,421 sq. ft.
12 Bird Place, Spring Valley, NY 10977
MLS# 962717Listed by: Q HOME SALES $1,850,000Active5 beds 3 baths
3 Stonehouse Drive, Spring Valley, NY 10977
MLS# 967876Listed by: Q HOME SALES $1,900,000Active6 beds 3 baths2,100 sq. ft.
3 S Myrtle Avenue, Spring Valley, NY 10977
MLS# 922859Listed by: WEICHERT REALTORS
Local realty services provided by:CENTURY 21 AllPoints Realty
Neighborhoods near Spring Valley, NY
Zip codes near Spring Valley, NY
- 07458 homes for sale
- 07645 homes for sale
- 07656 homes for sale
- 07677 homes for sale
- 10901 homes for sale
- 10913 homes for sale
- 10920 homes for sale
- 10923 homes for sale
- 10927 homes for sale
- 10931 homes for sale
- 10952 homes for sale
- 10954 homes for sale
- 10956 homes for sale
- 10960 homes for sale
- 10965 homes for sale
- 10970 homes for sale
- 10977 homes for sale
- 10984 homes for sale
- 10989 homes for sale
- 10994 homes for sale
Popular searches near Spring Valley, NY
- Airmont homes for sale
- Bardonia homes for sale
- Chestnut Ridge homes for sale
- Clarkstown homes for sale
- Hillcrest homes for sale
- Monsey homes for sale
- Montebello homes for sale
- Montvale homes for sale
- Nanuet homes for sale
- New City homes for sale
- New Hempstead homes for sale
- Pearl River homes for sale
- Pomona homes for sale
- Ramapo homes for sale
- Suffern homes for sale
- Upper Saddle River homes for sale
- Valley Cottage homes for sale
- Viola homes for sale
- Wesley Hills homes for sale
- West Nyack homes for sale
Protect your home and budget from life's surprises with an Assurant Home Warranty, backed by a partner that supports you through every step of homeownership. Explore Plans.
©2026 Century 21 Real Estate LLC. All rights reserved. CENTURY 21®, the CENTURY 21 Logo and C21® are service marks owned by Century 21 Real Estate LLC. Century 21 Real Estate LLC fully supports the principles of the Fair Housing Act and the Equal Opportunity Act. Each office is independently owned and operated. Listing information is deemed reliable but not guaranteed accurate.