- Bear Canyon, Tucson properties for sale
- Broadway Pantano East, Tucson properties for sale
- Carson Corner, Tucson properties for sale
- Civano, Tucson properties for sale
- Dietz, Tucson properties for sale
- Eastside, Tucson properties for sale
- Groves Lincoln Park, Tucson properties for sale
- Houghton, Tucson properties for sale
- La Estancia de Tucson, Tucson properties for sale
- Lakeside Park, Tucson properties for sale
- New Tucson, Vail properties for sale
- Old Spanish Trail, Tucson properties for sale
- Rincon Trails, Vail properties for sale
- Rita Ranch, Tucson properties for sale
- Rolling Hills, Tucson properties for sale
- Rolling Hills Country Club Estates, Tucson properties for sale
- Sherwood Village Terrace, Tucson properties for sale
- South Harrison, Tucson properties for sale
- Sycamore Park, Tucson properties for sale
- Valley View East, Tucson properties for sale
St David, AZ - homes for sale
23 of 23 results displayed
- New
 $45,000Active3 beds 2 baths800 sq. ft.
274 W Rose Street, St. David, AZ 85630
MLS# 22531374Listed by: MARIPOSA REALTY LLC  $375,000Active3 beds 3 baths1,989 sq. ft.
411 N Busby Place, St. David, AZ 85630
MLS# 22530966Listed by: LONG REALTY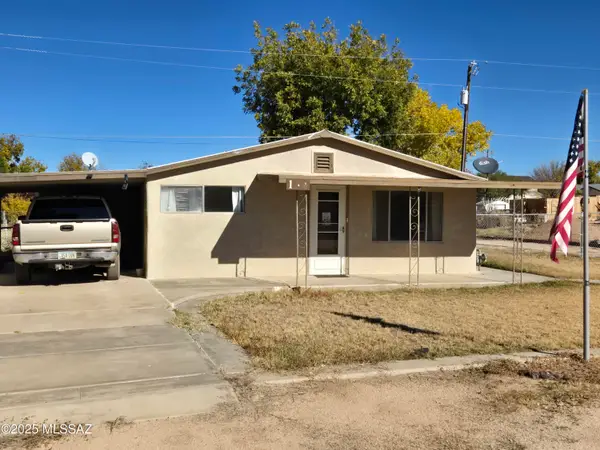 $180,000Active3 beds 2 baths1,845 sq. ft.
134 E Patton Street, St. David, AZ 85630
MLS# 22530917Listed by: EXP REALTY $269,900Active4 beds 2 baths1,600 sq. ft.
467 E Griest Lane, St. David, AZ 85630
MLS# 22529666Listed by: HAYMORE REAL ESTATE, LLC $475,000Active5 beds 3 baths2,476 sq. ft.
327 W Corral Drive, St. David, AZ 85630
MLS# 22528748Listed by: DIPESO REALTY $49,900Pending2 beds 2 baths980 sq. ft.
1024 S Yucca Street, St. David, AZ 85630
MLS# 22528539Listed by: GLENN REALTY, LLC $435,000Active3 beds 2 baths1,844 sq. ft.
1275 S Lee Street, St. David, AZ 85630
MLS# 22526965Listed by: ENGEL & VOLKERS TUCSON $79,000Active5.32 Acres
TBD N Sibyl Road #TBD, St. David, AZ 85630
MLS# 22525769Listed by: MARIPOSA REALTY LLC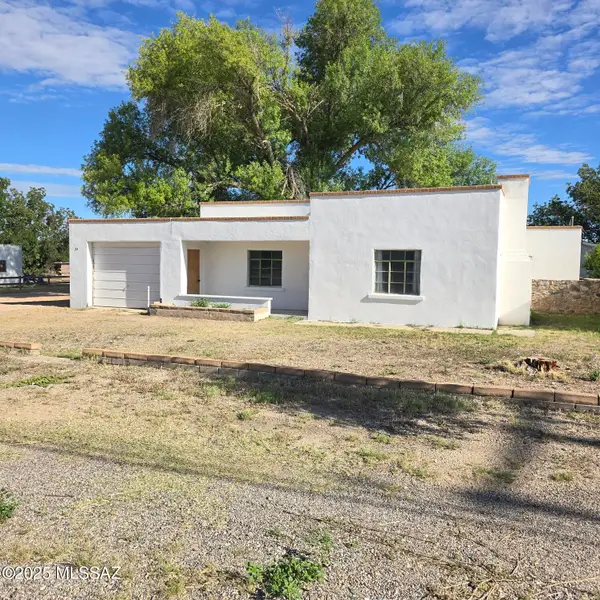 $139,900Active3 beds 2 baths1,447 sq. ft.
24 W Patton Street, St. David, AZ 85630
MLS# 22522919Listed by: DIPESO REALTY $61,000Active3 beds 2 baths750 sq. ft.
471 E Medicare Street, Saint David, AZ 85630
MLS# 6901303Listed by: REAL BROKER $30,000Active0.5 Acres
53 S Miller Lane, St. David, AZ 85630
MLS# 22518702Listed by: DIPESO REALTY $95,000Active16 Acres
S Quail Call St 16 Acres #1, St. David, AZ 85630
MLS# 22518278Listed by: HARTMANN COMMERCIAL REAL ESTATE LLC $525,000Active2 beds 1 baths2,031 sq. ft.
2045 S Lee Street, St. David, AZ 85630
MLS# 22515655Listed by: DIPESO REALTY $49,999Active12.14 Acres
TBD Jacobs Road, St. David, AZ 85630
MLS# 22515617Listed by: HAYMORE REAL ESTATE, LLC $359,900Active3 beds 3 baths1,969 sq. ft.
419 N Miller Lane, St. David, AZ 85630
MLS# 22528578Listed by: HAYMORE REAL ESTATE, LLC $55,000Active1.09 Acres
TBD Crescent Road, St. David, AZ 85630
MLS# 22507296Listed by: TIERRA ANTIGUA REALTY $159,500Active5.2 Acres
5ac S Ewing Street, St. David, AZ 85630
MLS# 22523712Listed by: HAYMORE REAL ESTATE, LLC $815,580Active45 Acres
S Hwy 80 Kartchner Lookout #1, St. David, AZ 85630
MLS# 22500532Listed by: HARTMANN COMMERCIAL REAL ESTATE LLC $115,000Active3.43 Acres
000 S Ewing Street, Saint David, AZ 85630
MLS# 6786251Listed by: TIERRA ANTIGUA REALTY, LLC $197,500Active44.08 Acres
44.08 Acre Escalante Road, St. David, AZ 85630
MLS# 22427973Listed by: GLENN REALTY, LLC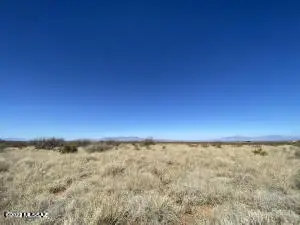 $63,000Active36.07 Acres
Tbd 130 #130, St. David, AZ 85630
MLS# 22314630Listed by: KELLER WILLIAMS SOUTHERN ARIZONA $2,895,000Active4 beds 5 baths4,386 sq. ft.
18 E Heron Place, Saint David, AZ 85630
MLS# 6358785Listed by: BERKSHIRE HATHAWAY HOMESERVICES ARIZONA PROPERTIES $1,250,000Active100 Acres
S Highway 80 Escalante Crossing, St. David, AZ 85630
MLS# 22223272Listed by: HARTMANN COMMERCIAL REAL ESTATE LLC
Local realty services provided by:CENTURY 21 Success Realty, CENTURY 21 Arizona West
The data relating to real estate listings on this website comes in part from the Internet Data Exchange (IDX) program of Multiple Listing Service of Southern Arizona. IDX information is provided exclusively for consumers' personal, non-commercial use and may not be used for any purpose other than to identify prospective properties consumers may be interested in purchasing. Listings provided by brokerages other than CENTURY 21 Success Realty are identified with the MLSSAZ IDX Logo. All information is deemed reliable but is not guaranteed accurate. Listing information Copyright 2025 MLS of Southern Arizona. All Rights Reserved.
Neighborhoods near St David, AZ
Zip codes near St David, AZ
- 85602 properties for sale
- 85603 properties for sale
- 85606 properties for sale
- 85609 properties for sale
- 85610 properties for sale
- 85611 properties for sale
- 85615 properties for sale
- 85616 properties for sale
- 85617 properties for sale
- 85624 properties for sale
- 85630 properties for sale
- 85635 properties for sale
- 85637 properties for sale
- 85638 properties for sale
- 85641 properties for sale
- 85643 properties for sale
- 85650 properties for sale
- 85730 properties for sale
- 85747 properties for sale
- 85748 properties for sale
Popular searches near St David, AZ
- Benson properties for sale
- Cochise properties for sale
- Corona De Tucson properties for sale
- Dragoon properties for sale
- Elfrida properties for sale
- Elgin properties for sale
- Hereford properties for sale
- Huachuca City properties for sale
- J - Six Ranchettes properties for sale
- Mescal properties for sale
- Rincon Valley properties for sale
- Sierra Vista properties for sale
- Sierra Vista Southeast properties for sale
- Sonoita properties for sale
- Sunizona properties for sale
- Sunsites properties for sale
- Tombstone properties for sale
- Vail properties for sale
- Whetstone properties for sale
- Willcox properties for sale
©2025 Century 21 Real Estate LLC. All rights reserved. CENTURY 21®, the CENTURY 21 Logo and C21® are service marks owned by Century 21 Real Estate LLC. Century 21 Real Estate LLC fully supports the principles of the Fair Housing Act and the Equal Opportunity Act. Each office is independently owned and operated. Listing information is deemed reliable but not guaranteed accurate.
©2025 Century 21 Real Estate LLC. All rights reserved. CENTURY 21®, the CENTURY 21 Logo and C21® are service marks owned by Century 21 Real Estate LLC. Century 21 Real Estate LLC fully supports the principles of the Fair Housing Act and the Equal Opportunity Act. Each office is independently owned and operated. Listing information is deemed reliable but not guaranteed accurate.