- Alma homes for sale
- Arcada homes for sale
- Breckenridge homes for sale
- Chippewa homes for sale
- Coe homes for sale
- Elwell homes for sale
- Greendale homes for sale
- Ithaca homes for sale
- Jasper homes for sale
- Jonesfield homes for sale
- Lafayette homes for sale
- Lee homes for sale
- Lincoln homes for sale
- Merrill homes for sale
- Pine River homes for sale
- St. Louis homes for sale
- Seville homes for sale
- Shepherd homes for sale
- Sumner Township homes for sale
- Wheeler Township homes for sale
48880, MI - homes for sale
24 of 24 results displayed
- New
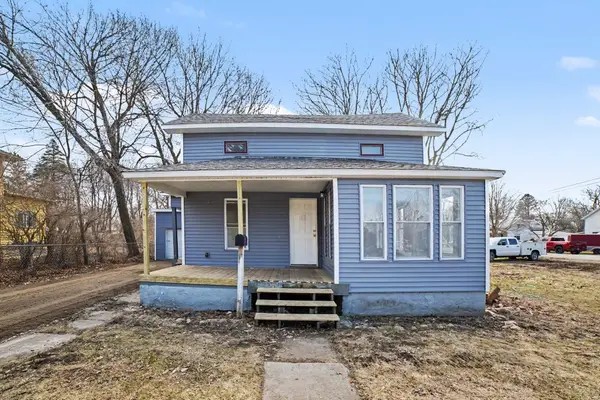 $135,000Active3 beds 1 baths1,374 sq. ft.
419 W Washington, StLouis, MI 48880
MLS# 79080066387Listed by: KELLER WILLIAMS OF NM SIGNATURE GROUP
- New
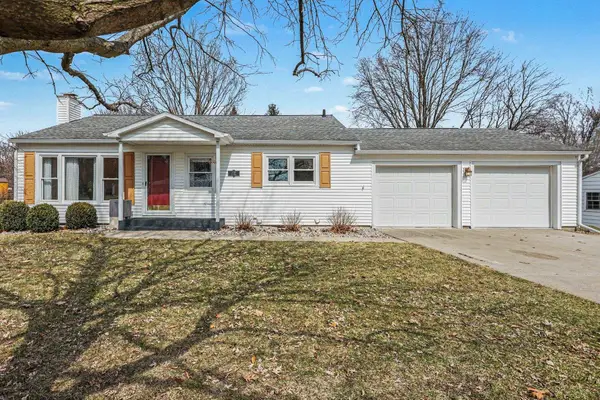 $227,000Active3 beds 2 baths2,264 sq. ft.
137 Fox, StLouis, MI 48880
MLS# 79080066363Listed by: CENTURY 21 LEE-MAC REALTY - New
 $219,000Active3 beds 2 baths1,647 sq. ft.
3949 S Alamando, Saint Louis, MI 48880
MLS# 80066270Listed by: AMERICA'S CHOICE REALTY LLC  $244,900Active3 beds 2 baths1,500 sq. ft.
139 W Essex Drive, Saint Louis, MI 48880
MLS# 50201527Listed by: BERKSHIRE HATHAWAY HOMESERVICES, BAY CITY $59,500Active4 beds 2 baths2,117 sq. ft.
108 S Pine, Saint Louis, MI 48880
MLS# 80066084Listed by: 411 REALTY $219,043Active3 beds 2 baths1,344 sq. ft.
10613 N Bagley, Saint Louis, MI 48880
MLS# 80065966Listed by: 43 NORTH REALTY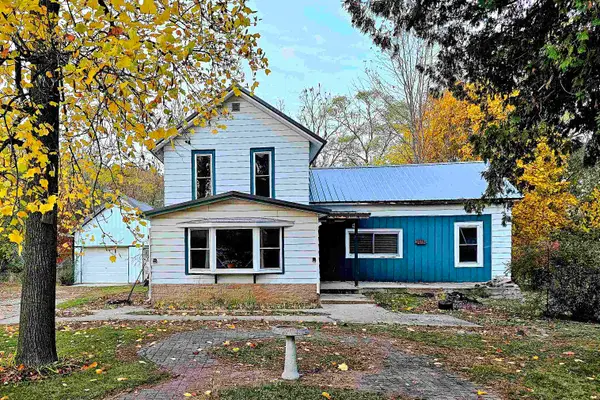 $120,000Active3 beds 2 baths1,328 sq. ft.
602 Olive, Saint Louis, MI 48880
MLS# 80065915Listed by: 43 NORTH REALTY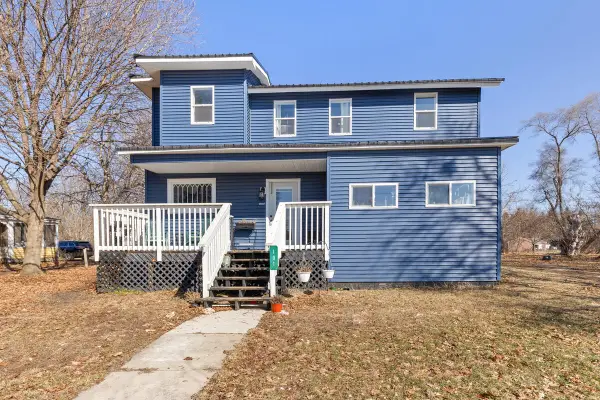 $264,900Active4 beds 2 baths2,378 sq. ft.
101 River Court, St. Louis, MI 48880
MLS# 26008230Listed by: FELDE REALTY $125,000Active4 beds 2 baths1,839 sq. ft.
214 S Pine, Saint Louis, MI 48880
MLS# 80065848Listed by: 43 NORTH REALTY $300,000Active84.59 Acres
3772 Jasper, Saint Louis, MI 48880
MLS# 50199864Listed by: KW PROFESSIONALS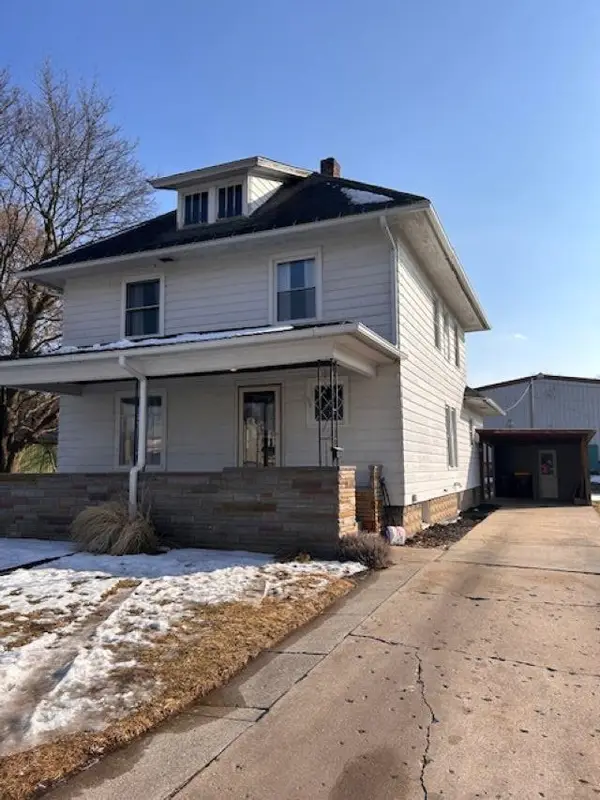 $150,000Active4 beds 2 baths1,997 sq. ft.
109 W Tyrell, Saint Louis, MI 48880
MLS# 80065482Listed by: RESULTS REALTY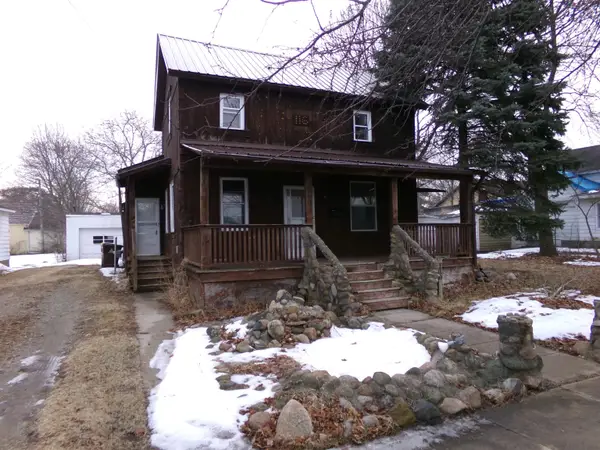 $115,000Active3 beds 1 baths1,288 sq. ft.
116 N Main, Saint Louis, MI 48880
MLS# 80065454Listed by: KELLER WILLIAMS OF NM SIGNATURE GROUP $15,000Active0.65 Acres
00 V/L Essex, Update, MI 48880
MLS# 70511062Listed by: RE/MAX REAL ESTATE PROFESSIONALS $129,000Active-- beds -- baths1,100 sq. ft.
221 North, StLouis, MI 48880
MLS# 79080059109Listed by: 43 NORTH REALTY $179,900Active3 beds 2 baths1,760 sq. ft.
7679 Riverview, Saint Louis, MI 48880
MLS# 80063419Listed by: AMERICA'S CHOICE REALTY LLC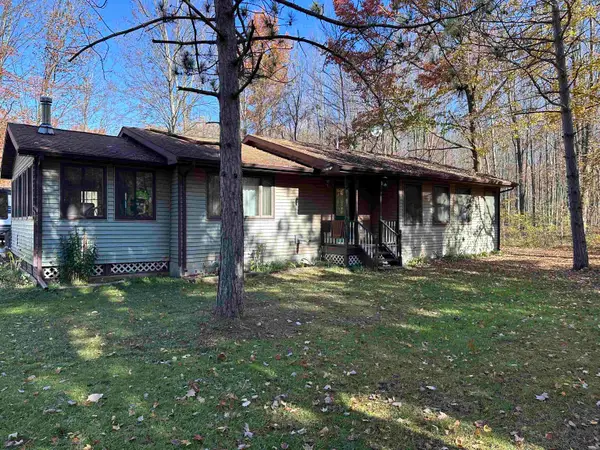 $275,000Pending3 beds 2 baths1,300 sq. ft.
4350 W Laporte, Saint Louis, MI 48880
MLS# 80063161Listed by: EXP REALTY LLC $113,500Active4 beds 2 baths1,668 sq. ft.
330 N Main Street, SaintLouis, MI 48880
MLS# 20251029147Listed by: REALHOME SERVICES AND SOLUTIONS INC $74,000Active3 beds 1 baths1,543 sq. ft.
523 Union, Saint Louis, MI 48880
MLS# 80060853Listed by: 43 NORTH REALTY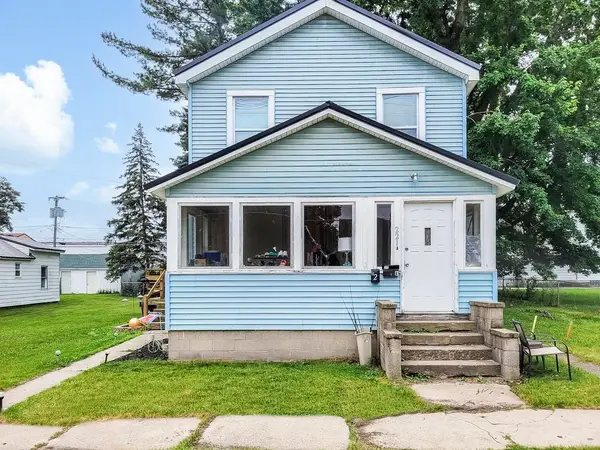 $129,000Active-- beds -- baths
221 North, Saint Louis, MI 48880
MLS# 80059109Listed by: 43 NORTH REALTY $110,000Active11.51 Acres
TBD Prospect, StLouis, MI 48880
MLS# 79080057382Listed by: CENTURY 21 LEE-MAC REALTY $110,000Active11.51 Acres
TBD Prospect, Saint Louis, MI 48880
MLS# 80057382Listed by: CENTURY 21 LEE-MAC REALTY $28,500Active1.03 Acres
TBD Dawn, Saint Louis, MI 48880
MLS# 80054732Listed by: CENTURY 21 LEE-MAC REALTY $50,000Active0.51 Acres
518 W Washington, Saint Louis, MI 48880
MLS# 80052340Listed by: CENTURY 21 LEE-MAC REALTY $15,000Active0.65 Acres
00 V/L Essex Drive, St. Louis, MI 48880
MLS# 26001372Listed by: RE/MAX REAL ESTATE PROFESSIONALS
Local realty services provided by:CENTURY 21 Affiliated, CENTURY 21 Northland, CENTURY 21 Signature Realty
Popular searches near 48880
Popular neighborhoods near 48880
- Adams Boulevard, Saginaw homes for sale
- Banks, Bay City homes for sale
- Butman, Saginaw homes for sale
- Cathedral District, Saginaw homes for sale
- Center Avenue, Bay City homes for sale
- Columbus Avenue, Bay City homes for sale
- Covenant, Saginaw homes for sale
- Fairground, Saginaw homes for sale
- Heritage Square, Saginaw homes for sale
- Houghton Jones, Saginaw homes for sale
- Johnson Street, Bay City homes for sale
- Midland Street, Bay City homes for sale
- Northeast Saginaw, Saginaw homes for sale
- Northmoor, Saginaw homes for sale
- Northwest, Saginaw homes for sale
- St. Stephen's Brockway - Carman, Saginaw homes for sale
- Shady Oak, Lansing homes for sale
- South End, Bay City homes for sale
- Southwest, Bay City homes for sale
- Southwest, Saginaw homes for sale
Counties near Saint Louis, 48880
- Arenac County homes for sale
- Bay County homes for sale
- Clare County homes for sale
- Clinton County homes for sale
- Eaton County homes for sale
- Genesee County homes for sale
- Gladwin County homes for sale
- Gratiot County homes for sale
- Ingham County homes for sale
- Ionia County homes for sale
- Isabella County homes for sale
- Kent County homes for sale
- Mecosta County homes for sale
- Midland County homes for sale
- Montcalm County homes for sale
- Osceola County homes for sale
- Roscommon County homes for sale
- Saginaw County homes for sale
- Shiawassee County homes for sale
- Tuscola County homes for sale
Protect your home and budget from life's surprises with an Assurant Home Warranty, backed by a partner that supports you through every step of homeownership. Explore Plans.
©2026 Century 21 Real Estate LLC. All rights reserved. CENTURY 21®, the CENTURY 21 Logo and C21® are service marks owned by Century 21 Real Estate LLC. Century 21 Real Estate LLC fully supports the principles of the Fair Housing Act and the Equal Opportunity Act. Each office is independently owned and operated. Listing information is deemed reliable but not guaranteed accurate.