- Affton homes for sale
- Cahokia homes for sale
- Columbia homes for sale
- Concord homes for sale
- Crestwood homes for sale
- Dupo homes for sale
- East Carondelet homes for sale
- Gravois homes for sale
- Jefferson homes for sale
- Lemay homes for sale
- Maplewood homes for sale
- Mehlville homes for sale
- Oakville homes for sale
- St. George homes for sale
- Sappington homes for sale
- Shrewsbury homes for sale
- Sugar Loaf homes for sale
- Sunset Hills homes for sale
- Tesson Ferry homes for sale
- Webster Groves homes for sale
63125, MO - homes for sale
107 of 107 results displayed
- New
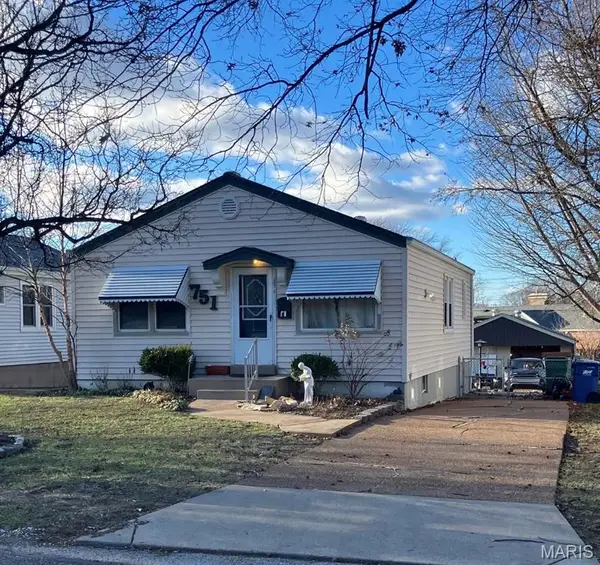 $159,900Active2 beds 1 baths1,248 sq. ft.
751 Dallas Drive, St Louis, MO 63125
MLS# 26018012Listed by: COLDWELL BANKER REALTY - GUNDAKER - Coming Soon
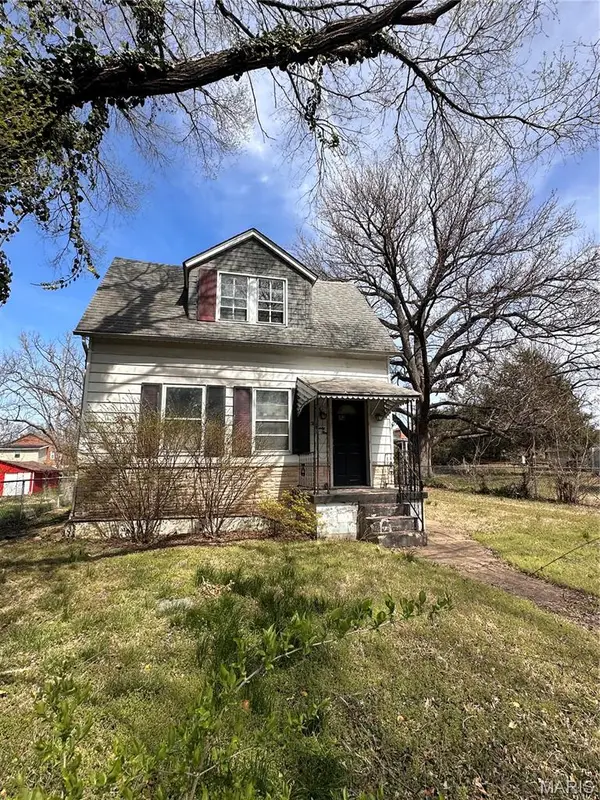 $35,000Coming Soon3 beds 1 baths
329 Goetz Avenue, LeMay, MO 63125
MLS# 26015625Listed by: EXP REALTY, LLC 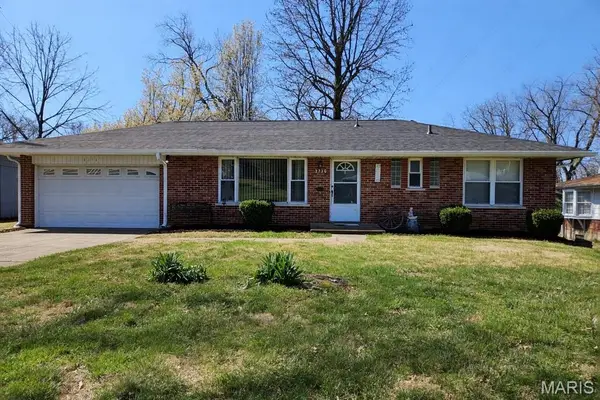 $229,900Pending2 beds 2 baths1,018 sq. ft.
3736 Park Crest Drive, Unincorporated, MO 63125
MLS# 26016681Listed by: GATEWAY REAL ESTATE- New
 $380,000Active4 beds 4 baths2,561 sq. ft.
2228 Hagenstone Terrace, Unincorporated, MO 63125
MLS# 26016774Listed by: SAVEL, REALTORS - New
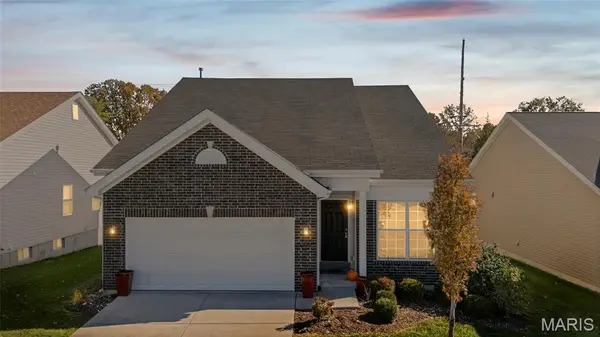
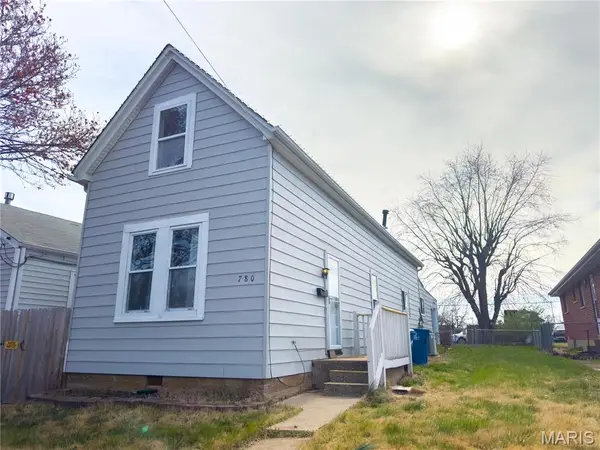 $154,999Active2 beds 1 baths1,037 sq. ft.
780 Pardella Avenue, St Louis, MO 63125
MLS# 26016865Listed by: EXIT ELITE REALTY - New
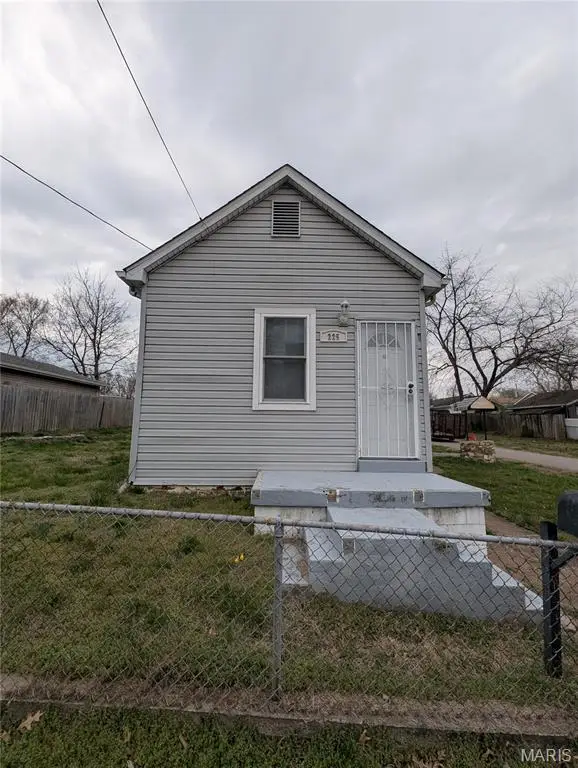 $129,000Active1 beds 1 baths688 sq. ft.
225 E Arlee Avenue, St Louis, MO 63125
MLS# 26016764Listed by: EQUITY MISSOURI LLC - New
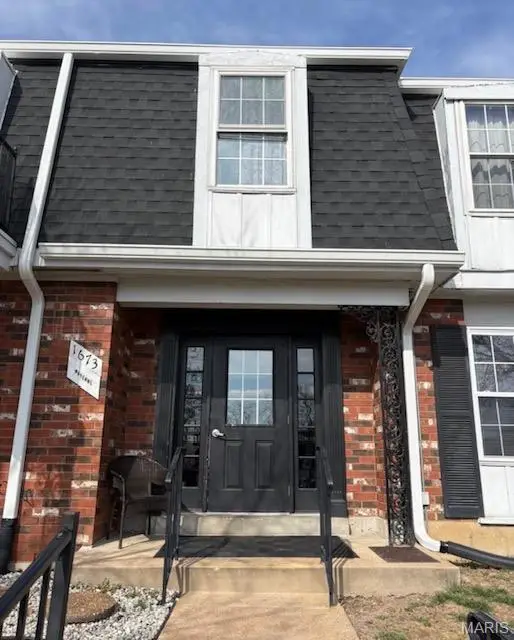 $115,000Active2 beds 1 baths908 sq. ft.
1673 Mayenne Court #D, St Louis, MO 63125
MLS# 26015919Listed by: REECENICHOLS REAL ESTATE - New
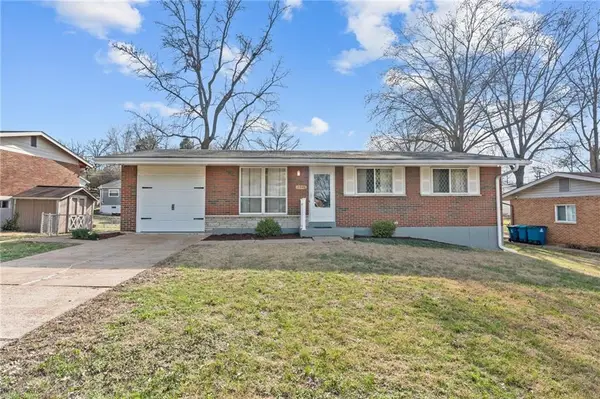 $295,000Active3 beds 2 baths1,725 sq. ft.
3946 Colony Gardens Drive, St Louis, MO 63125
MLS# 2608227Listed by: PLATINUM REALTY LLC - New
 $324,900Active3 beds 2 baths1,534 sq. ft.
3608 Cordes Drive, Mehlville, MO 63125
MLS# 26001294Listed by: COLDWELL BANKER PREMIER GROUP - Coming Soon
 $165,000Coming Soon3 beds 1 baths
619 Waller Avenue, St Louis, MO 63125
MLS# 26016130Listed by: COLDWELL BANKER REALTY - GUNDAKER - New
 $159,900Active3 beds 1 baths1,064 sq. ft.
327 W Felton Avenue, St Louis, MO 63125
MLS# 26016370Listed by: MAGNOLIA REAL ESTATE - New
 $264,900Active3 beds 1 baths1,938 sq. ft.
19 Estes Parkway, St Louis, MO 63125
MLS# 26011788Listed by: ALLEN BRAKE REAL ESTATE - New
 $264,900Active2 beds 2 baths1,228 sq. ft.
3755 Park Crest Drive, St Louis, MO 63125
MLS# 26015798Listed by: MAGNOLIA REAL ESTATE - New
 $200,000Active2 beds 1 baths972 sq. ft.
520 Ruthland Drive, St Louis, MO 63125
MLS# 26015601Listed by: THREE DOORS LLC - New
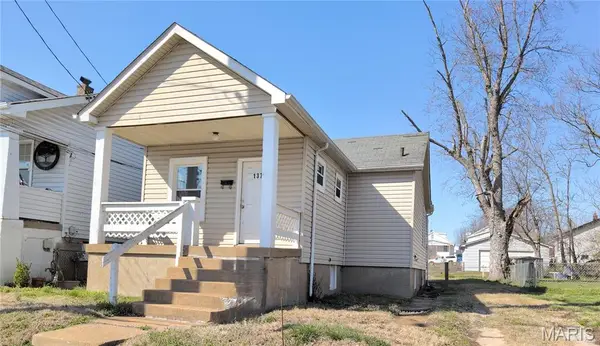 $93,000Active2 beds 1 baths798 sq. ft.
137 W Arlee Avenue, St Louis, MO 63125
MLS# 26016025Listed by: RE/MAX RESULTS  $225,000Pending3 beds 2 baths1,444 sq. ft.
1125 Hawkstone Lane, St Louis, MO 63125
MLS# 26014716Listed by: BERKSHIRE HATHAWAY HOMESERVICES SELECT PROPERTIES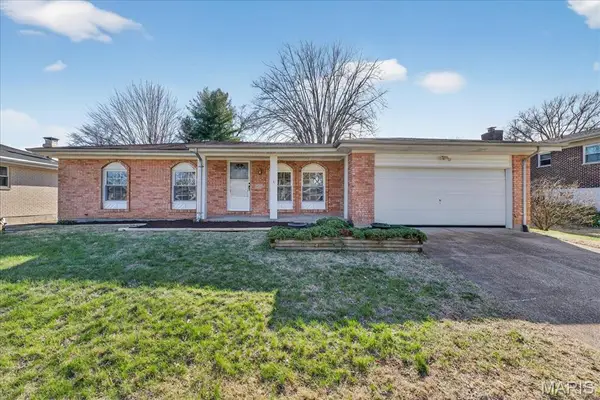 $315,000Pending3 beds 2 baths1,446 sq. ft.
686 Damascus Drive, St Louis, MO 63125
MLS# 26015808Listed by: COLDWELL BANKER PREMIER GROUP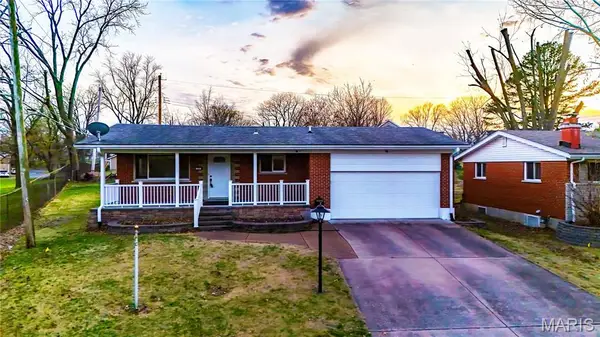 $325,000Pending5 beds 3 baths2,344 sq. ft.
576 Clager Drive, Mehlville, MO 63125
MLS# 26015838Listed by: MAIN KEY REALTY LLC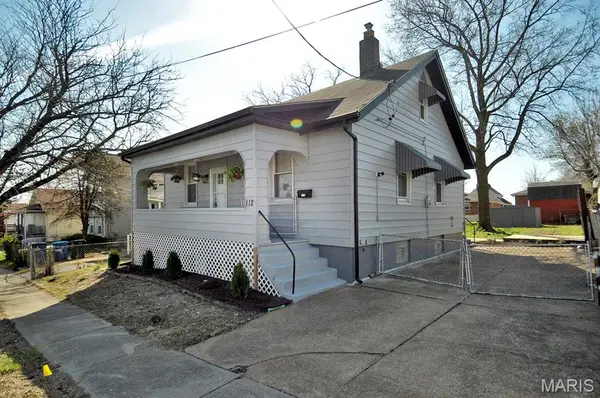 $179,900Pending3 beds 2 baths1,200 sq. ft.
112 Mann Street, Unincorporated, MO 63125
MLS# 26015698Listed by: REALTY EXECUTIVES OF ST. LOUIS $169,900Pending2 beds 2 baths1,304 sq. ft.
231 E Velma Avenue, St Louis, MO 63125
MLS# 26015504Listed by: AMERICAN REALTY GROUP $146,500Pending2 beds 1 baths712 sq. ft.
331 Rauhut Avenue, St Louis, MO 63125
MLS# 26014651Listed by: RE/MAX INTEGRITY $195,500Pending2 beds 2 baths1,436 sq. ft.
331 Geneva Drive, St Louis, MO 63125
MLS# 26015163Listed by: BERKSHIRE HATHAWAY HOMESERVICES SELECT PROPERTIES $200,000Pending3 beds 2 baths1,301 sq. ft.
229 Horn Avenue, St Louis, MO 63125
MLS# 26015063Listed by: THREE DOORS LLC $279,900Active3 beds 1 baths1,500 sq. ft.
2555 Telegraph Road, Mehlville, MO 63125
MLS# 26014110Listed by: SANDY BENDER, REAL ESTATE $170,000Active2 beds 2 baths1,088 sq. ft.
1841 Mansard Drive, Mehlville, MO 63125
MLS# 26014963Listed by: WORTH CLARK REALTY $275,000Pending3 beds 2 baths1,551 sq. ft.
3762 Calef Drive, St Louis, MO 63125
MLS# 26013362Listed by: EFTHIM COMPANY, REALTORS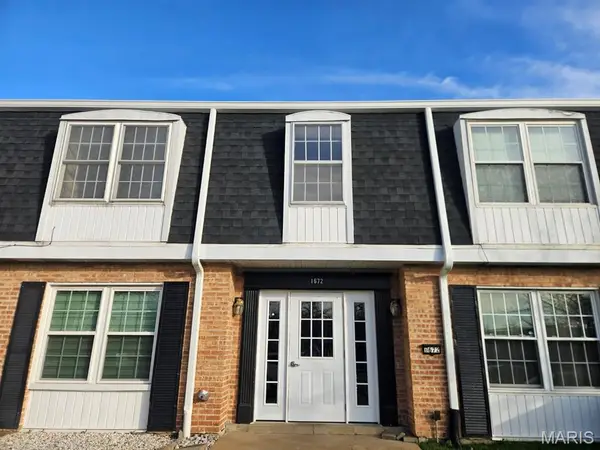 $89,950Pending2 beds 1 baths886 sq. ft.
1672 Herault Place #A, St Louis, MO 63125
MLS# 26014686Listed by: BERKSHIRE HATHAWAY HOMESERVICES SELECT PROPERTIES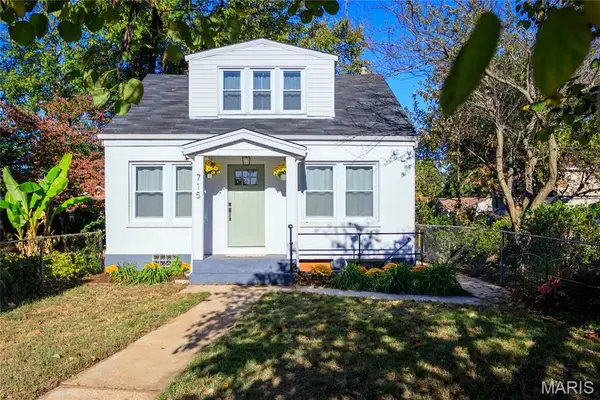 $172,500Active1 beds 2 baths1,042 sq. ft.
715 Erskine Avenue, St Louis, MO 63125
MLS# 26014557Listed by: ELEVATE REALTY, LLC $95,900Active2 beds 1 baths876 sq. ft.
1190 Calley Drive #C, St Louis, MO 63125
MLS# 26014419Listed by: REALTY EXECUTIVES OF ST. LOUIS $320,000Pending3 beds 3 baths2,930 sq. ft.
4108 Park Hill Court, Mehlville, MO 63125
MLS# 26012199Listed by: EXP REALTY, LLC $219,900Pending2 beds 2 baths1,892 sq. ft.
3655 Colonia Place Drive #D, St Louis, MO 63125
MLS# 26013530Listed by: BERKSHIRE HATHAWAY HOMESERVICES SELECT PROPERTIES $190,000Pending2 beds 2 baths888 sq. ft.
112 E Arlee Avenue, St Louis, MO 63125
MLS# 26014193Listed by: DRG - DELHOUGNE REALTY GROUP $179,900Active2 beds 2 baths972 sq. ft.
3605 Tracey Rich Road #1B, Mehlville, MO 63125
MLS# 26012572Listed by: LIFSTYL REAL ESTATE $244,500Pending2 beds 2 baths1,880 sq. ft.
3641 Park Crest Drive, Mehlville, MO 63125
MLS# 25082893Listed by: JANET MCAFEE INC. $199,900Pending2 beds 2 baths1,233 sq. ft.
817 Karlsruhe Place, Unincorporated, MO 63125
MLS# 26013357Listed by: ASCEND REAL ESTATE ADVISORS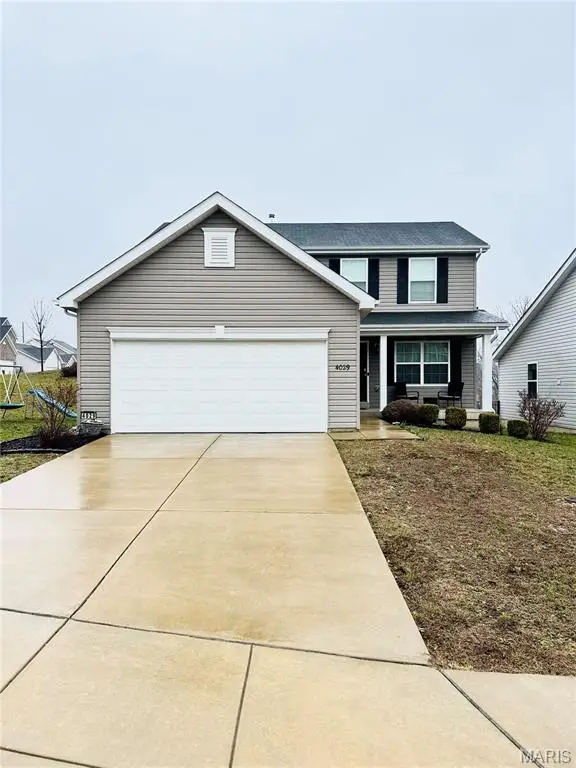 $379,900Pending3 beds 3 baths1,728 sq. ft.
4029 Mitchford Drive, St Louis, MO 63125
MLS# 26012830Listed by: RE/MAX BEST CHOICE ST. LOUIS $315,000Active3 beds 2 baths1,189 sq. ft.
2511 Reav Tel Court, St Louis, MO 63125
MLS# 26012657Listed by: WOOD BROTHERS REALTY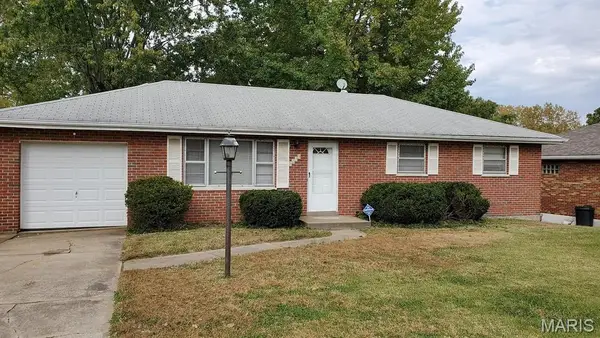 $399,000Active3 beds 1 baths1,092 sq. ft.
1133 Fain Drive, St Louis, MO 63125
MLS# 26012541Listed by: RE/MAX RESULTS $99,900Pending2 beds 1 baths900 sq. ft.
1725 Herault Place #G, LeMay, MO 63125
MLS# 26012825Listed by: RAMIC REALTY SERVICES LLC $210,000Pending4 beds 3 baths1,733 sq. ft.
9946 Brook Avenue, St Louis, MO 63125
MLS# 26012717Listed by: EXP REALTY, LLC $179,900Pending1 beds 2 baths960 sq. ft.
2411 Telegraph Road, LeMay, MO 63125
MLS# 26007029Listed by: CITYSCAPES REALTY $460,000Pending3 beds 3 baths1,728 sq. ft.
1928 Simba Circle, St Louis, MO 63125
MLS# 26011811Listed by: BERKSHIRE HATHAWAY HOMESERVICES SELECT PROPERTIES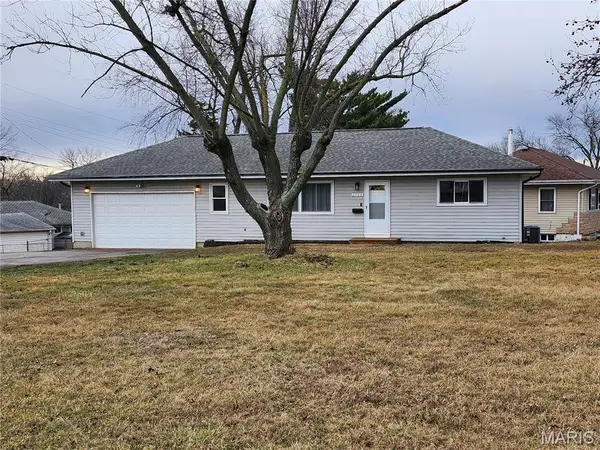 $220,000Pending2 beds 2 baths864 sq. ft.
Address Withheld By Seller, St Louis, MO 63125
MLS# 26012276Listed by: WORTH CLARK REALTY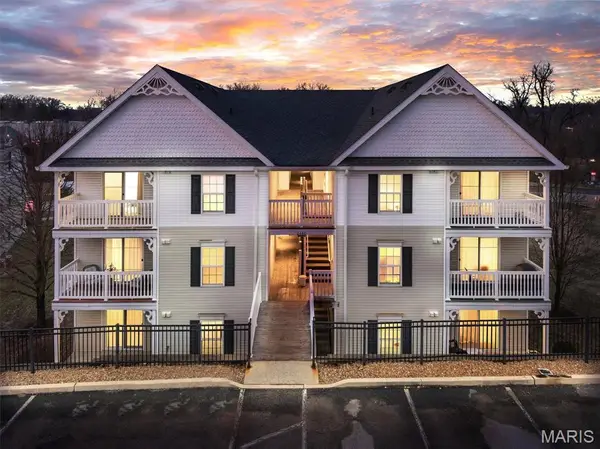 $159,900Pending2 beds 2 baths954 sq. ft.
2460 Lampong Drive #100C, St Louis, MO 63125
MLS# 26008986Listed by: KELLER WILLIAMS REALTY ST. LOUIS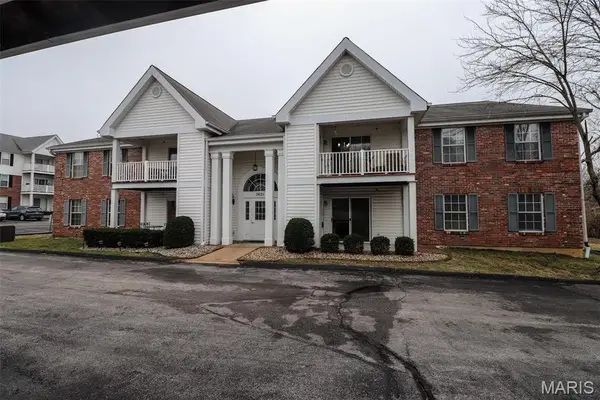 $159,900Active2 beds 2 baths972 sq. ft.
3621 Tracey Rich Road #1A, St Louis, MO 63125
MLS# 26011797Listed by: REALTY EXECUTIVES OF ST. LOUIS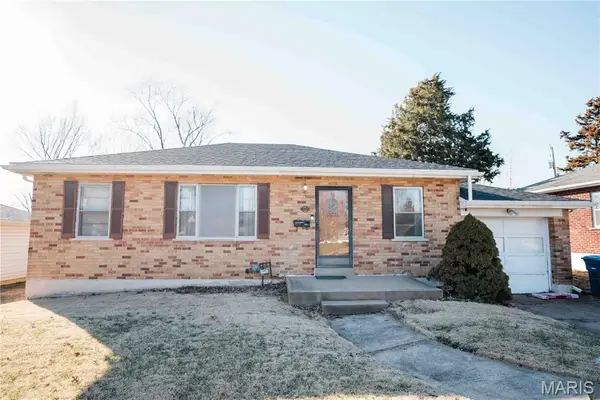 $199,000Pending2 beds 1 baths945 sq. ft.
1080 Rainbow Drive, St Louis, MO 63125
MLS# 26011551Listed by: REDKEY REALTY LEADERS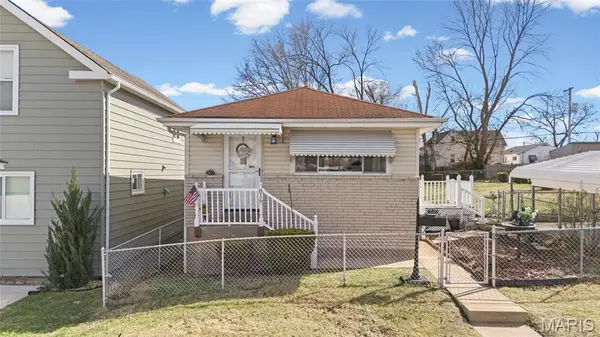 $200,000Pending2 beds 1 baths798 sq. ft.
816 Regina Avenue, St Louis, MO 63125
MLS# 26011281Listed by: REALTY EXECUTIVES OF ST. LOUIS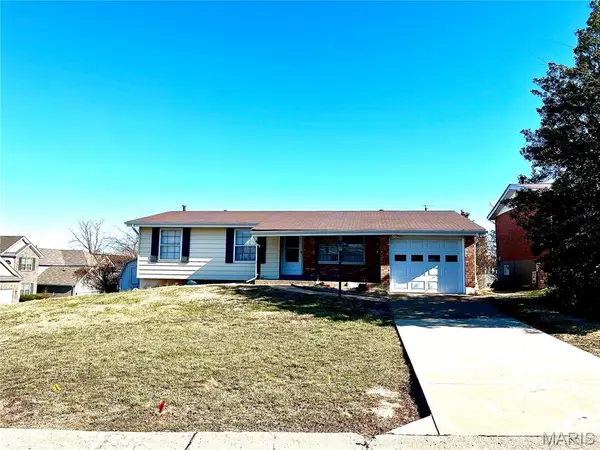 $109,000Pending4 beds 3 baths1,080 sq. ft.
3933 Mitchford Drive, Mehlville, MO 63125
MLS# 26011131Listed by: EPIQUE REALTY $264,000Pending3 beds 2 baths2,560 sq. ft.
4116 Cornus Drive, St Louis, MO 63125
MLS# 26011146Listed by: KELLER WILLIAMS REALTY ST. LOUIS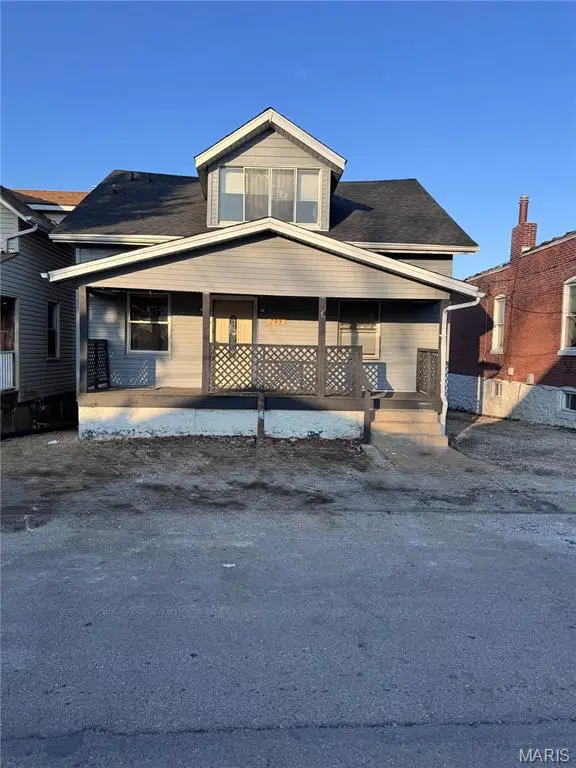 $210,000Active4 beds 2 baths1,568 sq. ft.
705 Lagro Avenue, LeMay, MO 63125
MLS# 26009009Listed by: EXP REALTY, LLC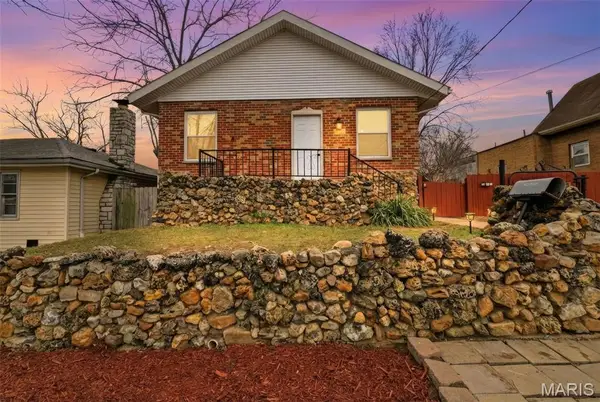 $179,900Active3 beds 1 baths888 sq. ft.
1036 Wachtel Avenue, St Louis, MO 63125
MLS# 25082241Listed by: EXP REALTY, LLC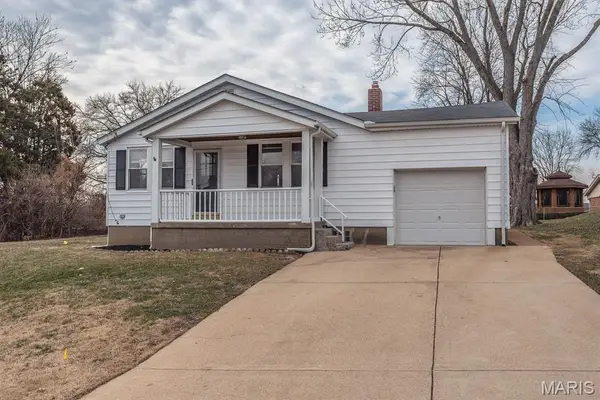 $274,900Pending2 beds 2 baths1,675 sq. ft.
4048 Buckley Road, Mehlville, MO 63125
MLS# 26010934Listed by: EXP REALTY, LLC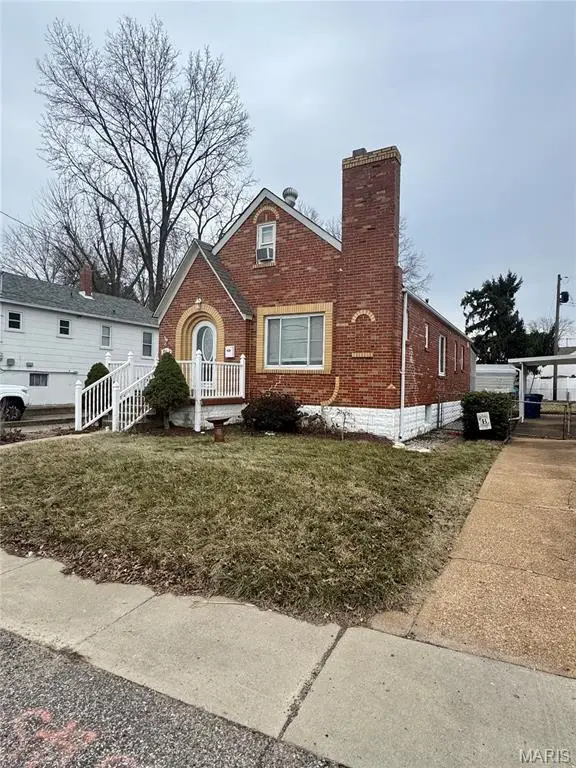 $235,000Active3 beds 3 baths2,225 sq. ft.
504 W Ripa Avenue, St Louis, MO 63125
MLS# 26010538Listed by: COLDWELL BANKER REALTY - GUNDAKER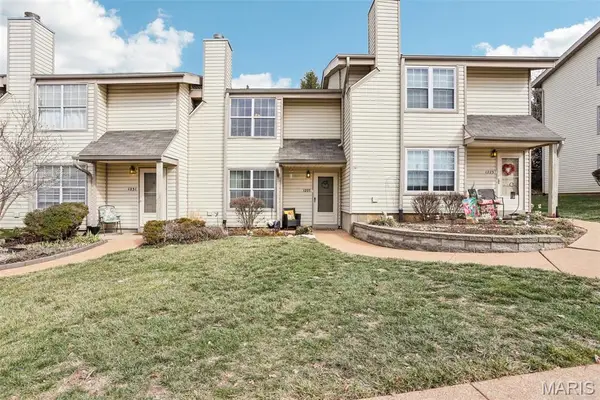 $165,900Active3 beds 3 baths1,348 sq. ft.
1227 Mangrove Lane, St Louis, MO 63125
MLS# 26010603Listed by: ELEVATE REALTY, LLC $249,000Pending3 beds 2 baths1,272 sq. ft.
9933 Linn Avenue, St Louis, MO 63125
MLS# 26010271Listed by: BERKSHIRE HATHAWAY HOMESERVICES SELECT PROPERTIES $275,000Pending4 beds 3 baths2,650 sq. ft.
805 Westair Drive, St Louis, MO 63125
MLS# 26010428Listed by: BERKSHIRE HATHAWAY HOMESERVICES SELECT PROPERTIES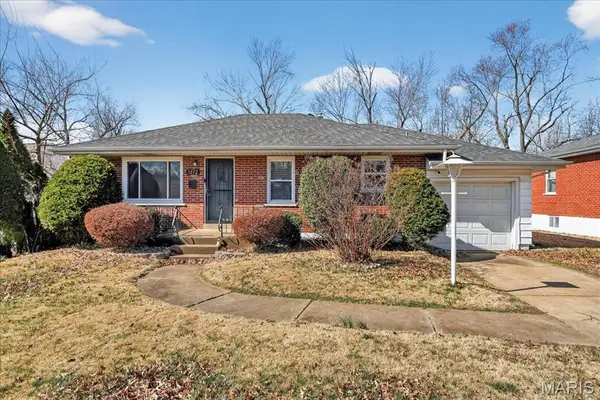
 $249,900Pending3 beds 2 baths1,715 sq. ft.
1072 Rainbow Drive, St Louis, MO 63125
MLS# 26010339Listed by: CENTURY 21- THE ADVANTAGE RE $211,000Pending4 beds 2 baths1,700 sq. ft.
2957 Caspian Lane, Unincorporated, MO 63125
MLS# 26005421Listed by: COLDWELL BANKER REALTY - GUNDAKER $239,900Pending3 beds 2 baths1,669 sq. ft.
2818 Redstone Drive, St Louis, MO 63125
MLS# 26008171Listed by: BERKSHIRE HATHAWAY HOMESERVICES SELECT PROPERTIES $164,900Active3 beds 1 baths1,125 sq. ft.
607 Majesty Court, Unincorporated, MO 63125
MLS# 26009989Listed by: REALTY USA $295,000Pending3 beds 2 baths1,971 sq. ft.
3228 Lin Tel Road, St Louis, MO 63125
MLS# 25067104Listed by: BERKSHIRE HATHAWAY HOMESERVICES SELECT PROPERTIES $259,900Pending3 beds 2 baths1,444 sq. ft.
1505 Telegraph Road, St Louis, MO 63125
MLS# 26000627Listed by: WORTH CLARK REALTY $164,500Active3 beds 1 baths945 sq. ft.
105 Sylvia Drive, St Louis, MO 63125
MLS# 26009322Listed by: PLATINUM REALTY OF ST. LOUIS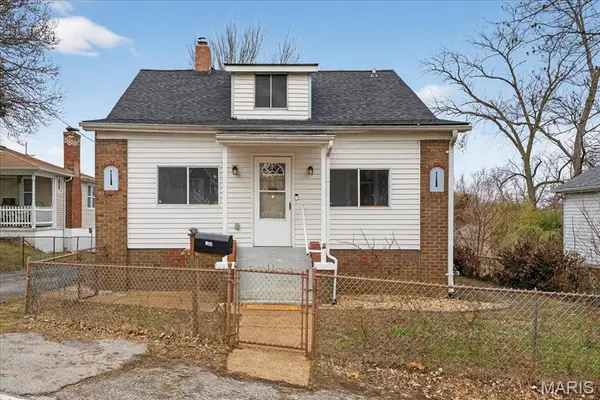 $165,000Pending3 beds 1 baths1,491 sq. ft.
9533 Gentry Avenue, St Louis, MO 63125
MLS# 26006424Listed by: COMPASS REALTY GROUP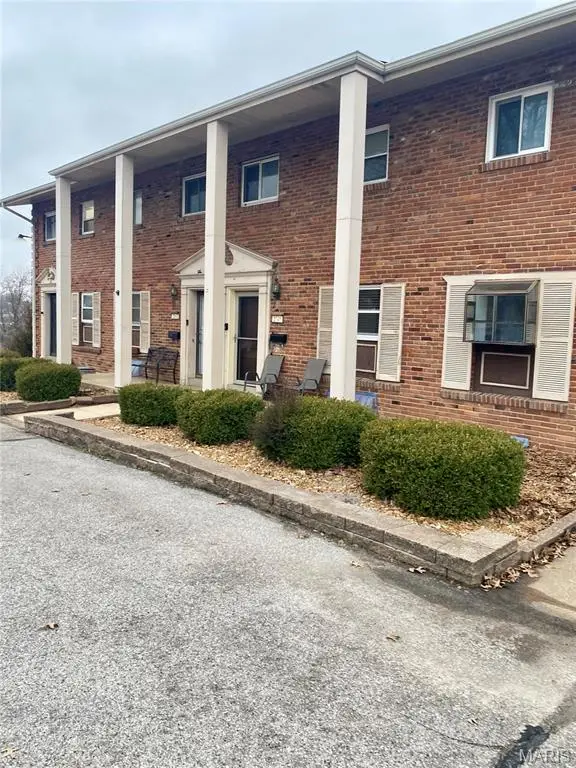 $179,900Pending2 beds 2 baths1,350 sq. ft.
2541 Union Road, St Louis, MO 63125
MLS# 26009036Listed by: WORTH CLARK REALTY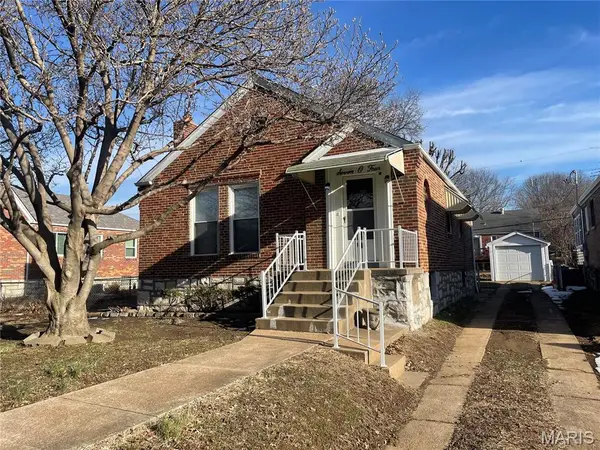 $180,000Pending1 beds 1 baths999 sq. ft.
704 Dallas Drive, Bella Villa, MO 63125
MLS# 26008021Listed by: REALTY SOURCE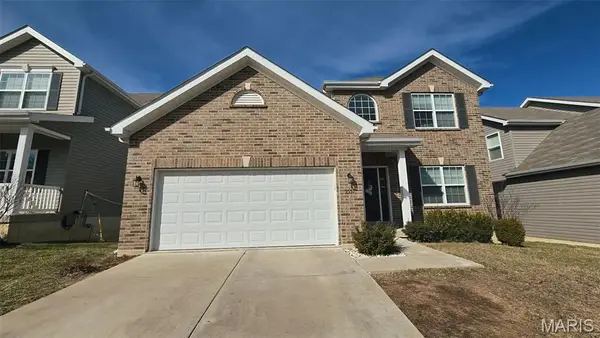 $435,000Pending4 beds 3 baths2,193 sq. ft.
3337 Grasso Fields Court, St Louis, MO 63125
MLS# 26007628Listed by: KELLER WILLIAMS REALTY ST. LOUIS $259,900Pending3 beds 2 baths1,496 sq. ft.
803 Alleghany Drive, Mehlville, MO 63125
MLS# 26006977Listed by: RAMIC REALTY SERVICES LLC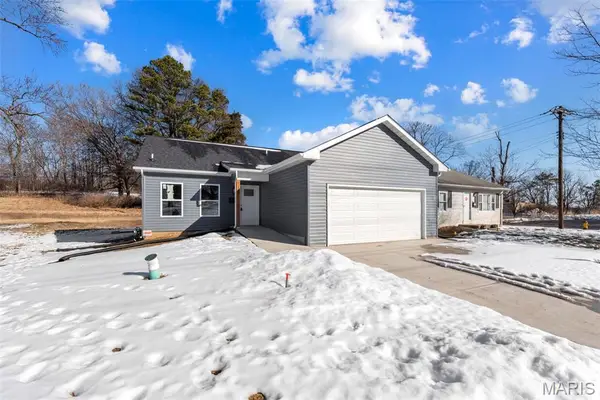 $239,000Active3 beds 2 baths1,222 sq. ft.
309 E Arlee Avenue, St Louis, MO 63125
MLS# 26007020Listed by: KELLER WILLIAMS REALTY ST. LOUIS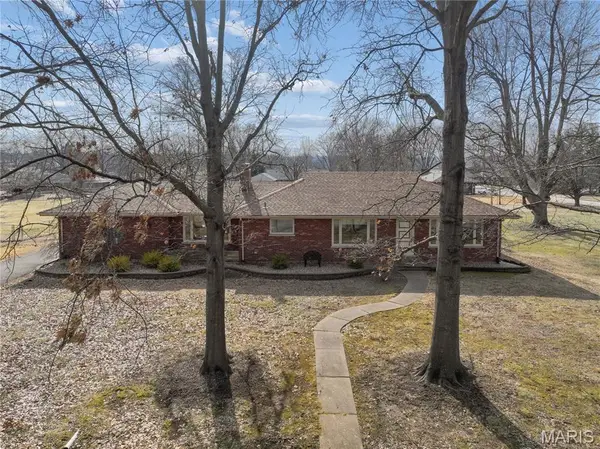 $310,000Pending2 beds 2 baths2,724 sq. ft.
838 Middleboro Drive, St Louis, MO 63125
MLS# 26007155Listed by: COLDWELL BANKER REALTY - GUNDAKER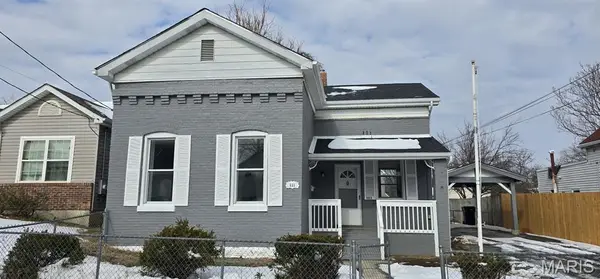 $128,500Pending2 beds 1 baths1,106 sq. ft.
111 E Arlee Avenue, St Louis, MO 63125
MLS# 26006338Listed by: COLDWELL BANKER REALTY - GUNDAKER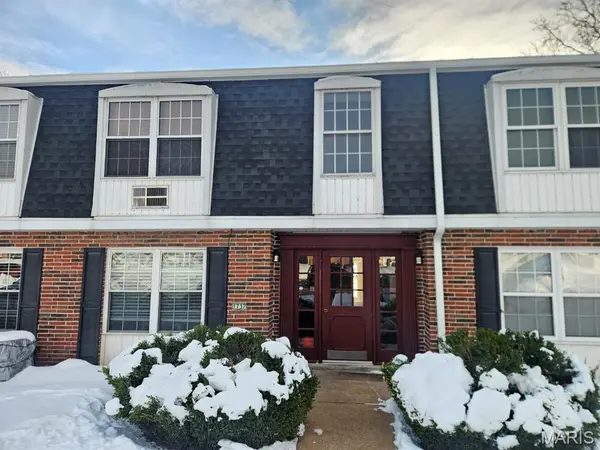 $79,900Pending2 beds 1 baths824 sq. ft.
1737 Herault Place #H, St Louis, MO 63125
MLS# 26005912Listed by: BERKSHIRE HATHAWAY HOMESERVICES SELECT PROPERTIES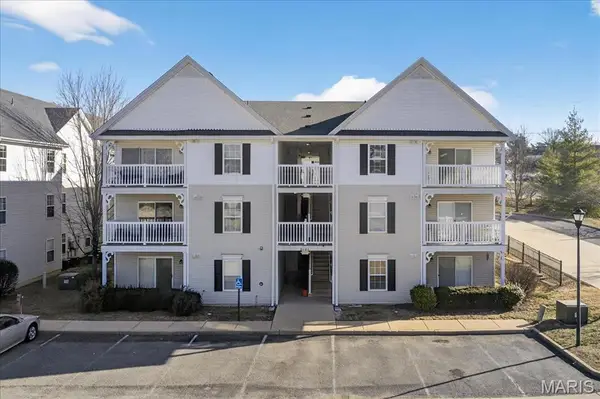 $172,500Pending2 beds 2 baths954 sq. ft.
2490 Lampong Drive #300C, St Louis, MO 63125
MLS# 26003250Listed by: DIELMANN SOTHEBY'S INTERNATIONAL REALTY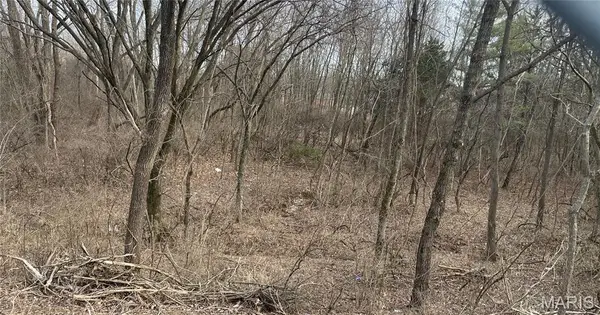 $399,000Active4.35 Acres
2555 Brush Court, St Louis, MO 63125
MLS# 26003186Listed by: RE/MAX RESULTS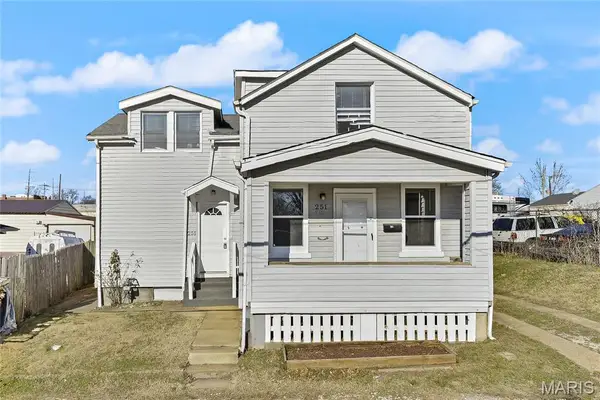 $169,000Active3 beds 1 baths1,386 sq. ft.
251 Wachtel Avenue, St Louis, MO 63125
MLS# 26003739Listed by: WELCOME HOME REALTY GROUP, LLC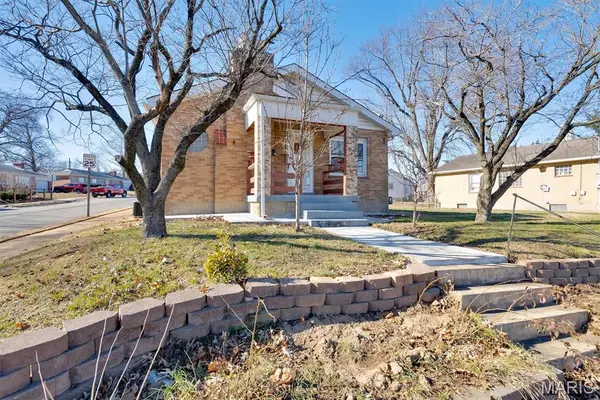 $177,500Active3 beds 2 baths1,162 sq. ft.
1625 Telegraph Road, St Louis, MO 63125
MLS# 26002711Listed by: KELLER WILLIAMS CHESTERFIELD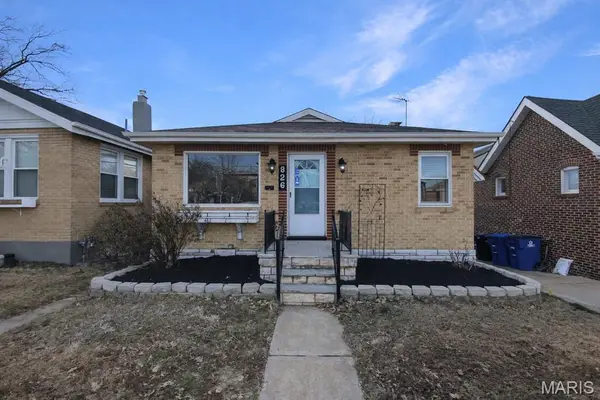 $238,000Active2 beds 2 baths1,871 sq. ft.
826 Catskill Drive, St Louis, MO 63125
MLS# 26002995Listed by: OPENDOOR BROKERAGE LLC $110,000Pending3 beds 3 baths1,560 sq. ft.
1726 Mayenne Court, St Louis, MO 63125
MLS# 26002542Listed by: KELLER WILLIAMS REALTY ST. LOUIS $235,000Active2 beds 1 baths963 sq. ft.
615 Reavis Barracks Road, St Louis, MO 63125
MLS# 26001899Listed by: WOOD BROTHERS REALTY $209,900Active3 beds 2 baths962 sq. ft.
2715 Creekwood Manor Lane, St Louis, MO 63125
MLS# 25082994Listed by: MAGNOLIA REAL ESTATE $190,000Pending2 beds 1 baths1,289 sq. ft.
508 Nannette Drive, St Louis, MO 63125
MLS# 26000123Listed by: CENTURY 21 ADVANTAGE $75,000Pending1 beds 1 baths1,155 sq. ft.
334 Horn Avenue, St Louis, MO 63125
MLS# 25078700Listed by: COLDWELL BANKER REALTY - GUNDAKER $155,000Pending2 beds 1 baths894 sq. ft.
939 Erskine Avenue, St Louis, MO 63125
MLS# 25081992Listed by: BERKSHIRE HATHAWAY HOMESERVICES SELECT PROPERTIES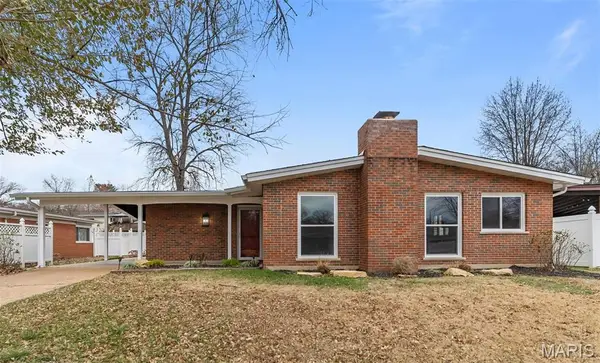 $289,900Pending3 beds 2 baths1,509 sq. ft.
2956 Chevron Drive, St Louis, MO 63125
MLS# 25080306Listed by: EXP REALTY, LLC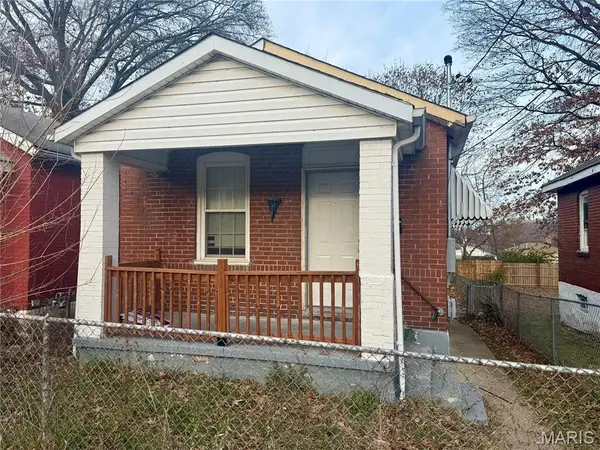 $88,000Active3 beds 2 baths612 sq. ft.
213 Waller Avenue, LeMay, MO 63125
MLS# 25080706Listed by: KNIGHT AND DREWS LLC $187,900Active2 beds 2 baths1,139 sq. ft.
612 Horn Avenue, St Louis, MO 63125
MLS# 25079670Listed by: ELEVATE REALTY, LLC $210,000Active3 beds 2 baths1,196 sq. ft.
210 Horn Avenue, St Louis, MO 63125
MLS# 25079158Listed by: JASON MITCHELL REAL ESTATE MISSOURI, LLC $225,000Active-- beds -- baths1,232 sq. ft.
317 Forbes Avenue, St Louis, MO 63125
MLS# 25078079Listed by: LISTWITHFREEDOM.COM INC $275,000Pending3 beds 2 baths1,950 sq. ft.
3720 Comstock Drive, St Louis, MO 63125
MLS# 25075349Listed by: WORTH CLARK REALTY $69,900Pending2 beds 1 baths916 sq. ft.
9604 Gentry Avenue, Unincorporated, MO 63125
MLS# 25068223Listed by: COLDWELL BANKER REALTY - GUNDAKER WEST REGIONAL $334,900Active3 beds 2 baths1,357 sq. ft.
1653 Flagstaff Drive, Festus, MO 63028
MLS# 25073121Listed by: BERKSHIRE HATHAWAY HOMESERVICES SELECT PROPERTIES $135,000Pending3 beds 3 baths1,536 sq. ft.
1656 Herault Place, St Louis, MO 63125
MLS# 25068732Listed by: RE/MAX RESULTS $86,000Pending2 beds 1 baths904 sq. ft.
1660 Blue Ridge Drive #G, Mehlville, MO 63125
MLS# 25067740Listed by: RE/MAX RESULTS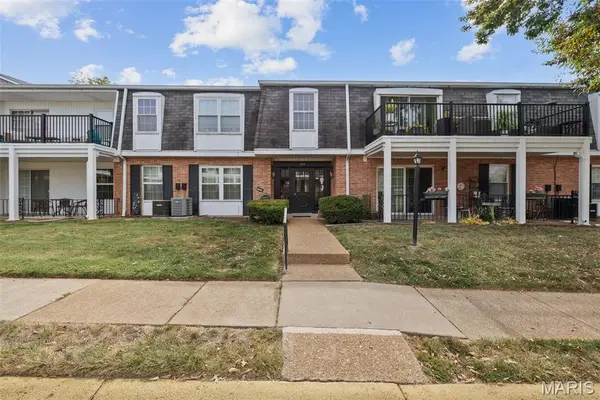 $112,500Active2 beds 1 baths904 sq. ft.
1678 Blue Ridge Drive #A, St Louis, MO 63125
MLS# 25066615Listed by: EXP REALTY, LLC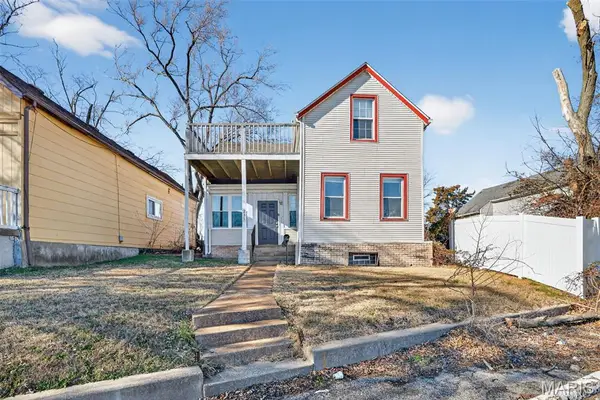 $84,900Pending3 beds 1 baths1,201 sq. ft.
235 Military Road, St Louis, MO 63125
MLS# 26001347Listed by: TRELORA REALTY, INC $140,000Pending3 beds 2 baths1,463 sq. ft.
252 Wachtel Avenue, St Louis, MO 63125
MLS# 25049019Listed by: REALTY USA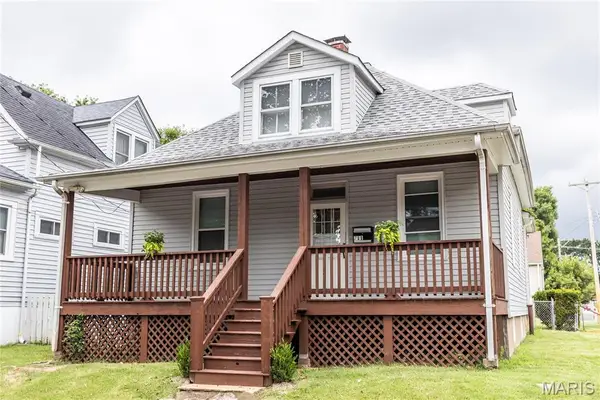 $210,000Active3 beds 2 baths1,359 sq. ft.
711 Erskine Avenue, Unincorporated, MO 63125
MLS# 26007727Listed by: PLATINUM REALTY OF ST. LOUIS $285,000Active4 beds 2 baths1,625 sq. ft.
701 Chevron Drive, Mehlville, MO 63125
MLS# 25066087Listed by: EXP REALTY, LLC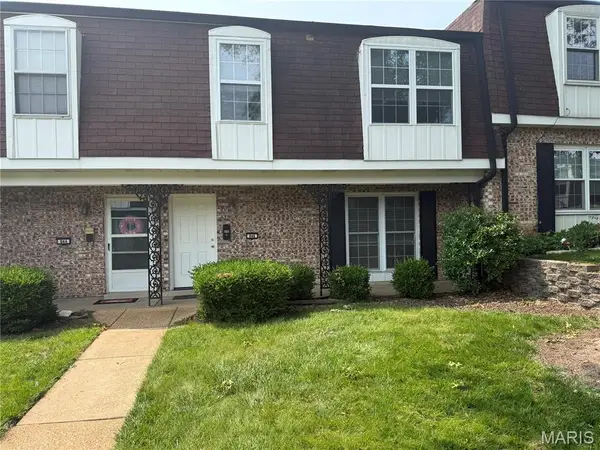 $145,900Active3 beds 3 baths1,560 sq. ft.
846 Dumont Place, St Louis, MO 63125
MLS# 26002616Listed by: EXP REALTY, LLC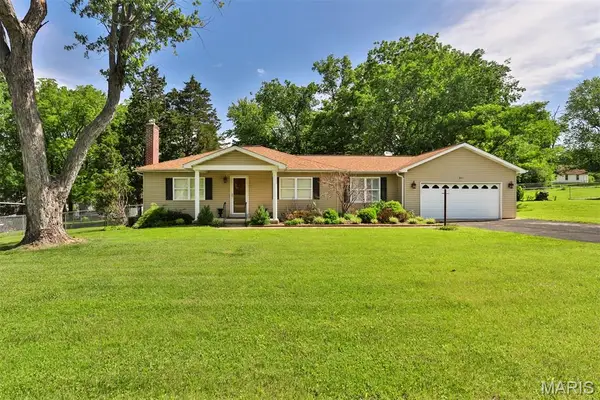 $339,900Pending3 beds 3 baths1,820 sq. ft.
851 Poplar Drive, Unincorporated, MO 63125
MLS# 25039435Listed by: THE COVA GROUP- $168,000Pending2 beds 2 baths1,040 sq. ft.
3618 Tracey Rich Road #1B, St Louis, MO 63125
MLS# 25030380Listed by: EXPERT, REALTORS - Coming Soon
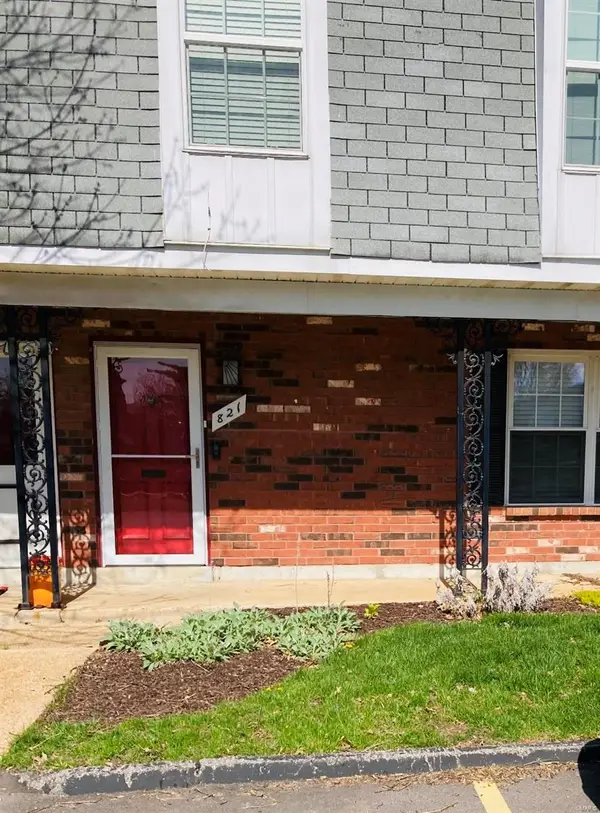 $149,900Coming Soon3 beds 3 baths
821 Dumont Place, St Louis, MO 63125
MLS# MAR25022583Listed by: COLDWELL BANKER PREMIER GROUP  $599,900Active4 beds 3 baths3,000 sq. ft.
712 Creekwood Court, O'Fallon, IL 62269
MLS# 25068912Listed by: RE/MAX SIGNATURE PROPERTIES $250,000Pending3 beds 2 baths1,488 sq. ft.
3346 Cordes Drive, St Louis, MO 63125
MLS# 25079219Listed by: RE/MAX RESULTS $355,000Pending-- beds -- baths2,990 sq. ft.
205 Grover Road, St Louis, MO 63125
MLS# 25001048Listed by: SAVEL, REALTORS $192,000Pending2 beds 1 baths925 sq. ft.
2813 Mohattan Lane, St Louis, MO 63125
MLS# 24065778Listed by: OPENDOOR BROKERAGE LLC- Coming Soon
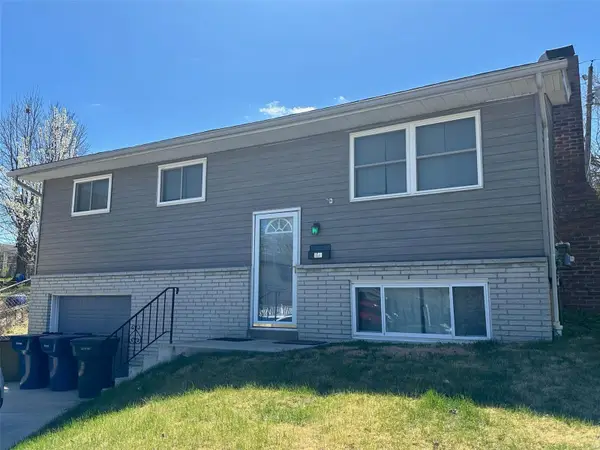 $200,000Coming Soon3 beds 3 baths
8126 Southpark Court, St Louis, MO 63125
MLS# MAR24009884Listed by: LUX PROPERTIES
Local realty services provided by:CENTURY 21 CopperKey Realty, CENTURY 21 Crossroads
Copyright 2026 Mid-America Regional Information Systems. All rights reserved. Listings courtesy of Mid-America Regional Information Systems as distributed by MLS GRID <Last Updated March 29, 2026. Mid-America Regional Information Systems provides content displayed here (“provided content”) on an “as is” basis and makes no representations or warranties regarding the provided content, including, but not limited to those of non-infringement, timeliness, accuracy, or completeness. Individuals and companies using information presented are responsible for verification and validation of information they utilize and present to their customers and clients. Mid-America Regional Information Systems will not be liable for any damage or loss resulting from use of the provided content or the products available through Portals, IDX, VOW, and/or Syndication. Recipients of this information shall not resell, redistribute, reproduce, modify, or otherwise copy any portion thereof without the expressed written consent of Mid-America Regional Information Systems.
Popular searches near 63125
Popular neighborhoods near 63125
- Affton, Saint Louis homes for sale
- Bevo Mill, Saint Louis homes for sale
- Boulevard Heights, Saint Louis homes for sale
- Carondelet, Saint Louis homes for sale
- Concord, Saint Louis homes for sale
- Dutchtown, Saint Louis homes for sale
- Holly Hills, Saint Louis homes for sale
- Lemay, Saint Louis homes for sale
- Mehlville, Saint Louis homes for sale
- Mount Pleasant, Saint Louis homes for sale
- Patch, Saint Louis homes for sale
- Princeton Heights, Saint Louis homes for sale
- St. George, Saint Louis homes for sale
- St. Louis Hills, Saint Louis homes for sale
- Sappington, Saint Louis homes for sale
- Shrewsbury, Saint Louis homes for sale
- South City, Saint Louis homes for sale
- South County, Saint Louis homes for sale
- Southampton, Saint Louis homes for sale
- Webster Groves, Saint Louis homes for sale
Counties near Saint Louis, 63125
- Bond County homes for sale
- Calhoun County homes for sale
- Clinton County homes for sale
- Franklin County homes for sale
- Jefferson County homes for sale
- Jersey County homes for sale
- Lincoln County homes for sale
- Macoupin County homes for sale
- Madison County homes for sale
- Monroe County homes for sale
- Randolph County homes for sale
- St. Charles County homes for sale
- St. Clair County homes for sale
- St. Francois County homes for sale
- St. Louis County homes for sale
- St. Louis city County homes for sale
- Ste. Genevieve County homes for sale
- Warren County homes for sale
- Washington County homes for sale
- Washington County homes for sale
Protect your home and budget from life's surprises with an Assurant Home Warranty, backed by a partner that supports you through every step of homeownership. Explore Plans.
©2026 Century 21 Real Estate LLC. All rights reserved. CENTURY 21®, the CENTURY 21 Logo and C21® are service marks owned by Century 21 Real Estate LLC. Century 21 Real Estate LLC fully supports the principles of the Fair Housing Act and the Equal Opportunity Act. Each office is independently owned and operated. Listing information is deemed reliable but not guaranteed accurate.