- Apple Valley homes for sale
- Bloomington homes for sale
- Burnsville homes for sale
- Cottage Grove homes for sale
- Eagan homes for sale
- Empire homes for sale
- Farmington homes for sale
- Inver Grove Heights homes for sale
- Lakeville homes for sale
- Mendota Heights homes for sale
- Newport homes for sale
- Nininger homes for sale
- Richfield homes for sale
- Rosemount homes for sale
- St Paul homes for sale
- St Paul Park homes for sale
- Savage homes for sale
- South St Paul homes for sale
- Sunfish Lake homes for sale
- West St Paul homes for sale
55123, MN - homes for sale
101 of 101 results displayed
- Coming SoonOpen Sat, 10:30am to 12pm
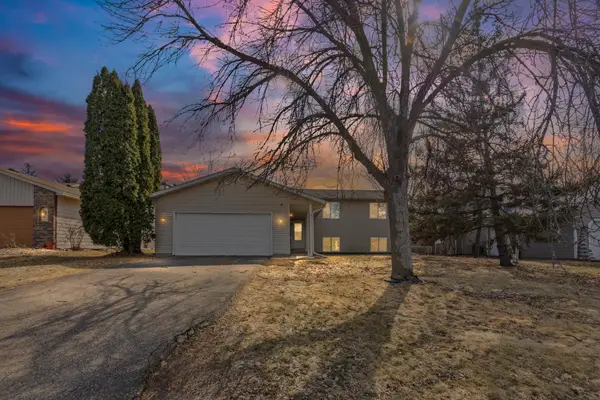
 $255,000Coming Soon2 beds 2 baths
1266 Timbershore Lane, Eagan, MN 55123
MLS# 6740153Listed by: RE/MAX ADVANTAGE PLUS - Open Fri, 4 to 6pmNew
 $780,000Active4 beds 4 baths3,132 sq. ft.
4639 Manor Drive, Eagan, MN 55123
MLS# 7033888Listed by: COMPASS - New
 $580,000Active4 beds 4 baths3,310 sq. ft.
4105 Countryview Drive, Eagan, MN 55123
MLS# 7040456Listed by: NELSON FAMILY REALTY - New
 $450,000Active3 beds 3 baths2,034 sq. ft.
4222 Yorktown Drive, Eagan, MN 55123
MLS# 7041327Listed by: EDINA REALTY, INC. 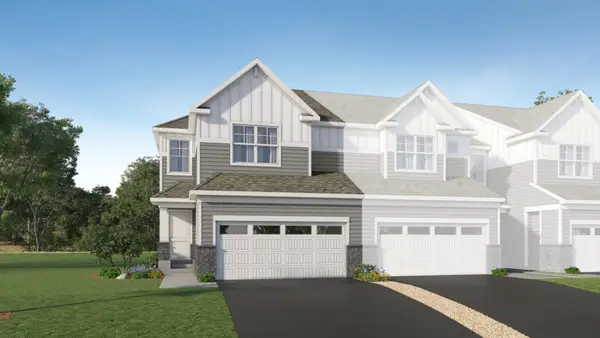 $480,220Pending3 beds 3 baths1,719 sq. ft.
3497 Trails End Circle, Eagan, MN 55123
MLS# 7041464Listed by: LENNAR SALES CORP- Open Sat, 12 to 2pmNew
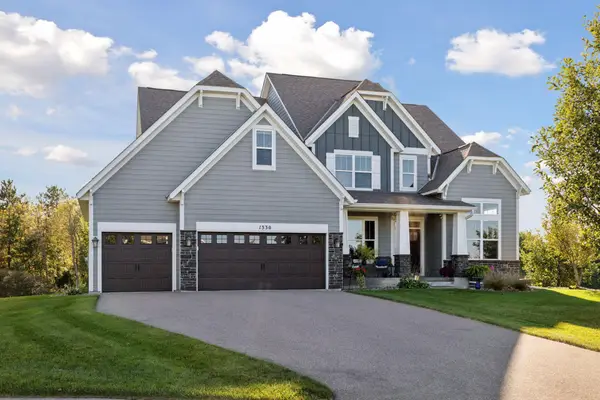 $1,150,000Active5 beds 5 baths6,808 sq. ft.
1330 Interlachen Drive, Eagan, MN 55123
MLS# 6803382Listed by: EDINA REALTY, INC. - New
 $550,000Active5 beds 4 baths2,841 sq. ft.
648 Welland Court, Saint Paul, MN 55123
MLS# 7034197Listed by: RE/MAX RESULTS  $575,000Pending5 beds 4 baths3,236 sq. ft.
9480 Tyne Lane, Inver Grove Heights, MN 55077
MLS# 7037899Listed by: COLDWELL BANKER REALTY- New
 $450,000Active3 beds 3 baths2,072 sq. ft.
3810 Mill Run Court, Eagan, MN 55123
MLS# 7033477Listed by: COLDWELL BANKER REALTY - New
 $480,000Active3 beds 3 baths2,260 sq. ft.
3610 Blue Jay Way, Eagan, MN 55123
MLS# 7037692Listed by: RE/MAX RESULTS - New
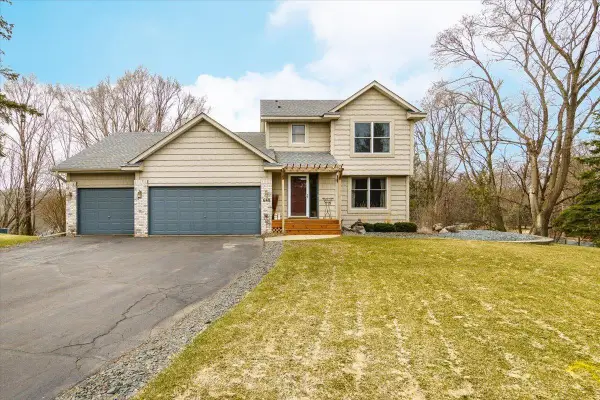
 $425,000Active6 beds 3 baths2,121 sq. ft.
3939 Westbury Drive, Eagan, MN 55123
MLS# 6807850Listed by: PEMBERTON RE 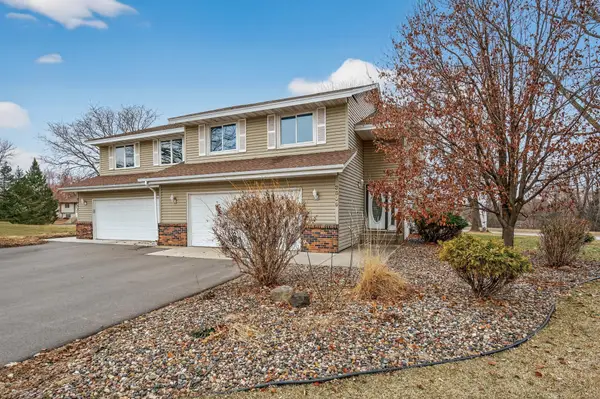 $325,000Active3 beds 2 baths1,822 sq. ft.
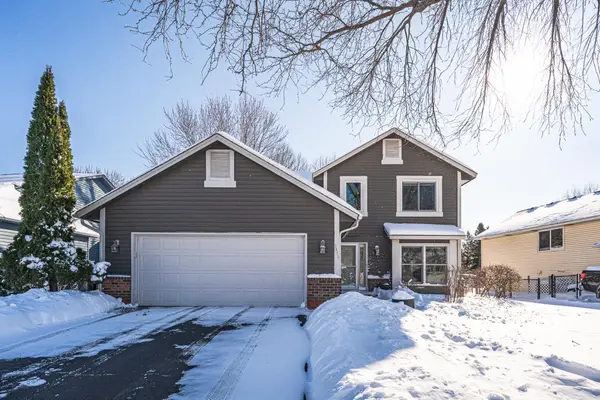
3809 Deercliff Court, Eagan, MN 55123
MLS# 7036145Listed by: RE/MAX RESULTS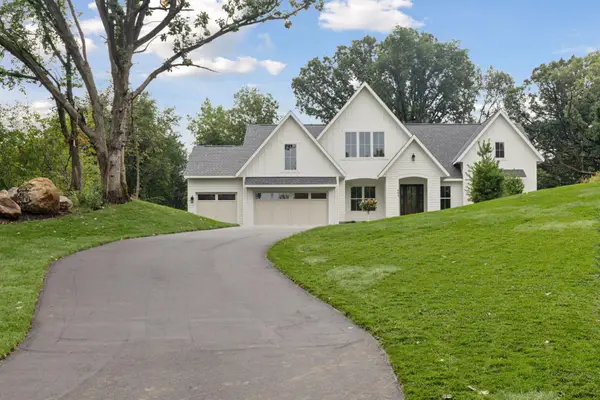 $1,749,000Active3 beds 3 baths3,941 sq. ft.
804 Great Oaks Trail, Eagan, MN 55123
MLS# 7019926Listed by: RE/MAX RESULTS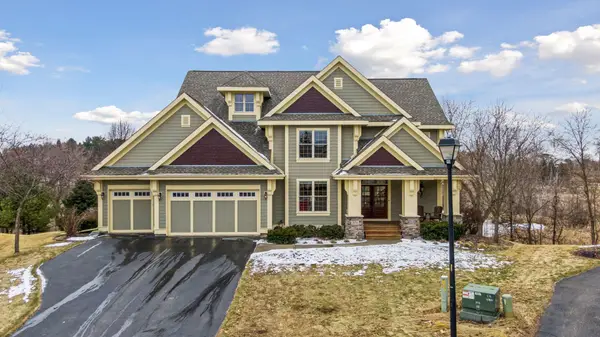 $950,000Active6 beds 5 baths4,884 sq. ft.
572 Spruce Circle, Saint Paul, MN 55123
MLS# 7024118Listed by: EDINA REALTY, INC. $425,000Pending4 beds 2 baths1,739 sq. ft.
1066 Tiffany Place, Eagan, MN 55123
MLS# 7030392Listed by: RE/MAX ADVANTAGE PLUS $550,000Active5 beds 4 baths2,800 sq. ft.
648 Welland Court, Eagan, MN 55123
MLS# 7034197Listed by: RE/MAX RESULTS- Open Fri, 9am to 7pm
 $520,000Pending3 beds 3 baths2,732 sq. ft.
578 Prairie Circle E, Eagan, MN 55123
MLS# 7033359Listed by: OPENDOOR BROKERAGE, LLC  $515,000Active4 beds 4 baths2,702 sq. ft.
1389 Camelback Drive, Eagan, MN 55123
MLS# 7030180Listed by: FREEMAN REAL ESTATE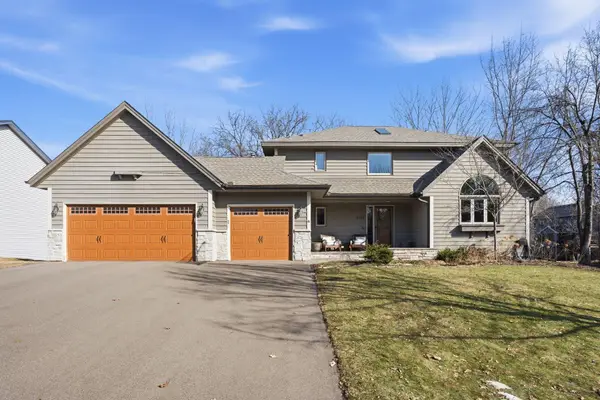 $600,000Active5 beds 4 baths3,802 sq. ft.
4136 Prairie Ridge Road, Saint Paul, MN 55123
MLS# 7031165Listed by: RE/MAX RESULTS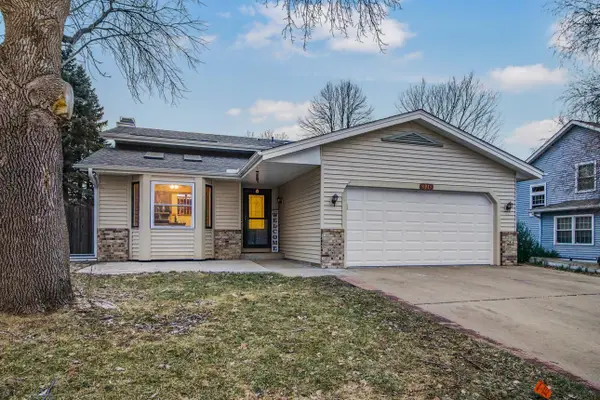 $439,000Active4 beds 3 baths2,351 sq. ft.
3919 Princeton Trail, Eagan, MN 55123
MLS# 7029646Listed by: REAL BROKER, LLC $275,000Active3 beds 2 baths1,682 sq. ft.
1219 Timbershore Lane, Saint Paul, MN 55123
MLS# 7030949Listed by: REAL ESTATE MASTERS, LTD.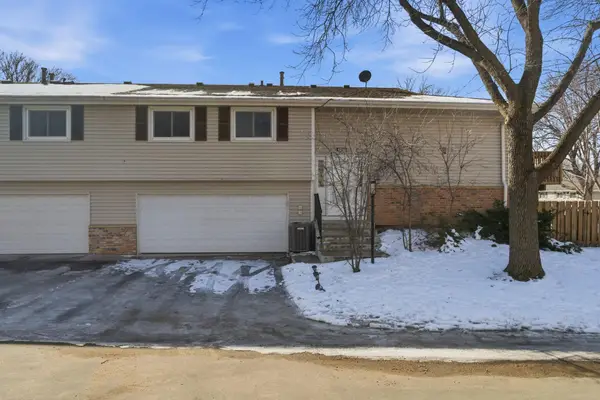 $275,000Active3 beds 2 baths1,302 sq. ft.
1219 Timbershore Lane, Eagan, MN 55123
MLS# 7030949Listed by: REAL ESTATE MASTERS, LTD.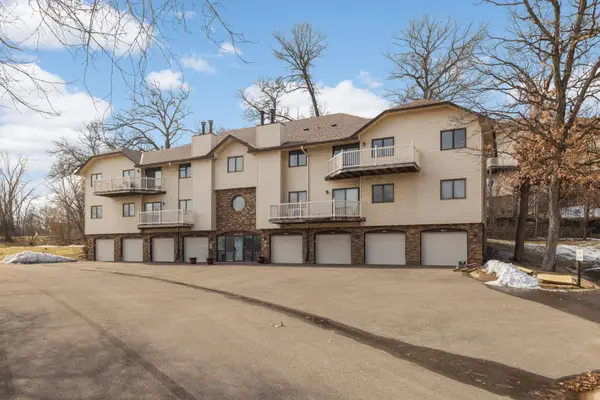 $99,990Active1 beds 1 baths1,100 sq. ft.
4185 Hilltop Point, Eagan, MN 55123
MLS# 7015383Listed by: RE/MAX RESULTS $99,990Active1 beds 1 baths1,100 sq. ft.
4185 Hilltop Point, Eagan, MN 55123
MLS# 7015383Listed by: RE/MAX RESULTS $150,000Active1 beds 1 baths683 sq. ft.
3440 Golfview Drive #211, Saint Paul, MN 55123
MLS# 7009207Listed by: COLDWELL BANKER REALTY $462,120Active3 beds 3 baths2,498 sq. ft.
3481 Trails End Circle, Eagan, MN 55123
MLS# 7030012Listed by: LENNAR SALES CORP $462,120Active3 beds 3 baths1,719 sq. ft.
3481 Trails End Circle, Eagan, MN 55123
MLS# 7030012Listed by: LENNAR SALES CORP $484,755Pending3 beds 3 baths1,831 sq. ft.
3479 Trails End Circle, Eagan, MN 55123
MLS# 7041277Listed by: LENNAR SALES CORP- Open Sat, 4 to 5pm
 $448,420Active3 beds 3 baths1,772 sq. ft.
3472 Trails End Circle, Eagan, MN 55123
MLS# 7029786Listed by: LENNAR SALES CORP  $463,445Active3 beds 3 baths1,714 sq. ft.
3470 Trails End Circle, Eagan, MN 55123
MLS# 7029904Listed by: LENNAR SALES CORP- Open Sat, 4 to 5pm
 $448,420Active3 beds 3 baths1,772 sq. ft.
3472 Trails End Circle, Eagan, MN 55123
MLS# 7029786Listed by: LENNAR SALES CORP  $463,445Active3 beds 3 baths1,714 sq. ft.
3470 Trails End Circle, Eagan, MN 55123
MLS# 7029904Listed by: LENNAR SALES CORP $475,000Pending3 beds 4 baths2,005 sq. ft.
4190 Braddock Trail, Eagan, MN 55123
MLS# 7024228Listed by: RE/MAX RESULTS $150,000Active1 beds 1 baths683 sq. ft.
3440 Golfview Drive #211, Eagan, MN 55123
MLS# 7009207Listed by: COLDWELL BANKER REALTY $825,000Pending6 beds 4 baths4,107 sq. ft.
4731 Prairie Dunes Way, Eagan, MN 55123
MLS# 7025086Listed by: EDINA REALTY, INC. $950,000Pending6 beds 5 baths5,918 sq. ft.
3852 Big Timber Trail, Eagan, MN 55123
MLS# 7027180Listed by: KELLER WILLIAMS SELECT REALTY $1,395,000Pending5 beds 5 baths5,064 sq. ft.
752 Summerbrooke Circle, Eagan, MN 55123
MLS# 7011735Listed by: COLDWELL BANKER REALTY $624,900Active4 beds 3 baths2,649 sq. ft.
625 Mcfaddens Trail, Eagan, MN 55123
MLS# 6819399Listed by: COLDWELL BANKER REALTY $260,000Pending2 beds 2 baths1,319 sq. ft.
1180 Timbershore Lane, Eagan, MN 55123
MLS# 7013500Listed by: EDINA REALTY, INC.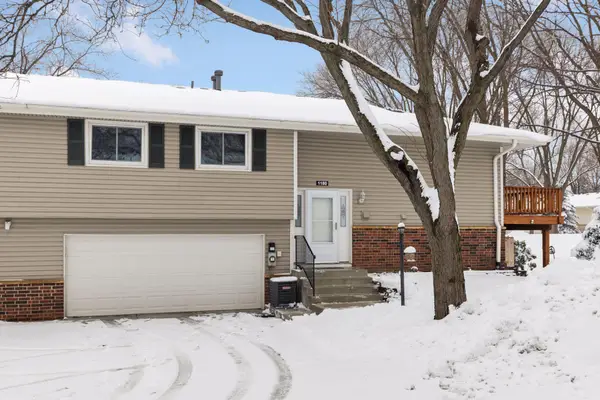 $260,000Pending2 beds 2 baths1,382 sq. ft.
1180 Timbershore Lane, Saint Paul, MN 55123
MLS# 7013500Listed by: EDINA REALTY, INC. $509,000Pending5 beds 3 baths2,226 sq. ft.
4401 Braddock Trail, Eagan, MN 55123
MLS# 7026540Listed by: FRIEMANN REAL ESTATE SERVICES, INC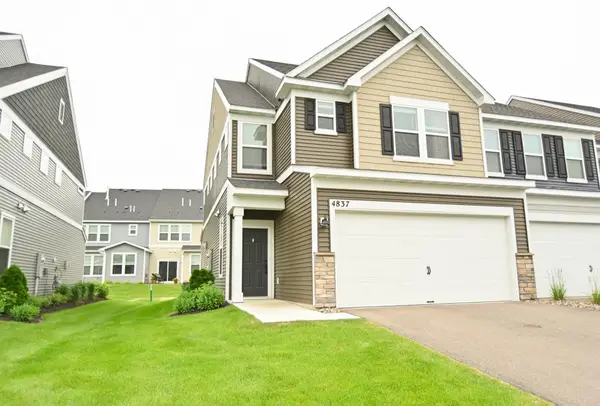 $399,000Pending3 beds 3 baths1,993 sq. ft.
4837 Avery Court, Eagan, MN 55123
MLS# 7026721Listed by: PICHE & ASSOCIATES REAL ESTATE $399,000Pending3 beds 3 baths1,993 sq. ft.
4837 Avery Court, Saint Paul, MN 55123
MLS# 7026721Listed by: PICHE & ASSOCIATES REAL ESTATE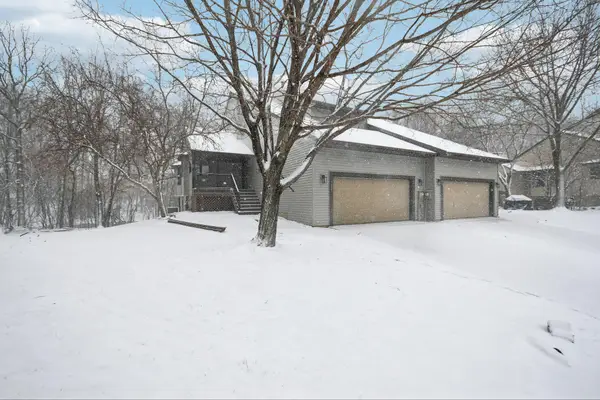 $339,900Active3 beds 4 baths2,745 sq. ft.
3690 Widgeon Way, Eagan, MN 55123
MLS# 7023497Listed by: EPIQUE REALTY $392,500Active3 beds 3 baths1,882 sq. ft.
4876 Avery Court, Eagan, MN 55123
MLS# 7024188Listed by: EDINA REALTY, INC.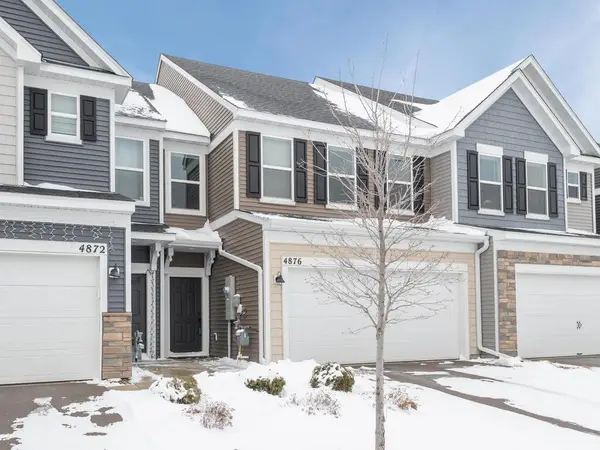 $392,500Active3 beds 3 baths1,882 sq. ft.
4876 Avery Court, Eagan, MN 55123
MLS# 7024188Listed by: EDINA REALTY, INC. $339,900Active3 beds 4 baths2,745 sq. ft.
3690 Widgeon Way, Eagan, MN 55123
MLS# 7023497Listed by: EPIQUE REALTY- Open Sun, 11am to 1pm
 $425,000Active3 beds 3 baths2,076 sq. ft.
4921 Avery Court, Eagan, MN 55123
MLS# 7011692Listed by: COLDWELL BANKER REALTY - LAKES - Open Sun, 11am to 1pm
 $425,000Active3 beds 3 baths2,076 sq. ft.
4921 Avery Court, Saint Paul, MN 55123
MLS# 7011692Listed by: COLDWELL BANKER REALTY - LAKES  $389,900Active3 beds 3 baths1,892 sq. ft.
4860 Avery Court, Eagan, MN 55123
MLS# 7021214Listed by: COLDWELL BANKER REALTY $389,900Active3 beds 3 baths1,892 sq. ft.
4860 Avery Court, Saint Paul, MN 55123
MLS# 7021214Listed by: COLDWELL BANKER REALTY- Open Sat, 10am to 12pm
 $350,000Active1 beds 2 baths1,573 sq. ft.
877 Ivy Lane, Saint Paul, MN 55123
MLS# 7017714Listed by: COLDWELL BANKER REALTY  $850,000Active5 beds 4 baths3,663 sq. ft.
925 Cliff Road, Eagan, MN 55123
MLS# 6786714Listed by: COLDWELL BANKER REALTY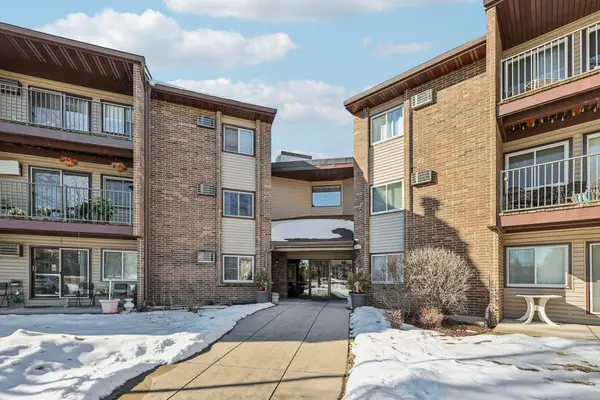 $180,000Pending2 beds 2 baths922 sq. ft.
3425 Golfview Drive #216, Eagan, MN 55123
MLS# 7018392Listed by: RE/MAX ADVANTAGE PLUS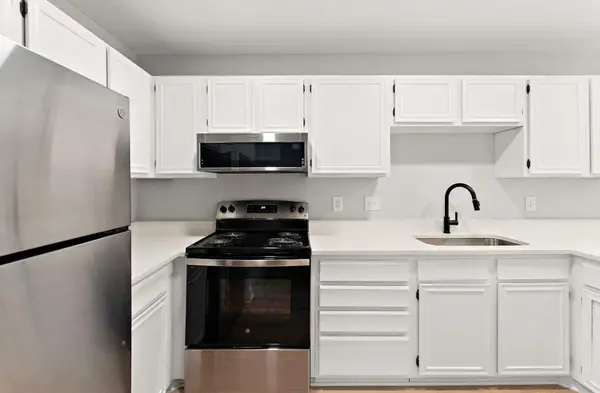 $269,900Active2 beds 2 baths1,335 sq. ft.
1199 Timbershore Lane, Eagan, MN 55123
MLS# 7019050Listed by: RE/MAX ADVANTAGE PLUS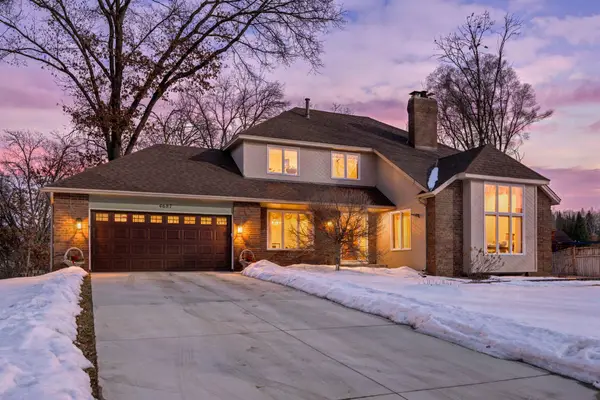 $600,000Pending5 beds 4 baths3,350 sq. ft.
4687 Parkridge Drive, Eagan, MN 55123
MLS# 7000766Listed by: RE/MAX ADVANTAGE PLUS $269,900Active2 beds 2 baths1,335 sq. ft.
1199 Timbershore Lane, Eagan, MN 55123
MLS# 7019050Listed by: RE/MAX ADVANTAGE PLUS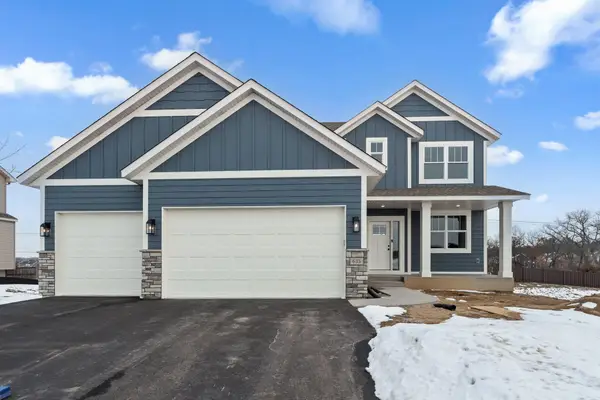 $950,000Pending4 beds 3 baths2,729 sq. ft.
631 Parkside Court, Eagan, MN 55123
MLS# 7019611Listed by: THORSON REALTY, INC. $525,000Pending4 beds 3 baths2,738 sq. ft.
3710 Greensboro Drive, Eagan, MN 55123
MLS# 7019881Listed by: EXP REALTY $150,000Pending0.58 Acres
631 Parkside Court, Saint Paul, MN 55123
MLS# 7019255Listed by: THORSON REALTY, INC. $150,000Pending0.58 Acres
631 Parkside Court, Eagan, MN 55123
MLS# 7019255Listed by: THORSON REALTY, INC.- Open Sat, 12 to 2pm
 $380,000Active3 beds 3 baths1,887 sq. ft.
4832 Avery Court, Eagan, MN 55123
MLS# 7018027Listed by: BALHURST REALTY LLC - Open Sat, 12 to 2pm
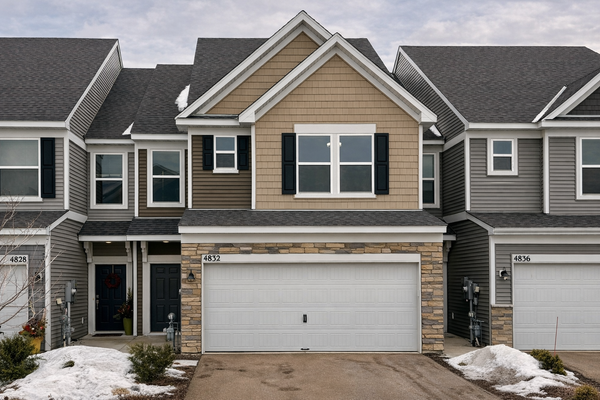 $380,000Active3 beds 3 baths1,887 sq. ft.
4832 Avery Court, Saint Paul, MN 55123
MLS# 7018027Listed by: BALHURST REALTY LLC  $180,000Pending2 beds 2 baths922 sq. ft.
3425 Golfview Drive #216, Eagan, MN 55123
MLS# 7018392Listed by: RE/MAX ADVANTAGE PLUS $375,000Active2 beds 2 baths1,812 sq. ft.
809 Ivy Lane, Saint Paul, MN 55123
MLS# 7013299Listed by: RE/MAX RESULTS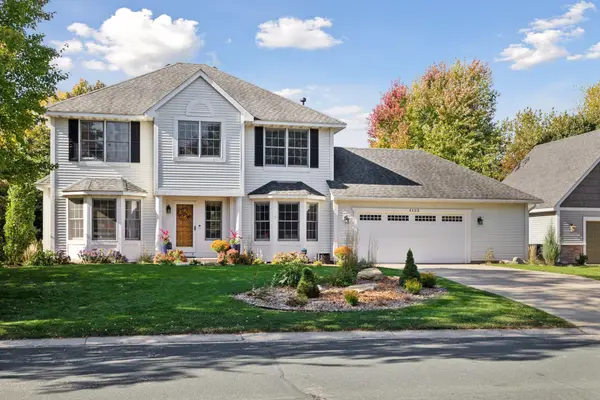 $639,900Pending4 beds 4 baths3,410 sq. ft.
4133 Countryview Drive, Eagan, MN 55123
MLS# 7015781Listed by: COLDWELL BANKER REALTY $375,000Active2 beds 2 baths1,812 sq. ft.
809 Ivy Lane, Eagan, MN 55123
MLS# 7013299Listed by: RE/MAX RESULTS $252,000Pending2 beds 2 baths1,202 sq. ft.
1249 Timbershore Lane #407, Eagan, MN 55123
MLS# 6812049Listed by: COLDWELL BANKER REALTY $252,000Pending2 beds 2 baths1,764 sq. ft.
1249 Timbershore Lane #407, Saint Paul, MN 55123
MLS# 6812049Listed by: COLDWELL BANKER REALTY $210,000Pending2 beds 1 baths1,050 sq. ft.
3563 Blue Jay Way #200, Saint Paul, MN 55123
MLS# 7008385Listed by: RE/MAX RESULTS $210,000Pending2 beds 1 baths1,050 sq. ft.
3563 Blue Jay Way #200, Eagan, MN 55123
MLS# 7008385Listed by: RE/MAX RESULTS $420,000Active4 beds 2 baths1,680 sq. ft.
3914 Westbury Trail, Saint Paul, MN 55123
MLS# 7004876Listed by: BRIDGE REALTY, LLC $249,900Pending2 beds 2 baths1,302 sq. ft.
1302 Crestridge Lane N, Eagan, MN 55123
MLS# 7018823Listed by: RE/MAX RESULTS $249,900Pending2 beds 2 baths1,351 sq. ft.
1302 Crestridge Lane N, Eagan, MN 55123
MLS# 7018823Listed by: RE/MAX RESULTS $290,000Active0.54 Acres
3998 Haven Woods Court, Saint Paul, MN 55123
MLS# 7003068Listed by: GOOD MOVE REALTY $239,900Active2 beds 2 baths1,268 sq. ft.
3612 Saint Francis Way #H, Eagan, MN 55123
MLS# 6826253Listed by: CENTRAL MN REALTY LLC $399,000Active3 beds 2 baths2,720 sq. ft.
3424 Eagan Oaks Court, Saint Paul, MN 55123
MLS# 6817782Listed by: RE/MAX RESULTS $399,000Active3 beds 2 baths2,472 sq. ft.
3424 Eagan Oaks Court, Eagan, MN 55123
MLS# 6817782Listed by: RE/MAX RESULTS $399,000Pending3 beds 3 baths1,800 sq. ft.
1112 Station Trail, Eagan, MN 55123
MLS# 6815836Listed by: COLDWELL BANKER REALTY - SOUTHWEST REGIONAL- Open Sat, 12 to 6pm
 $1,195,000Active4 beds 4 baths3,539 sq. ft.
4950 Parkside Circle, Eagan, MN 55123
MLS# 6815163Listed by: THORSON REALTY, INC.  $145,000Active0.21 Acres
617 Remington Court, Saint Paul, MN 55123
MLS# 6810701Listed by: RE/MAX ADVANTAGE PLUS $145,000Active0.24 Acres
637 Remington Court, Saint Paul, MN 55123
MLS# 6810703Listed by: RE/MAX ADVANTAGE PLUS $977,465Pending5 beds 4 baths3,618 sq. ft.
4982 Dodd Road, Eagan, MN 55123
MLS# 6810733Listed by: THORSON REALTY, INC. $1,067,212Active3 beds 3 baths3,338 sq. ft.
4951 Parkside Circle, Eagan, MN 55123
MLS# 6794325Listed by: PRANDIUM GROUP REAL ESTATE $1,164,500Active4 beds 4 baths4,771 sq. ft.
4938 Parkside Circle, Eagan, MN 55123
MLS# 6794261Listed by: PRANDIUM GROUP REAL ESTATE $172,000Active1 beds 1 baths820 sq. ft.
3557 Blue Jay Way #102, Eagan, MN 55123
MLS# 6792703Listed by: MIDWEST REALTY NETWORK $172,000Active1 beds 1 baths820 sq. ft.
3557 Blue Jay Way #102, Saint Paul, MN 55123
MLS# 6792703Listed by: MIDWEST REALTY NETWORK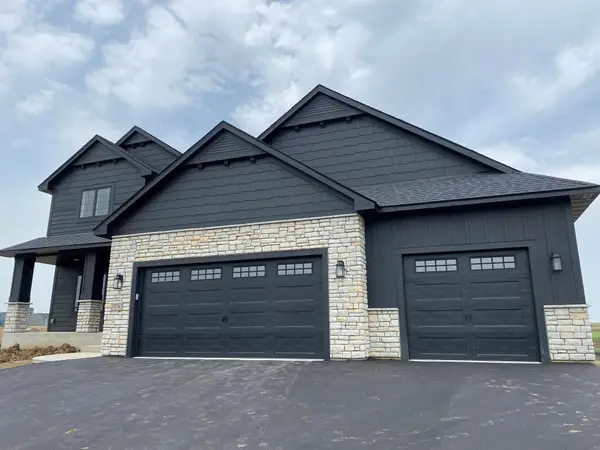 $981,599Active4 beds 4 baths3,927 sq. ft.
4928 Parkside Circle, Eagan, MN 55123
MLS# 6793713Listed by: PRANDIUM GROUP REAL ESTATE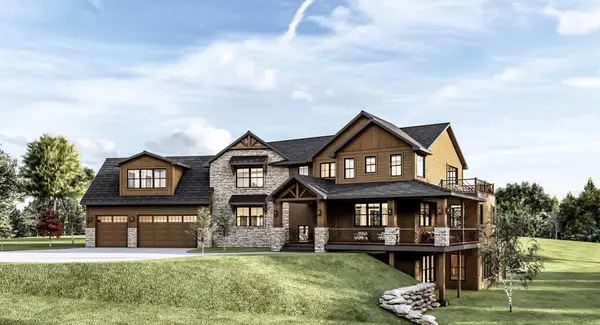 $2,617,830Active5 beds 6 baths7,640 sq. ft.
935 Lakewood Hills Road, Eagan, MN 55123
MLS# 6788358Listed by: RE/MAX RESULTS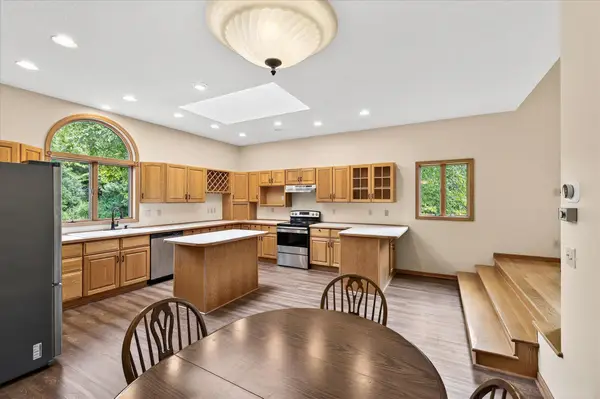 $875,000Active4 beds 3 baths3,679 sq. ft.
1310 Deerwood Drive, Saint Paul, MN 55123
MLS# 6709547Listed by: EDINA REALTY, INC.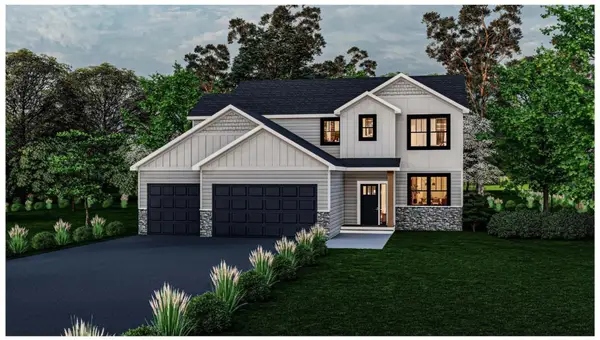 $839,900Active5 beds 4 baths4,009 sq. ft.
635 Parkside Court, Eagan, MN 55123
MLS# 6780921Listed by: THORSON REALTY, INC. $468,900Pending4 beds 3 baths2,926 sq. ft.
1227 Flicker Circle, Saint Paul, MN 55123
MLS# 6715888Listed by: KELLER WILLIAMS PREFERRED RLTY $1,399,000Active4 beds 4 baths3,577 sq. ft.
4001 Haven Woods Court, Saint Paul, MN 55123
MLS# 6757816Listed by: RE/MAX RESULTS $260,000Pending0.32 Acres
4978 Dodd Road, Eagan, MN 55123
MLS# 6719494Listed by: EXP REALTY $260,000Active0.35 Acres
4955 Parkside Circle, Eagan, MN 55123
MLS# 6719642Listed by: EXP REALTY $357,000Active2 beds 3 baths2,418 sq. ft.
3683 Widgeon Way, Eagan, MN 55123
MLS# 7026692Listed by: COLDWELL BANKER REALTY - SOUTHWEST REGIONAL $299,900Pending2 beds 2 baths1,892 sq. ft.
893 Ivy Lane, Eagan, MN 55123
MLS# 6697997Listed by: FISH MLS REALTY $317,500Pending4 beds 2 baths2,184 sq. ft.
4445 Lynx Court, Eagan, MN 55123
MLS# 6698490Listed by: RE/MAX ADVANTAGE PLUS $379,990Pending3 beds 3 baths1,883 sq. ft.
4865 Avery Court, Eagan, MN 55123
MLS# 6402414Listed by: PULTE HOMES OF MINNESOTA, LLC $829,900Active5 beds 3 baths3,368 sq. ft.
4927 Parkside Circle, Eagan, MN 55123
MLS# 6532038Listed by: EXP REALTY $839,900Active5 beds 4 baths3,740 sq. ft.
636 Parkside Court, Eagan, MN 55123
MLS# 6532040Listed by: EXP REALTY
Local realty services provided by:CENTURY 21 FM Realty
Popular searches near 55123
Popular neighborhoods near 55123
- Apple Valley, Apple Valley homes for sale
- Baker - Annapolis, Saint Paul homes for sale
- Bloomfield, Rosemount homes for sale
- Cobblestone Lake, Apple Valley homes for sale
- Coventry Pass, Eagan homes for sale
- Crossroads, Lakeville homes for sale
- Diamond Path, Apple Valley homes for sale
- Foxborough, Lakeville homes for sale
- Highland, Saint Paul homes for sale
- Meadows of Bloomfield, Rosemount homes for sale
- Minnehaha, Minneapolis homes for sale
- Morningview, Apple Valley homes for sale
- Morris Park, Minneapolis homes for sale
- Northeast Richfield, Minneapolis homes for sale
- Palomino Hills, Apple Valley homes for sale
- South Park, South Saint Paul homes for sale
- Southeast Richfield, Minneapolis homes for sale
- Wenonah, Minneapolis homes for sale
- West Seventh, Saint Paul homes for sale
- Wood Park, Burnsville homes for sale
Counties near Eagan, 55123
- Anoka County homes for sale
- Carver County homes for sale
- Chisago County homes for sale
- Dakota County homes for sale
- Dodge County homes for sale
- Goodhue County homes for sale
- Hennepin County homes for sale
- Isanti County homes for sale
- Le Sueur County homes for sale
- McLeod County homes for sale
- Pepin County homes for sale
- Pierce County homes for sale
- Ramsey County homes for sale
- Rice County homes for sale
- St. Croix County homes for sale
- Scott County homes for sale
- Sherburne County homes for sale
- Steele County homes for sale
- Washington County homes for sale
- Wright County homes for sale
Protect your home and budget from life's surprises with an Assurant Home Warranty, backed by a partner that supports you through every step of homeownership. Explore Plans.
©2026 Century 21 Real Estate LLC. All rights reserved. CENTURY 21®, the CENTURY 21 Logo and C21® are service marks owned by Century 21 Real Estate LLC. Century 21 Real Estate LLC fully supports the principles of the Fair Housing Act and the Equal Opportunity Act. Each office is independently owned and operated. Listing information is deemed reliable but not guaranteed accurate.