- Cottonwood, Rockford homes for sale
- Deere Valley, Moline homes for sale
- Downtown Bettendorf, Bettendorf homes for sale
- East End, Moline homes for sale
- Edgewater, Rockford homes for sale
- Edgewood, Bettendorf homes for sale
- Forest Hill, Moline homes for sale
- Greater Homewood, Moline homes for sale
- Jackson Oaks, Rockford homes for sale
- Keith Creek, Rockford homes for sale
- Midtown District, Rockford homes for sale
- North Highland, Rockford homes for sale
- Northwest United, Rockford homes for sale
- Park Hill, Moline homes for sale
- Rockview Estates, Moline homes for sale
- Rolling Green, Rockford homes for sale
- Signal Hill, Rockford homes for sale
- Southeast Helping Hands, Rockford homes for sale
- Swifft, Rockford homes for sale
- West Gateway Coalition, Rockford homes for sale
Sterling, IL - homes for sale
47 of 47 results displayed
- New
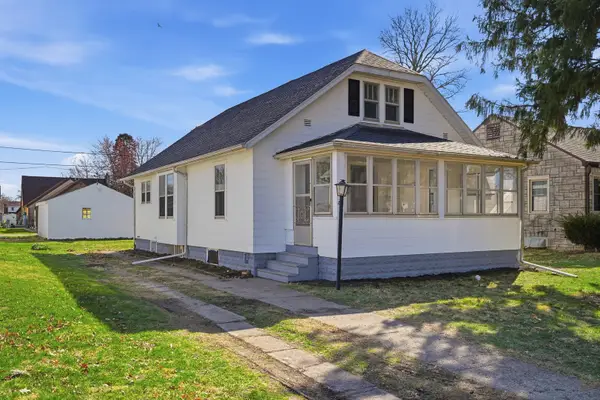 $162,900Active3 beds 1 baths1,413 sq. ft.
507 W 12th Street, Sterling, IL 61081
MLS# 12603866Listed by: RE/MAX SAUK VALLEY
- New
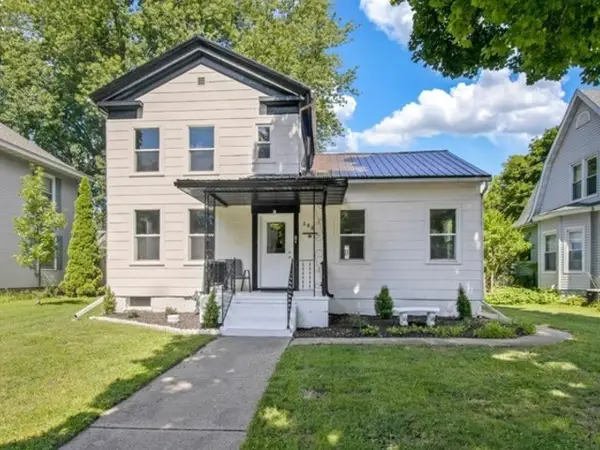 $159,900Active3 beds 2 baths1,482 sq. ft.
306 11th Avenue, Sterling, IL 61081
MLS# 12590612Listed by: CM REALTORS - New
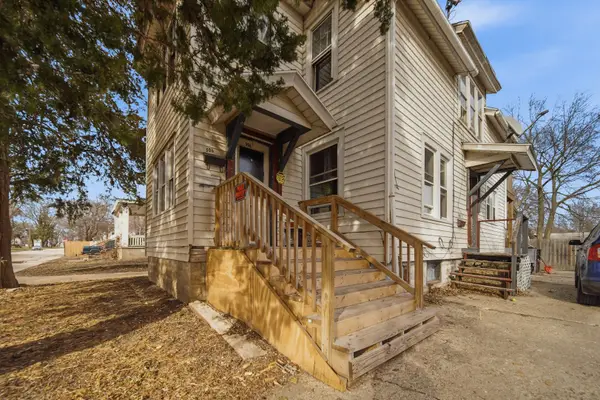 $79,900Active4 beds 2 baths
506 Ave F, Sterling, IL 61081
MLS# 12600671Listed by: RE/MAX OF ROCK VALLEY - New
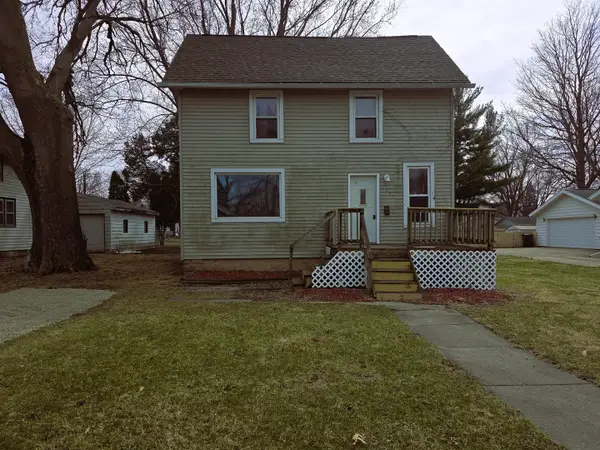 $107,900Active3 beds 2 baths1,587 sq. ft.
705 8th Street, Sterling, IL 61081
MLS# 12601631Listed by: BIRD REALTY - New
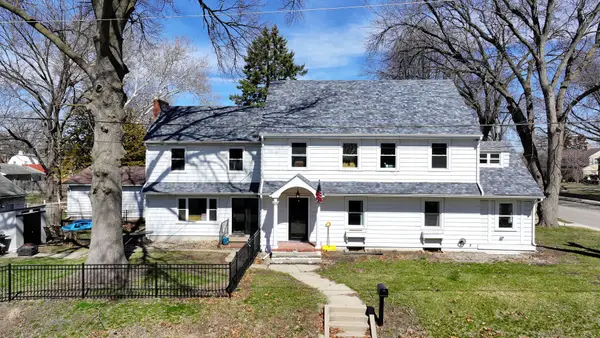
 $174,900Active6 beds 4 baths
607 2nd Avenue, Sterling, IL 61081
MLS# 12601312Listed by: RE/MAX SAUK VALLEY - New
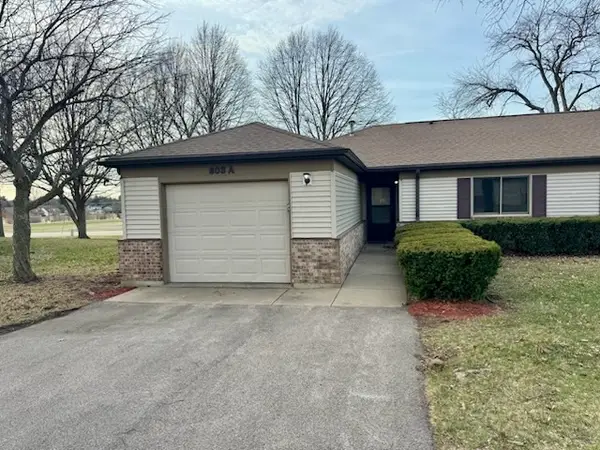 $139,900Active2 beds 1 baths980 sq. ft.
803A Coventry Lane, Sterling, IL 61081
MLS# 12601235Listed by: RE/MAX SAUK VALLEY - New
 $350,000Active5 beds 3 baths3,049 sq. ft.
1501 1st Avenue, Sterling, IL 61081
MLS# 12600145Listed by: RE/MAX SAUK VALLEY 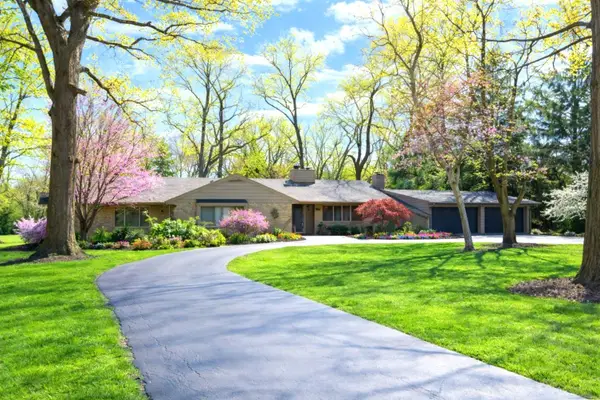 $465,000Pending4 beds 4 baths2,973 sq. ft.
1316 Mineral Springs Road, Sterling, IL 61081
MLS# 12594048Listed by: JUDY POWELL REALTY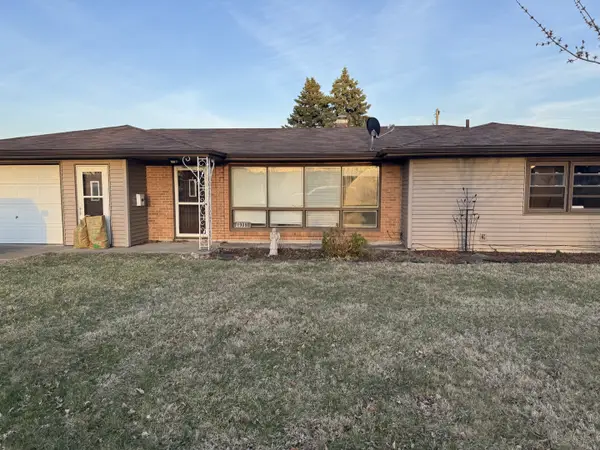 $137,500Pending3 beds 1 baths1,200 sq. ft.
1908 22nd Avenue, Sterling, IL 61081
MLS# 12599894Listed by: BARDIER & RAMIREZ REAL ESTATE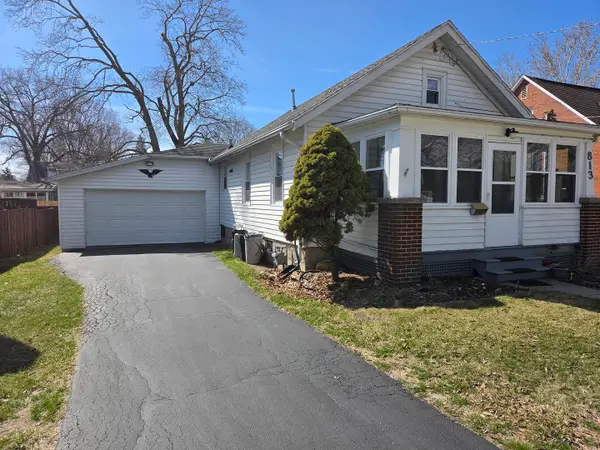 $132,500Pending3 beds 2 baths1,176 sq. ft.
813 E 15th Street, Sterling, IL 61081
MLS# 12599697Listed by: XTREME REALTY $124,900Pending3 beds 1 baths870 sq. ft.
811 W 19th Street, Sterling, IL 61081
MLS# 12594635Listed by: COLDWELL BANKER HOWES & JEFFERIES REALTORS $189,000Active4 beds 3 baths1,818 sq. ft.
612 15th Avenue, Sterling, IL 61081
MLS# 12594106Listed by: RIVER COUNTRY PROPERTIES $142,000Pending3 beds 2 baths1,292 sq. ft.
608 4th Avenue, Sterling, IL 61081
MLS# 12592225Listed by: RE/MAX SAUK VALLEY $139,900Pending3 beds 1 baths977 sq. ft.
1308 Douglas Drive, Sterling, IL 61081
MLS# 12590869Listed by: IFIND PROPERTIES LLC $189,900Pending3 beds 3 baths2,285 sq. ft.
802 E 19th Street, Sterling, IL 61081
MLS# 12589087Listed by: BARDIER & RAMIREZ REAL ESTATE $147,000Active3 beds 2 baths
212 E 10th Street, Sterling, IL 61081
MLS# 12589050Listed by: BARDIER & RAMIREZ REAL ESTATE $124,900Pending3 beds 2 baths1,258 sq. ft.
3912 Emerson Road, Sterling, IL 61081
MLS# 12588253Listed by: RE/MAX SAUK VALLEY $120,000Pending2 beds 1 baths734 sq. ft.
507 Oak Avenue, Sterling, IL 61081
MLS# 12585348Listed by: RE/MAX SAUK VALLEY $139,900Pending3 beds 1 baths1,430 sq. ft.
1804 Ave K, Sterling, IL 61081
MLS# 12584621Listed by: RE/MAX SAUK VALLEY $190,000Pending3 beds 2 baths1,484 sq. ft.
2212 12th Avenue, Sterling, IL 61081
MLS# 12580880Listed by: UNITED COUNTRY SAUK VALLEY REALTY $124,900Pending3 beds 1 baths1,000 sq. ft.
1702 Oak Grove Avenue, Sterling, IL 61081
MLS# 12579996Listed by: KETTLEY & COMPANY $149,900Pending2 beds 1 baths1,218 sq. ft.
1825 18th Avenue, Sterling, IL 61081
MLS# 12577374Listed by: RE/MAX SAUK VALLEY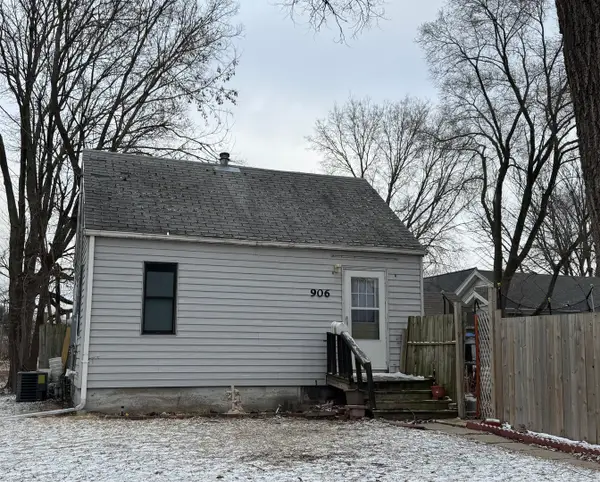 $40,000Pending2 beds 1 baths423 sq. ft.
906 Avenue G, Sterling, IL 61081
MLS# 12572292Listed by: UNITED COUNTRY SAUK VALLEY REALTY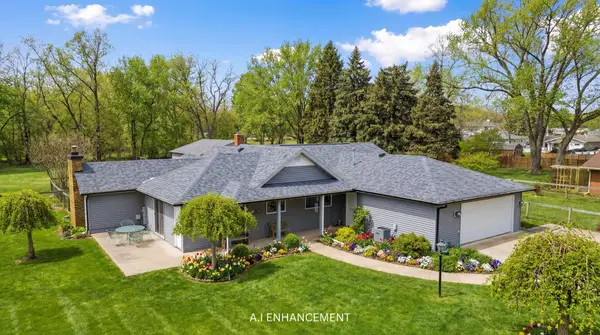 $340,000Active3 beds 2 baths1,592 sq. ft.
1307 Sinnissippi Park Road, Sterling, IL 61081
MLS# 12571554Listed by: RE/MAX SAUK VALLEY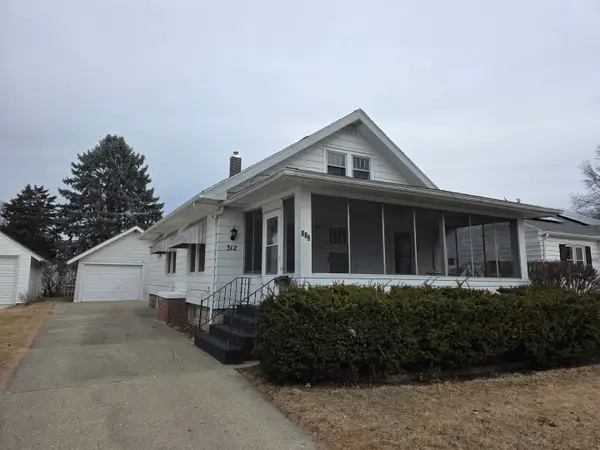 $109,900Pending3 beds 2 baths1,421 sq. ft.
312 E 11th Street, Sterling, IL 61081
MLS# 12570561Listed by: RE/MAX SAUK VALLEY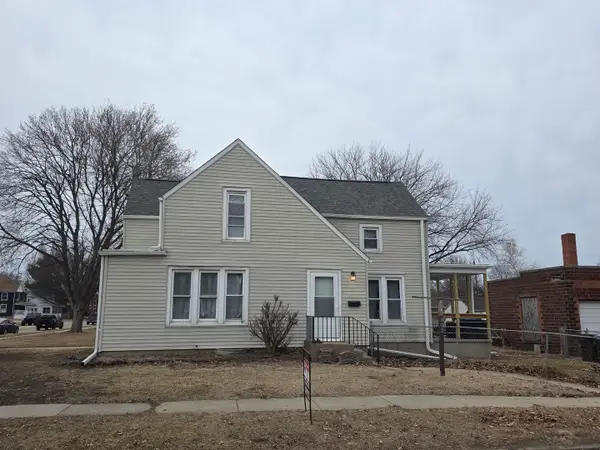 $97,500Active3 beds 2 baths1,572 sq. ft.
802 E 5th Street, Sterling, IL 61081
MLS# 12564655Listed by: RE/MAX SAUK VALLEY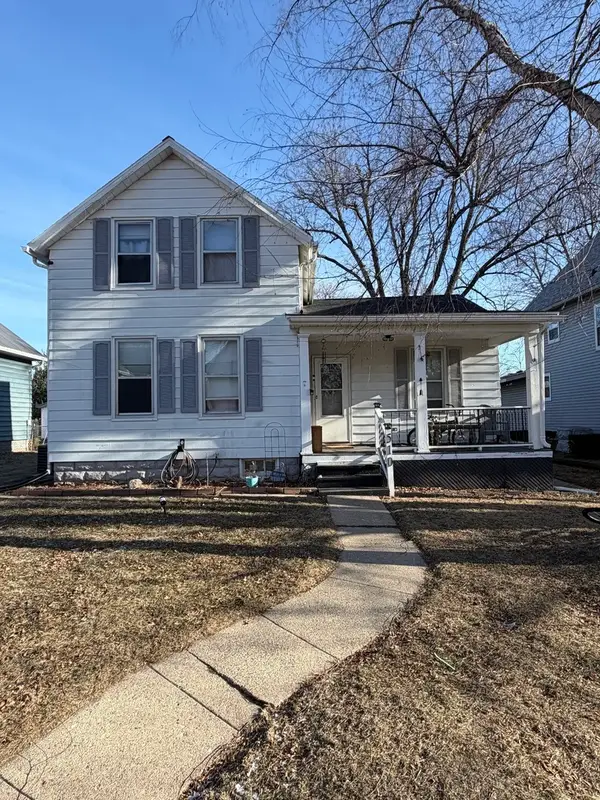 $85,900Active3 beds 1 baths1,260 sq. ft.
510 12th Avenue, Sterling, IL 61081
MLS# 12557287Listed by: NEXTHOME FIRST CLASS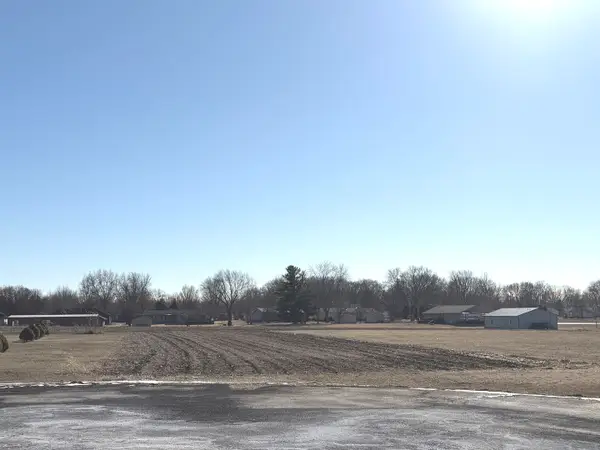 $259,000Active-- beds -- baths
0 Deer Run, Sterling, IL 61081
MLS# 12556635Listed by: RE/MAX SAUK VALLEY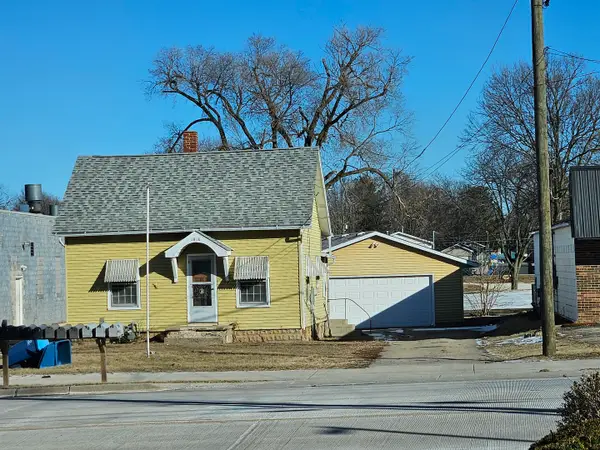 $175,000Active1 beds 1 baths588 sq. ft.
1816 Locust Street, Sterling, IL 61081
MLS# 12557450Listed by: UNITED COUNTRY SAUK VALLEY REALTY $180,000Active3 beds 2 baths1,600 sq. ft.
2408 16th Avenue, Sterling, IL 61081
MLS# 12552223Listed by: KOPHAMER & BLEAN REALTY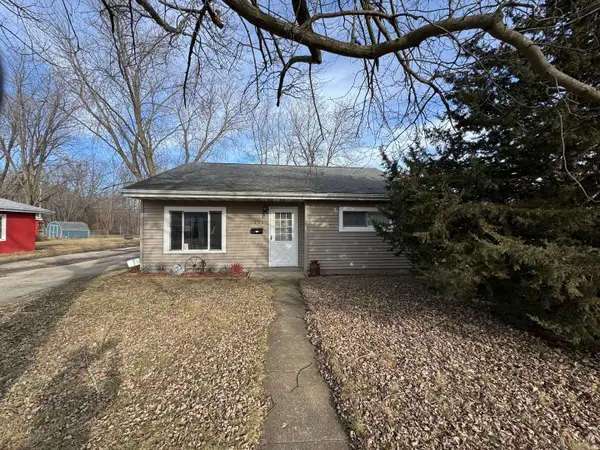 $112,900Active3 beds 1 baths988 sq. ft.
1206 Harvey Drive, Sterling, IL 61081
MLS# 12541697Listed by: UNITED REAL ESTATE - CHICAGO $98,900Pending3 beds 1 baths1,096 sq. ft.
2202 Chestnut Avenue, Sterling, IL 61081
MLS# 12537906Listed by: UNITED COUNTRY SAUK VALLEY REALTY $249,900Active4 beds 2 baths2,176 sq. ft.
412 W 9th Street, Sterling, IL 61081
MLS# 12537237Listed by: BARR AGENCY, INC $185,000Active5 beds 2 baths2,732 sq. ft.
802 4th Street W, Sterling, IL 61081
MLS# QC4265385Listed by: COLDWELL BANKER HOWES & JEFFERIES REALTORS $18,000Active0 Acres
0000 Hubbard Road, Sterling, IL 61081
MLS# 12512515Listed by: JUDY POWELL REALTY $69,900Active3 beds 1 baths1,196 sq. ft.
410 W 5th Street, Sterling, IL 61081
MLS# 12509788Listed by: CRAWFORD REALTY, LLC $4,500Active0 Acres
0 E 4th Street, Sterling, IL 61081
MLS# 12505076Listed by: RE/MAX SAUK VALLEY $165,000Pending5 beds 1 baths1,770 sq. ft.
910 W 19th Street, Sterling, IL 60181
MLS# 12460193Listed by: BIRD REALTY $179,500Pending4 beds 2 baths2,247 sq. ft.
401 W 10th Street, Sterling, IL 61081
MLS# 12471665Listed by: UNITED REAL ESTATE - CHICAGO $541,000Active3 beds 2 baths1,545 sq. ft.
905 E 21st Street, Sterling, IL 61081
MLS# 12457931Listed by: RE/MAX SAUK VALLEY $150,000Active-- beds -- baths
0 Science Ridge Road, Sterling, IL 61081
MLS# 12416381Listed by: RE/MAX SAUK VALLEY $169,900Active4 beds 2 baths1,780 sq. ft.
1107 Locust Street, Sterling, IL 61081
MLS# 12311156Listed by: RE/MAX SAUK VALLEY $16,000Active0 Acres
Lot 403 E 21st Street, Sterling, IL 61081
MLS# 12285367Listed by: RE/MAX SAUK VALLEY $295,000Active2 Acres
0 E Lincolnway, Sterling, IL 61081
MLS# 12284937Listed by: RE/MAX SAUK VALLEY $449,900Active6 beds 5 baths3,984 sq. ft.
1275 Winn Road, Sterling, IL 61081
MLS# 12092335Listed by: RE/MAX SAUK VALLEY $69,900Active5 beds 2 baths
601 8th Avenue, Sterling, IL 61081
MLS# 12595504Listed by: RE/MAX OF ROCK VALLEY $13,500Active0.4 Acres
Lot 1 E 19th Street, Sterling, IL 61081
MLS# 12285275Listed by: RE/MAX SAUK VALLEY
Local realty services provided by:CENTURY 21 Circle
Copyright 2026 Midwest Real Estate Data LLC. All rights reserved. The data relating to real estate for sale on this web site comes in part from the Broker Reciprocity Program of the Midwest Real Estate Data LLC. Listing information is deemed reliable but not guaranteed.
Neighborhoods near Sterling, IL
Zip codes near Sterling, IL
- 61006 homes for sale
- 61021 homes for sale
- 61030 homes for sale
- 61046 homes for sale
- 61051 homes for sale
- 61054 homes for sale
- 61061 homes for sale
- 61064 homes for sale
- 61071 homes for sale
- 61081 homes for sale
- 61243 homes for sale
- 61250 homes for sale
- 61252 homes for sale
- 61261 homes for sale
- 61270 homes for sale
- 61277 homes for sale
- 61283 homes for sale
- 61310 homes for sale
- 61367 homes for sale
- 61376 homes for sale
Popular searches near Sterling, IL
- Buffalo homes for sale
- Coloma homes for sale
- Deer Grove homes for sale
- Dixon township homes for sale
- Dixon homes for sale
- Hahnaman homes for sale
- Hopkins homes for sale
- Lyndon homes for sale
- Milledgeville homes for sale
- Montmorency homes for sale
- Morrison homes for sale
- Mount Pleasant homes for sale
- Palmyra homes for sale
- Polo homes for sale
- Rock Falls homes for sale
- South Dixon homes for sale
- Sterling Township homes for sale
- Tampico homes for sale
- Tampico Township homes for sale
- Wysox homes for sale
Protect your home and budget from life's surprises with an Assurant Home Warranty, backed by a partner that supports you through every step of homeownership. Explore Plans.
©2026 Century 21 Real Estate LLC. All rights reserved. CENTURY 21®, the CENTURY 21 Logo and C21® are service marks owned by Century 21 Real Estate LLC. Century 21 Real Estate LLC fully supports the principles of the Fair Housing Act and the Equal Opportunity Act. Each office is independently owned and operated. Listing information is deemed reliable but not guaranteed accurate.