- Blossome Park, San Antonio homes for sale
- Citizens on Alert, San Antonio homes for sale
- Eden, San Antonio homes for sale
- El Chaparral Fertile Valley, San Antonio homes for sale
- El Dorado, San Antonio homes for sale
- Hill Country Village, Hill Country Village homes for sale
- Hills Of Park North, San Antonio homes for sale
- Longs Creek, San Antonio homes for sale
- Lorrence Creek, San Antonio homes for sale
- MacArthur Park, San Antonio homes for sale
- Marymont, San Antonio homes for sale
- North Central Thousand Oaks, San Antonio homes for sale
- North San Antonio, San Antonio homes for sale
- Northern Hills, San Antonio homes for sale
- Oak Grove Estates, San Antonio homes for sale
- Oak Haven Heights, San Antonio homes for sale
- Sun Gate, San Antonio homes for sale
- Valencia, San Antonio homes for sale
- Village North, San Antonio homes for sale
- Woodstone, San Antonio homes for sale
Stone Ridge, San Antonio, TX - homes for sale
16 of 16 results displayed
- New
 $280,000Active3 beds 3 baths1,483 sq. ft.
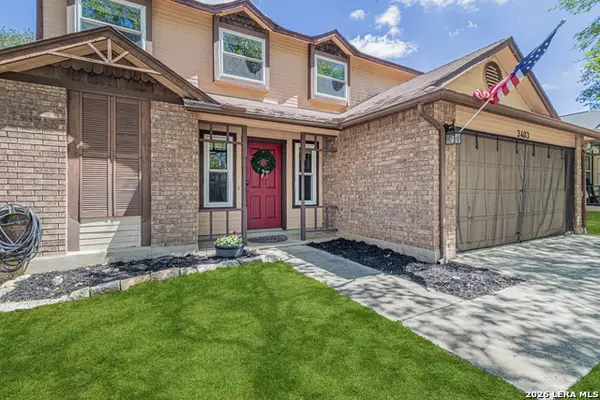
3403 Stoney Country, San Antonio, TX 78247
MLS# 1953795Listed by: KOLB REAL ESTATE LLC - New
 $175,000Active2 beds 2 baths932 sq. ft.
12105 Stoney #12105, San Antonio, TX 78247
MLS# 1953621Listed by: RE/MAX NORTH-SAN ANTONIO  $219,995Active3 beds 2 baths1,062 sq. ft.
12022 Stoney Bridge, San Antonio, TX 78247
MLS# 1949885Listed by: KELLER WILLIAMS CITY-VIEW $210,000Active3 beds 2 baths1,206 sq. ft.
12123 Ridge, San Antonio, TX 78247
MLS# 1949396Listed by: 1ST CHOICE REALTY GROUP $275,000Active3 beds 2 baths1,297 sq. ft.
12127 Stoney Pond, San Antonio, TX 78247
MLS# 1946361Listed by: KELLER WILLIAMS HERITAGE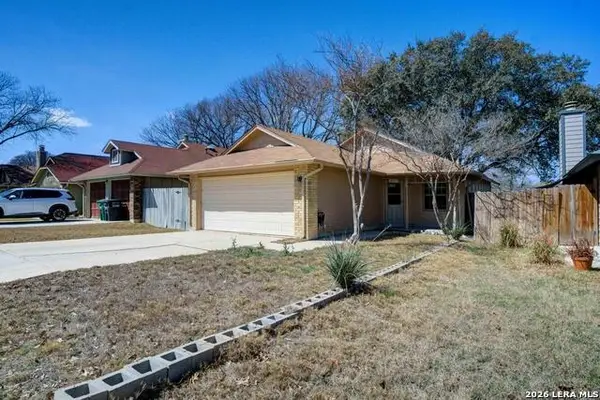 $225,000Active3 beds 3 baths1,346 sq. ft.
12047 Stoney Bridge, San Antonio, TX 78247
MLS# 1944564Listed by: EXP REALTY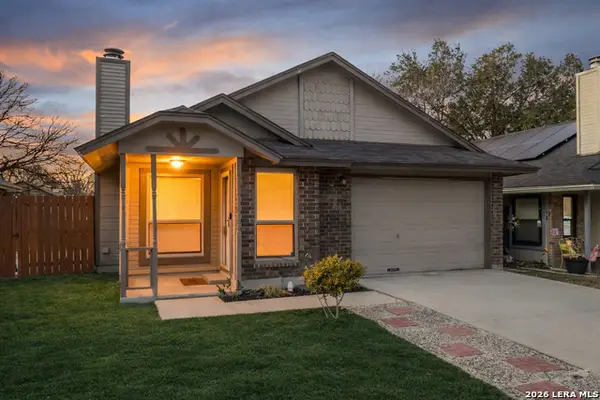 $209,999Active3 beds 1 baths1,067 sq. ft.
12043 Stoney Xing, San Antonio, TX 78247
MLS# 1940289Listed by: REAL BROKER, LLC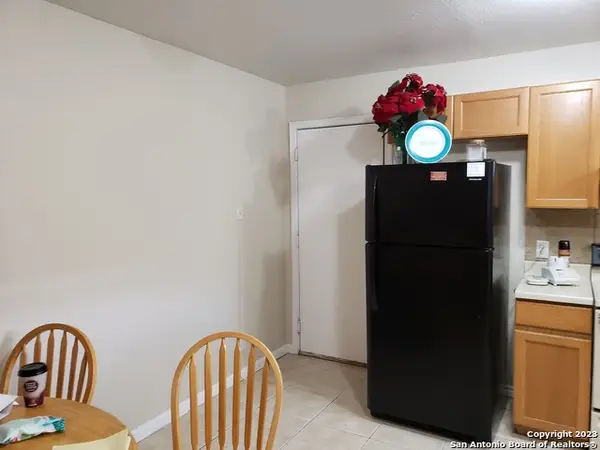 $340,000Active-- beds -- baths2,080 sq. ft.
12227 - 12229 Maverick Bluff, San Antonio, TX 78247
MLS# 1941377Listed by: KELLER WILLIAMS BOERNE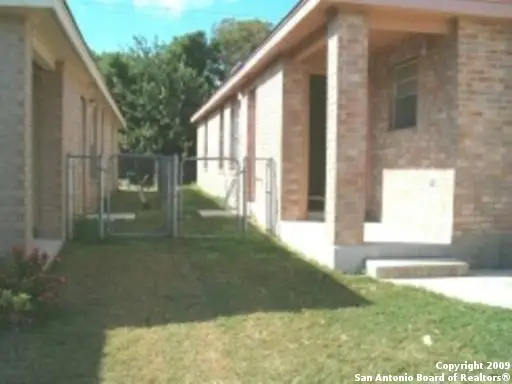 $340,000Active-- beds -- baths2,080 sq. ft.
12231 - 12233 Maverick Bluff, San Antonio, TX 78247
MLS# 1941356Listed by: KELLER WILLIAMS BOERNE $179,900Pending3 beds 1 baths988 sq. ft.
12102 Stoney Falls, San Antonio, TX 78247
MLS# 1936693Listed by: SARA PENA, BROKER $237,000Active3 beds 2 baths1,516 sq. ft.
3675 Ridge Cluster, San Antonio, TX 78247
MLS# 1933715Listed by: HERO FIRST REAL ESTATE, LLC $174,900Pending3 beds 2 baths1,030 sq. ft.
12079 Stoney, San Antonio, TX 78247
MLS# 1932670Listed by: ENTERA REALTY LLC $190,000Pending3 beds 1 baths1,062 sq. ft.
3342 Stoney Square, San Antonio, TX 78247
MLS# 1932152Listed by: EXQUISITE PROPERTIES, LLC $273,000Active3 beds 2 baths1,287 sq. ft.
3322 Stoney Mist, San Antonio, TX 78247
MLS# 1930147Listed by: KELLER WILLIAMS HERITAGE $249,900Pending3 beds 3 baths1,390 sq. ft.
3515 Ridge Knoll St, San Antonio, TX 78247
MLS# 1928187Listed by: KELLER WILLIAMS LEGACY $300,000Active-- beds -- baths2,008 sq. ft.
12235 Ridge Crown, San Antonio, TX 78247
MLS# 1832661Listed by: EUBANKS REALTY
Local realty services provided by:CENTURY 21 Judge Fite Company
Popular neighborhoods near Stone Ridge, San Antonio, TX
Zip codes near Stone Ridge, San Antonio, TX
- 78148 homes for sale
- 78201 homes for sale
- 78209 homes for sale
- 78212 homes for sale
- 78213 homes for sale
- 78216 homes for sale
- 78217 homes for sale
- 78218 homes for sale
- 78219 homes for sale
- 78230 homes for sale
- 78231 homes for sale
- 78232 homes for sale
- 78233 homes for sale
- 78234 homes for sale
- 78239 homes for sale
- 78244 homes for sale
- 78247 homes for sale
- 78248 homes for sale
- 78258 homes for sale
- 78259 homes for sale
Counties near Stone Ridge, San Antonio, TX
- Atascosa County homes for sale
- Bandera County homes for sale
- Bastrop County homes for sale
- Bexar County homes for sale
- Blanco County homes for sale
- Caldwell County homes for sale
- Comal County homes for sale
- DeWitt County homes for sale
- Frio County homes for sale
- Gillespie County homes for sale
- Gonzales County homes for sale
- Guadalupe County homes for sale
- Hays County homes for sale
- Karnes County homes for sale
- Kendall County homes for sale
- Kerr County homes for sale
- Llano County homes for sale
- Medina County homes for sale
- Travis County homes for sale
- Wilson County homes for sale
Protect your home and budget from life's surprises with an Assurant Home Warranty, backed by a partner that supports you through every step of homeownership. Explore Plans.
©2026 Century 21 Real Estate LLC. All rights reserved. CENTURY 21®, the CENTURY 21 Logo and C21® are service marks owned by Century 21 Real Estate LLC. Century 21 Real Estate LLC fully supports the principles of the Fair Housing Act and the Equal Opportunity Act. Each office is independently owned and operated. Listing information is deemed reliable but not guaranteed accurate.