- Benns Church homes for sale
- Berlin and Ivor homes for sale
- Camptown homes for sale
- Carrollton homes for sale
- Carrsville homes for sale
- Chesapeake homes for sale
- Corapeake homes for sale
- Franklin homes for sale
- Gates homes for sale
- Hardy homes for sale
- Haslett homes for sale
- Holly Grove homes for sale
- Ivor homes for sale
- Newport homes for sale
- Portsmouth homes for sale
- Smithfield homes for sale
- Suffolk homes for sale
- Sunbury homes for sale
- Windsor homes for sale
- Zuni homes for sale
Suffolk city County, VA - homes for sale
78 of 78 results displayed
- New
 $70,000Active0.45 Acres
741 Manning Road, Suffolk, VA 23434
MLS# 10643813Listed by: Shaffer Realty LLC - New
 $269,900Active19.55 Acres
Lot 19 Longstreet Lane, Suffolk, VA 23437
MLS# 10643454Listed by: BHHS RW Towne Realty  $5,900Active0.37 Acres
.37 Acre Mineral Spring Road, Suffolk, VA 23438
MLS# 10641871Listed by: Samson Properties $135,000Active11.92 Acres
11.9 Acre Central Suffolk, Suffolk, VA 23434
MLS# 10641872Listed by: Samson Properties $160,000Active0.25 Acres
6232 Old Townpoint Road, Suffolk, VA 23435
MLS# 10640727Listed by: Serhant $275,000Active5 Acres
6701 Crittenden Road, Suffolk, VA 23432
MLS# 10639922Listed by: BHHS RW Towne Realty $75,000Active0 Acres
4999 Clifton Street, Chesapeake, VA 23321
MLS# 10639494Listed by: Own Real Estate LLC $40,000Active0.13 Acres
206 Beech Street, Suffolk, VA 23434
MLS# 10639298Listed by: North End Realty Group $128,000Active0.19 Acres
728 Kilby Avenue, Suffolk, VA 23434
MLS# 10638497Listed by: Atlantic Connection Real Est. $250,000Active18.71 Acres
1101 Cypress Chapel Road, Suffolk, VA 23434
MLS# 10636929Listed by: Howard Hanna Real Estate Svcs.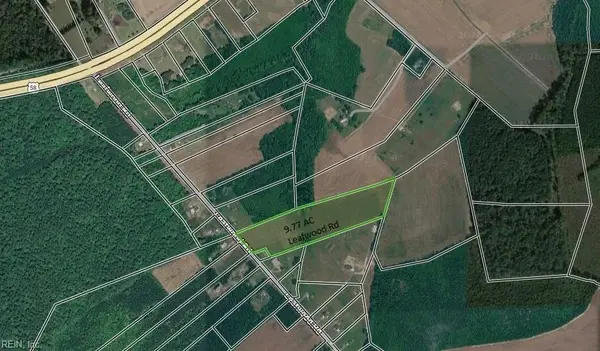 $145,000Active9.77 Acres
9 AC Leafwood Road, Suffolk, VA 23437
MLS# 10635983Listed by: Cross Realty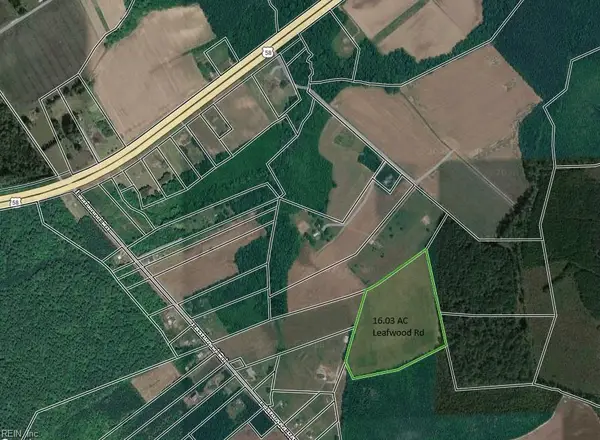 $180,000Active16.03 Acres
16 AC Leafwood Road, Suffolk, VA 23437
MLS# 10635985Listed by: Cross Realty $180,000Active3 Acres
949 Cherry Grove Road N, Suffolk, VA 23432
MLS# 10635168Listed by: Metro Brokers of Hampton Roads $85,000Active0.36 Acres
L38 40 Norfolk Street, Suffolk, VA 23435
MLS# 10631901Listed by: EXP Realty LLC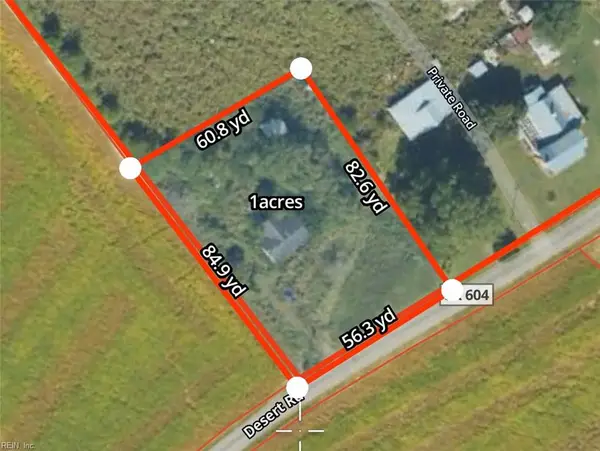 $65,000Active1 Acres
4385 Desert Road, Suffolk, VA 23434
MLS# 10633979Listed by: Fathom Realty $79,900Pending1 Acres
4449 Butler Drive, Suffolk, VA 23437
MLS# 10632708Listed by: KW Coastal Chesapeake Virginia
 $12,000Active0.24 Acres
L. 115 Lee Street, Suffolk, VA 23435
MLS# 10632523Listed by: CENTURY 21 Nachman Realty $24,900Active0.38 Acres
L13,14 Pughsville Road, Suffolk, VA 23435
MLS# 10632536Listed by: CENTURY 21 Nachman Realty $99,900Active10 Acres
801 Brick Yard Road, Emporia, VA 23847
MLS# 10632612Listed by: Howard Hanna Real Estate Svcs. $350,000Pending102 Acres
102 AC Freeman Mill Road, Suffolk, VA 23438
MLS# 10631653Listed by: BHHS RW Towne Realty $60,000Active0 Acres
145 Dutch Road, Suffolk, VA 23437
MLS# 10631644Listed by: Iron Valley Real Estate HR $3,160,000Active37.18 Acres
909 Murphys Mill Road, Suffolk, VA 23434
MLS# 10629799Listed by: Atlantic Sothebys Int'l Realty $48,900Active0.66 Acres
10765 Camp Pond Road, Suffolk, VA 23437
MLS# 10630507Listed by: AQ Realty LLC $55,000Active1.5 Acres
1.5 AC Nansemond Parkway, Suffolk, VA 23435
MLS# 10614499Listed by: Wainwright Real Estate $110,000Active1.33 Acres
1.33ac Kings Highway, Suffolk, VA 23435
MLS# 10629702Listed by: The Real Estate Group $149,900Active0.19 Acres
319 Dutch Road, Suffolk, VA 23437
MLS# 10628697Listed by: LPT Realty LLC $14,000Pending0.39 Acres
0 Hill Street, SUFFOLK, VA 23434
MLS# VASF2000066Listed by: EXIT SUCCESS REALTY $45,000Active0.23 Acres
0.23AC Cove Street, Suffolk, VA 23434
MLS# 10627719Listed by: Iron Valley Real Estate HR $2,200,000Active36.76 Acres
25+AC Holland Road, Suffolk, VA 23434
MLS# 10626465Listed by: BHHS RW Towne Realty $1,500,000Active78.94 Acres
50+AC Hosier Road, Suffolk, VA 23434
MLS# 10626039Listed by: CHJ Realty Inc $110,000Pending2.77 Acres
125 W Liberty Spring Road, Suffolk, VA 23434
MLS# 10626197Listed by: Fathom Realty $90,000Active17.52 Acres
0 Leafwood Rd, SUFFOLK, VA 23437
MLS# VASF2000064Listed by: EXIT SUCCESS REALTY $39,999Active0 Acres
328 N Lloyd Street, Suffolk, VA 23439
MLS# 10624070Listed by: Iron Valley Real Estate HR $120,000Active1 Acres
4200 John (304362300) Street, Suffolk, VA 23435
MLS# 10623006Listed by: Metro Brokers of Hampton Roads- $40,000Active0.18 Acres
L 60 Clifton Street, Suffolk, VA 23435
MLS# 10619764Listed by: John E. Wood Realty Inc. - $40,000Active0.17 Acres
L 54 Clifton Street, Suffolk, VA 23435
MLS# 10620744Listed by: John E. Wood Realty Inc. - $40,000Active0.17 Acres
L 58 Clifton Street, Suffolk, VA 23435
MLS# 10620761Listed by: John E. Wood Realty Inc. - $40,000Active0.16 Acres
L 62 Clifton Street, Suffolk, VA 23435
MLS# 10620767Listed by: John E. Wood Realty Inc.  $40,000Active0.39 Acres
0.39Ac Griffin Land, Suffolk, VA 23435
MLS# 10617118Listed by: Keller Williams Realty Twn Ctr $399,000Pending75.5 Acres
0 Ellis Road, Suffolk, VA 23437
MLS# 2601480Listed by: HUFF LAND AND FORESTRY CONSULTING $49,999Active0.14 Acres
0.14AC E Washington Street, Suffolk, VA 23434
MLS# 10616129Listed by: CENTURY 21 Nachman Realty $55,000Active0 Acres
Lot 59 Bethlehem Street, Suffolk, VA 23434
MLS# 10615570Listed by: CENTURY 21 Nachman Realty $35,000Pending0.25 Acres
5748 Whaleyville Boulevard, Suffolk, VA 23438
MLS# 10614366Listed by: Keller Williams Capital Props. $31,000Active0.12 Acres
20 N 7th Street, Suffolk, VA 23434
MLS# 10614059Listed by: NextHome SLH Real Estate Group $499,000Pending116.86 Acres
6932 Corinth Chapel Road, Suffolk, VA 23437
MLS# 10613936Listed by: Aweigh Real Estate $1,529,900Active21 Acres
21 acr Kings Highway, Suffolk, VA 23432
MLS# 10612836Listed by: United Country - A B Cole&Asc $40,000Pending0.1 Acres
312 Fuller Street, Suffolk, VA 23434
MLS# 10611755Listed by: CENTURY 21 Nachman Realty $20,000Active0.31 Acres
134 Mahan Street, Suffolk, VA 23434
MLS# 10611489Listed by: Howard Hanna Real Estate Svcs. $20,000Active0.1 Acres
136 Mahan Street, Suffolk, VA 23434
MLS# 10611490Listed by: Howard Hanna Real Estate Svcs. $110,000Pending15 Acres
15 Acres Cypress Chapel Road, Suffolk, VA 23434
MLS# 10605728Listed by: MOP Land and Farms Realty $197,500Pending45.5 Acres
45.5 Acres Cypress Chapel Road, Suffolk, VA 23434
MLS# 10605398Listed by: MOP Land and Farms Realty $19,000Pending0.17 Acres
4809 Mineral Spring Road, Suffolk, VA 23438
MLS# 10604504Listed by: Real Broker LLC $18,000Active0.23 Acres
Lot 64 Main Street, Suffolk, VA 23434
MLS# 10603182Listed by: Top Producers Realty Group Inc $65,000Active0.18 Acres
-1/4AC Nansemond Parkway, Suffolk, VA 23434
MLS# 10593239Listed by: GreenTree Realty Inc $30,000Active0.11 Acres
-1/4AC Nansemond Parkway, Suffolk, VA 23434
MLS# 10593244Listed by: GreenTree Realty Inc $99,000Pending5.25 Acres
5 AC Southwestern Boulevard, Suffolk, VA 23437
MLS# 10601903Listed by: BHHS RW Towne Realty $123,277Pending1 Acres
2148 Joshua Lane, Suffolk, VA 23434
MLS# 10600027Listed by: Keller Williams Coastal Virginia Chesapeake $225,000Active0.5 Acres
Lot197 Raintree Circle, Suffolk, VA 23435
MLS# 10597430Listed by: East West Realty-Hampton Roads $2,009,448Active552.57 Acres
N Liberty Spring Rd (tract: Ches. Block 4-61-119), SUFFOLK, VA 23432
MLS# VASF2000056Listed by: ADVANCE LAND AND TIMBER LLC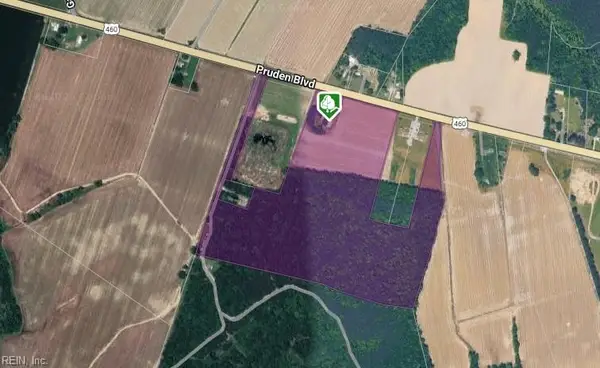 $1,950,000Active0 Acres
4441 Pruden Boulevard, Suffolk, VA 23434
MLS# 10613609Listed by: Weichert Realtors-KBL Company $42,000Active0.15 Acres
Lot 80 Pughsville Road, Suffolk, VA 23435
MLS# 10580667Listed by: RE/MAX Elevate $199,500Pending3.92 Acres
29-57 Suffolk Street, Suffolk, VA 23434
MLS# 10365808Listed by: Keller Williams Elite 757 $56,000Active0.11 Acres
13A Pughsville Road, Suffolk, VA 23435
MLS# 10572959Listed by: MR Rivera Realty Group $235,000Pending13.25 Acres
824 Milford Lane, Suffolk, VA 23434
MLS# 10569434Listed by: BHHS RW Towne Realty $54,999Active3.36 Acres
2271 Holland Corner Road, Suffolk, VA 23437
MLS# 20790264Listed by: NNN ADVISOR, LLC $95,000Active1 Acres
4500 Bennetts Pasture Road, Suffolk, VA 23435
MLS# 10567108Listed by: Investment Realty Corporation $59,999Active3.36 Acres
5000 Manning Road, Suffolk, VA 23437
MLS# 20771916Listed by: NNN ADVISOR, LLC $60,000Pending4.1 Acres
325 N Lloyd Street, Suffolk, VA 23434
MLS# 10552310Listed by: Creed Realty $339,900Pending26.84 Acres
26 AC Desert Road, Suffolk, VA 23434
MLS# 10528494Listed by: Cross Realty $55,000Active0 Acres
.18AC Clifton Street, Suffolk, VA 23435
MLS# 10490677Listed by: CENTURY 21 Nachman Realty $55,000Active0 Acres
4225 Clifton Street, Suffolk, VA 23435
MLS# 10490674Listed by: CENTURY 21 Nachman Realty $279,900Active0.91 Acres
2022 Holland Road, Suffolk, VA 23434
MLS# 10150998Listed by: Scott & Assoc. Inc. Realtors $199,900Active0.55 Acres
2028 Holland Road, Suffolk, VA 23434
MLS# 10150999Listed by: Scott & Assoc. Inc. Realtors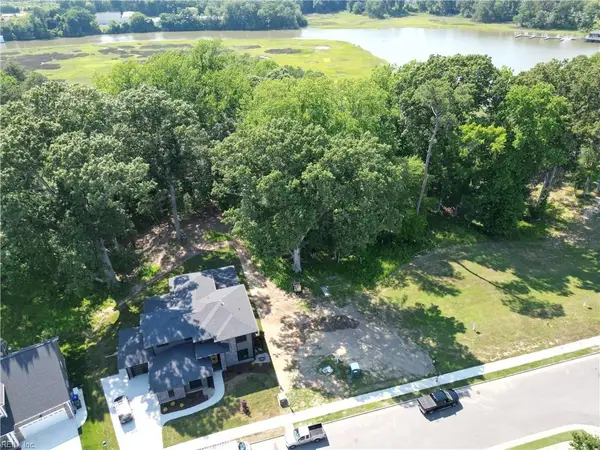 $189,000Active1 Acres
3424 Raintree Circle, Suffolk, VA 23435
MLS# 10624296Listed by: East West Realty-Hampton Roads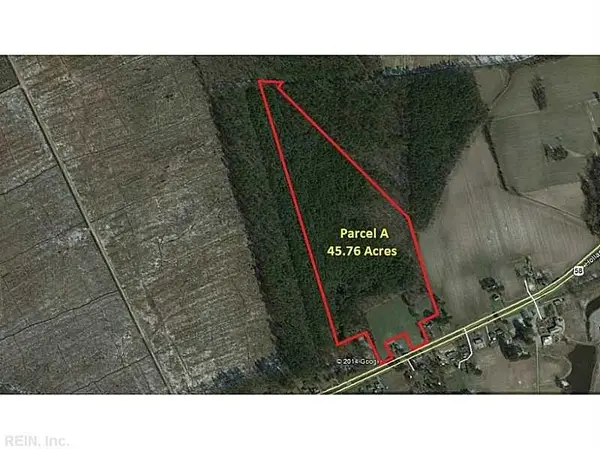 $3,100,000Active45.76 Acres
3240 Holland Road, Suffolk, VA 23434
MLS# 1507350Listed by: CENTURY 21 Nachman Realty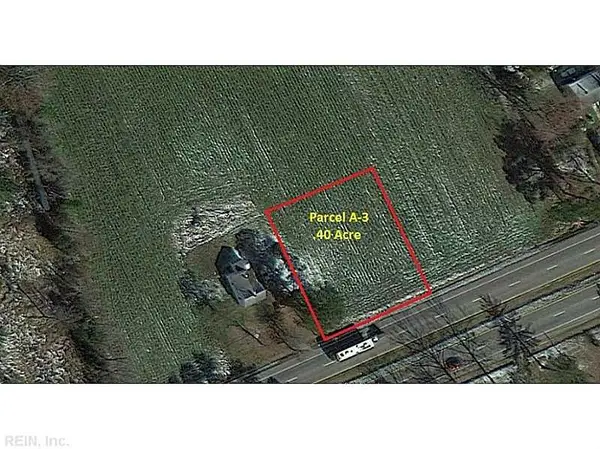 $200,000Active0.4 Acres
.40-AC Holland Road, Suffolk, VA 23434
MLS# 1507355Listed by: CENTURY 21 Nachman Realty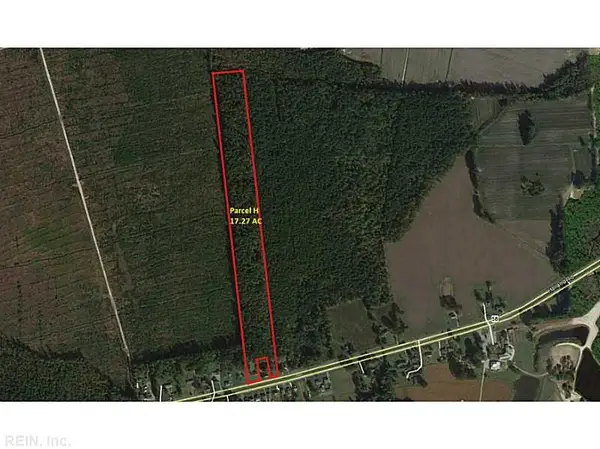 $1,381,600Active17.27 Acres
3316 Holland Road, Suffolk, VA 23434
MLS# 1606095Listed by: CENTURY 21 Nachman Realty $250,000Active0.5 Acres
3320 Holland Road, Suffolk, VA 23434
MLS# 1606096Listed by: CENTURY 21 Nachman Realty
Local realty services provided by:CENTURY 21 Realty @ Home, CENTURY 21 Alliance, CENTURY 21 Nachman Realty, CENTURY 21 Gold Coat Realtors
The listings data displayed on this medium comes in part from the Real Estate Information Network Inc. (REIN) and has been authorized by participating listing Broker Members of REIN for display. REIN's listings are based upon Data submitted by its Broker Members, and REIN therefore makes no representation or warranty regarding the accuracy of the Data. All users of REIN's listings database should confirm the accuracy of the listing information directly with the listing agent. 2026 REIN. REIN's listings Data and information is protected under federal copyright laws. Federal law prohibits, among other acts, the unauthorized copying or alteration of, or preparation of derivative works from, all or any part of copyrighted materials, including certain compilations of Data and information. COPYRIGHT VIOLATORS MAY BE SUBJECT TO SEVERE FINES AND PENALTIES UNDER FEDERAL LAW. REIN updates its listings on a daily basis. Data last updated: July 14, 2026 This application does not include information on all of the properties available for sale at this time.
Some listings may be duplicated in the search results due to the co-mingling of listings from more than one multiple listing service. Should there be different listing information between the duplicated listings; user is advised to verify the accuracy of the listing information before making any financial decisions.
2026 REIN, Inc. Information Deemed Reliable But Not Guaranteed.
Information provided, in part, by North Texas Real Estate Information Systems, Inc. Last Updated November 6, 2024 Listings with the NTREIS logo are listed by brokerages other than CENTURY 21 Gold Coat Realtors. GDAR Member Broker: Katherine Hein
Popular searches near Suffolk city County, VA
Popular neighborhoods near Suffolk city County, VA
- Briarfield, Newport News homes for sale
- Camelot, Chesapeake homes for sale
- Deep Creek, Chesapeake homes for sale
- Downtown, Portsmouth homes for sale
- Great Bridge, Chesapeake homes for sale
- Huntington, Newport News homes for sale
- Jefferson Park, Newport News homes for sale
- Marshall, Newport News homes for sale
- Newsome, Newport News homes for sale
- North End, Newport News homes for sale
- Olde Towne, Portsmouth homes for sale
- Rivercrest, Chesapeake homes for sale
- Salters Creek, Newport News homes for sale
- South Norfolk, Chesapeake homes for sale
- Stuart Gardens, Newport News homes for sale
- Tuckers Creek, Newport News homes for sale
- Uptown, Portsmouth homes for sale
- Western Branch, Chesapeake homes for sale
- Wickham, Newport News homes for sale
- Windward Towers, Newport News homes for sale
Zip codes near Suffolk city County, VA
- 23314 homes for sale
- 23315 homes for sale
- 23321 homes for sale
- 23323 homes for sale
- 23432 homes for sale
- 23433 homes for sale
- 23434 homes for sale
- 23435 homes for sale
- 23436 homes for sale
- 23437 homes for sale
- 23438 homes for sale
- 23487 homes for sale
- 23701 homes for sale
- 23702 homes for sale
- 23703 homes for sale
- 23704 homes for sale
- 23707 homes for sale
- 23851 homes for sale
- 23898 homes for sale
- 27926 homes for sale
Protect your home and budget from life's surprises with an Assurant Home Warranty, backed by a partner that supports you through every step of homeownership. Explore Plans.
©2026 Century 21 Real Estate LLC. All rights reserved. CENTURY 21®, the CENTURY 21 Logo and C21® are service marks owned by Century 21 Real Estate LLC. Century 21 Real Estate LLC fully supports the principles of the Fair Housing Act and the Equal Opportunity Act. Each office is independently owned and operated. Listing information is deemed reliable but not guaranteed accurate.