- Benns Church homes for sale
- Berlin and Ivor homes for sale
- Camptown homes for sale
- Carrollton homes for sale
- Carrsville homes for sale
- Chesapeake homes for sale
- Corapeake homes for sale
- Franklin homes for sale
- Franklin homes for sale
- Gates homes for sale
- Haslett homes for sale
- Hunters Mill homes for sale
- Ivor homes for sale
- Newport homes for sale
- Portsmouth homes for sale
- Reynoldson homes for sale
- Smithfield homes for sale
- Suffolk homes for sale
- Windsor homes for sale
- Zuni homes for sale
23434, VA - homes for sale
9 of 9 results displayed
- Open Sat, 1 to 4pmNew
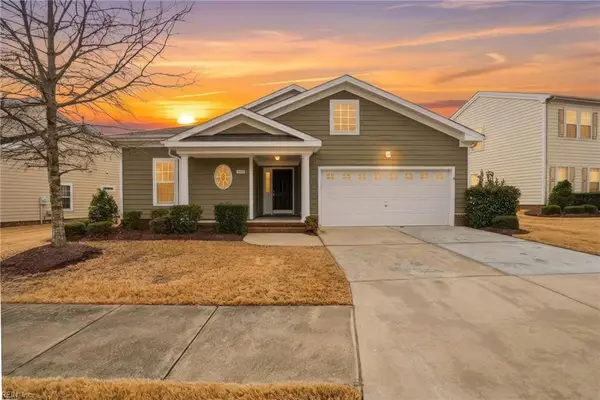
 $405,000Active4 beds 3 baths1,918 sq. ft.
3020 Dabney Lane, Suffolk, VA 23434
MLS# 10623836Listed by: Fathom Realty - Open Sat, 1 to 3pmNew
 $229,900Active2 beds 2 baths1,240 sq. ft.
170 River Point Drive, Suffolk, VA 23434
MLS# 10623194Listed by: AtCoastal Realty - Open Thu, 11am to 5pm
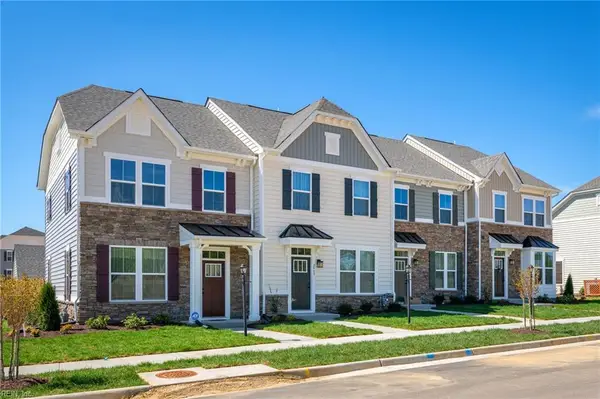
 $269,990Active3 beds 3 baths1,280 sq. ft.
233 Reids Place Drive, Suffolk, VA 23434
MLS# 10621104Listed by: BHHS RW Towne Realty - Open Fri, 3 to 5pm
 $405,000Active4 beds 2 baths1,994 sq. ft.
5107 Kings Grant Circle, Suffolk, VA 23434
MLS# 10620835Listed by: LPT Network Realty LLC - Open Thu, 11am to 5pm
 $285,970Pending3 beds 3 baths1,280 sq. ft.
213 Reids Place Drive, Suffolk, VA 23434
MLS# 10620447Listed by: BHHS RW Towne Realty - Open Sat, 11am to 1pm
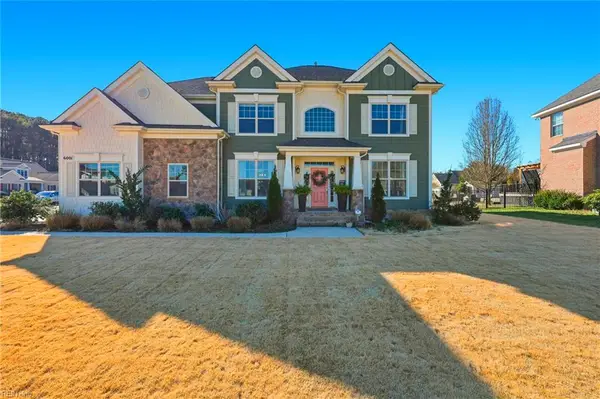 $670,000Active5 beds 4 baths3,264 sq. ft.
6001 Gardenstone Circle, Suffolk, VA 23434
MLS# 10618137Listed by: The Miller Real Estate Group - Open Sat, 1 to 3pm
 $650,000Active5 beds 4 baths3,330 sq. ft.
164 Preserve Way, Suffolk, VA 23434
MLS# 10617787Listed by: The Real Estate Group - Open Sat, 1 to 3pmNew
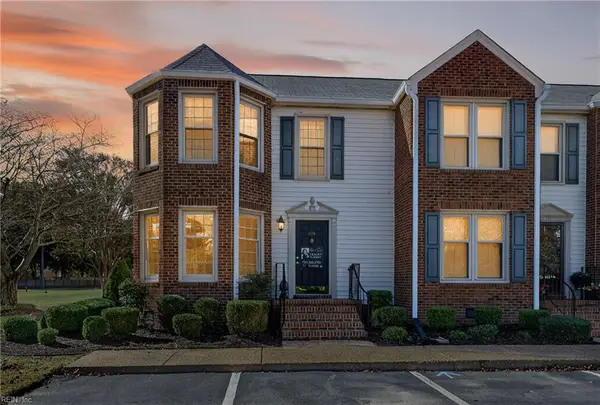 $279,900Active3 beds 3 baths1,600 sq. ft.
223 River Point Drive, Suffolk, VA 23434
MLS# 10623390Listed by: Southside Real Estate - Open Sat, 12 to 2pm
 $1,125,000Active5 beds 5 baths5,341 sq. ft.
1259 Murphys Mill Road, Suffolk, VA 23434
MLS# 10615135Listed by: Howard Hanna Real Estate Svcs.
Local realty services provided by:CENTURY 21 Realty @ Home
The listings data displayed on this medium comes in part from the Real Estate Information Network Inc. (REIN) and has been authorized by participating listing Broker Members of REIN for display. REIN's listings are based upon Data submitted by its Broker Members, and REIN therefore makes no representation or warranty regarding the accuracy of the Data. All users of REIN's listings database should confirm the accuracy of the listing information directly with the listing agent. 2026 REIN. REIN's listings Data and information is protected under federal copyright laws. Federal law prohibits, among other acts, the unauthorized copying or alteration of, or preparation of derivative works from, all or any part of copyrighted materials, including certain compilations of Data and information. COPYRIGHT VIOLATORS MAY BE SUBJECT TO SEVERE FINES AND PENALTIES UNDER FEDERAL LAW. REIN updates its listings on a daily basis. Data last updated: March 11, 2026 This application does not include information on all of the properties available for sale at this time.
Some listings may be duplicated in the search results due to the co-mingling of listings from more than one multiple listing service. Should there be different listing information between the duplicated listings; user is advised to verify the accuracy of the listing information before making any financial decisions.
2026 REIN, Inc. Information Deemed Reliable But Not Guaranteed.
Popular searches near 23434
Popular neighborhoods near 23434
- Camelot, Chesapeake homes for sale
- Deep Creek, Chesapeake homes for sale
- Downtown, Portsmouth homes for sale
- Downtown, Newport News homes for sale
- Great Bridge, Chesapeake homes for sale
- Huntington, Newport News homes for sale
- Indian River, Chesapeake homes for sale
- Jefferson Park, Newport News homes for sale
- Marshall, Newport News homes for sale
- Newsome, Newport News homes for sale
- Norfolk Highlands, Chesapeake homes for sale
- Olde Towne, Portsmouth homes for sale
- Rivercrest, Chesapeake homes for sale
- Salters Creek, Newport News homes for sale
- South Norfolk, Chesapeake homes for sale
- Stuart Gardens, Newport News homes for sale
- Tuckers Creek, Newport News homes for sale
- Uptown, Portsmouth homes for sale
- Western Branch, Chesapeake homes for sale
- Wickham, Newport News homes for sale
Counties near Suffolk, 23434
- Camden County homes for sale
- Chesapeake city County homes for sale
- Chowan County homes for sale
- Franklin city County homes for sale
- Gates County homes for sale
- Hampton city County homes for sale
- Hertford County homes for sale
- Isle of Wight County homes for sale
- Newport News city County homes for sale
- Norfolk city County homes for sale
- Pasquotank County homes for sale
- Perquimans County homes for sale
- Poquoson city County homes for sale
- Portsmouth city County homes for sale
- Southampton County homes for sale
- Suffolk city County homes for sale
- Surry County homes for sale
- Sussex County homes for sale
- Virginia Beach city County homes for sale
- Williamsburg city County homes for sale
Protect your home and budget from life's surprises with an Assurant Home Warranty, backed by a partner that supports you through every step of homeownership. Explore Plans.
©2026 Century 21 Real Estate LLC. All rights reserved. CENTURY 21®, the CENTURY 21 Logo and C21® are service marks owned by Century 21 Real Estate LLC. Century 21 Real Estate LLC fully supports the principles of the Fair Housing Act and the Equal Opportunity Act. Each office is independently owned and operated. Listing information is deemed reliable but not guaranteed accurate.