- Aurora homes for sale
- Aurora Township homes for sale
- Batavia homes for sale
- Blackberry homes for sale
- Boulder Hill homes for sale
- Bristol homes for sale
- Elburn homes for sale
- Geneva homes for sale
- Hinckley homes for sale
- Kaneville Township homes for sale
- Little Rock homes for sale
- Montgomery homes for sale
- North Aurora homes for sale
- Oswego homes for sale
- Oswego Township homes for sale
- Plano homes for sale
- Prestbury homes for sale
- Sugar Grove Township homes for sale
- Sugar Grove homes for sale
- Yorkville homes for sale
60554, IL - homes for sale
57 of 57 results displayed
- New
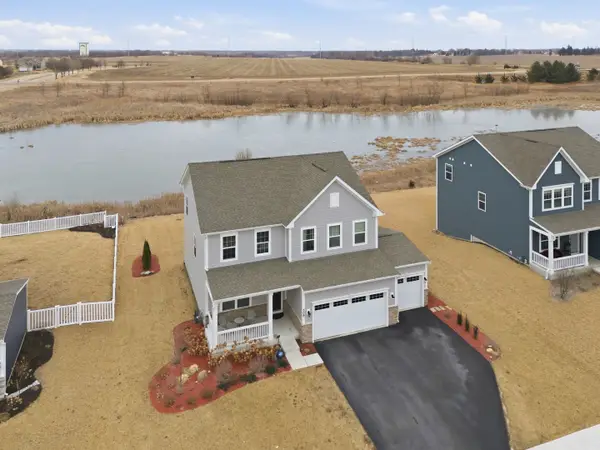
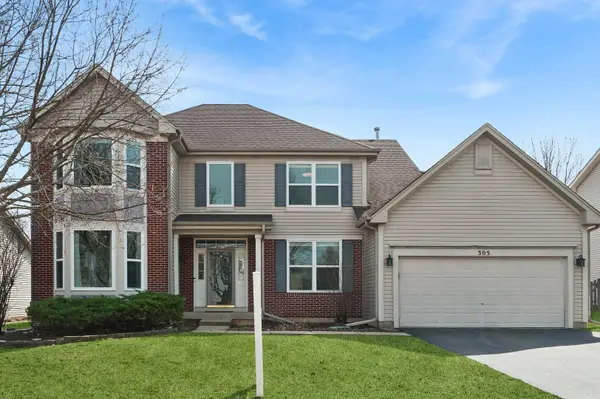 $515,000Active4 beds 4 baths2,688 sq. ft.
305 Hampton Road, Sugar Grove, IL 60554
MLS# 12585681Listed by: BAIRD & WARNER
- New
 $625,000Active4 beds 3 baths3,604 sq. ft.
9 Buckingham Drive, Sugar Grove, IL 60554
MLS# 12603305Listed by: KELLER WILLIAMS INNOVATE - AURORA - Open Sat, 10am to 12pmNew
 $260,000Active2 beds 2 baths1,149 sq. ft.
208 Maple Street #C, Sugar Grove, IL 60554
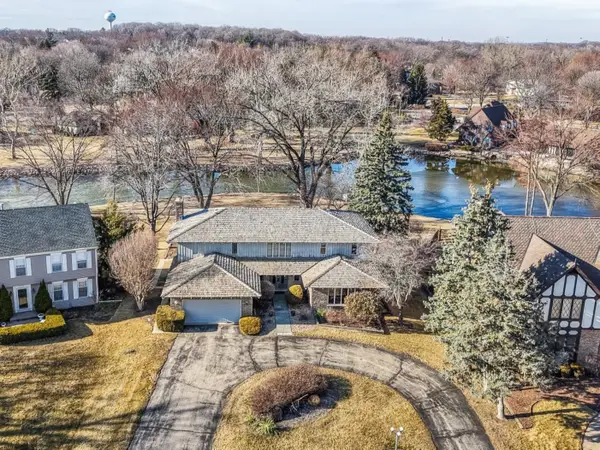
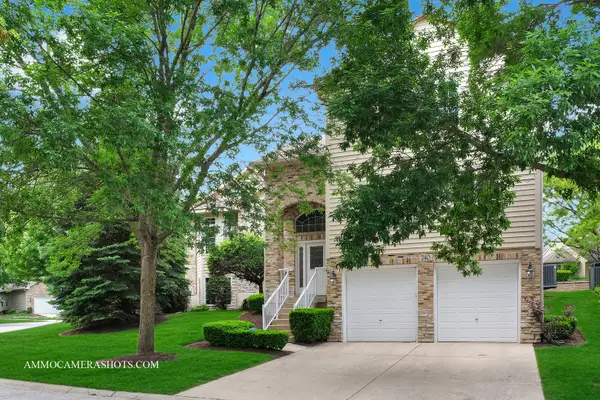
MLS# 12601744Listed by: JOHN GREENE, REALTOR 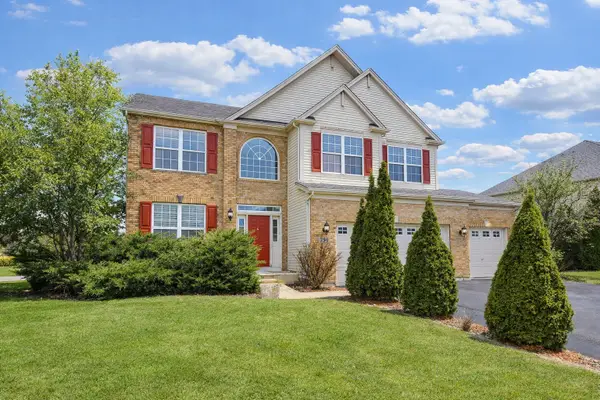 $430,000Pending5 beds 4 baths3,116 sq. ft.
730 Boyce Road, Sugar Grove, IL 60554
MLS# 12600310Listed by: @PROPERTIES CHRISTIE'S INTERNATIONAL REAL ESTATE- New
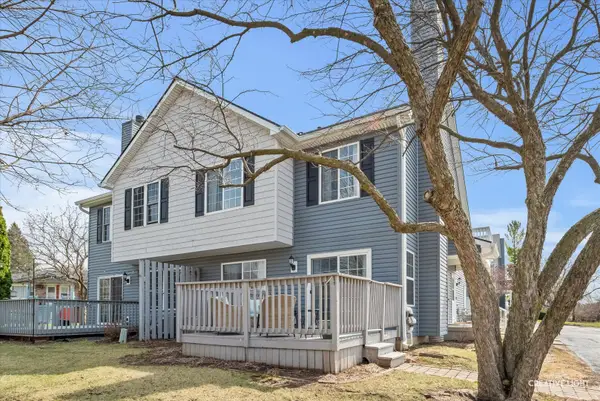
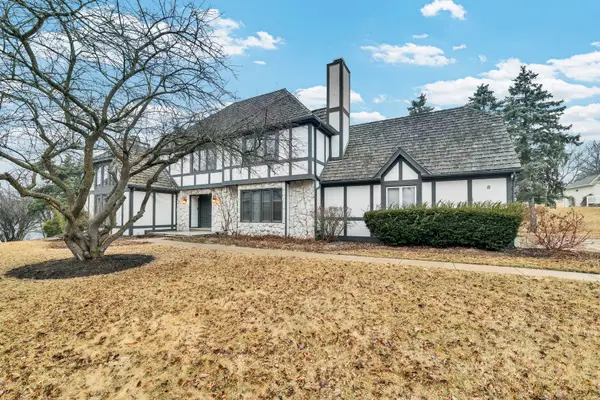
 $600,000Active4 beds 4 baths2,462 sq. ft.
306 Atkinson Drive, Sugar Grove, IL 60554
MLS# 12578858Listed by: EXP REALTY - YORKVILLE - New
 $330,000Active3 beds 3 baths1,806 sq. ft.
182 Brompton Lane #A, Sugar Grove, IL 60554
MLS# 12602025Listed by: NORTHWEST REAL ESTATE GROUP 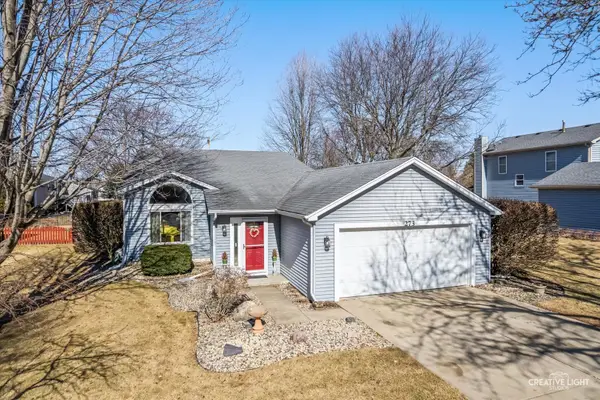 $385,000Pending3 beds 3 baths
273 Bastian Drive, Sugar Grove, IL 60554
MLS# 12599295Listed by: LEGACY PROPERTIES- New
 $450,000Active3 beds 3 baths3,339 sq. ft.
740 Manor Hill Place, Sugar Grove, IL 60554
MLS# 12599053Listed by: KELLER WILLIAMS PREMIERE PROPERTIES - New
 $545,000Active4 beds 3 baths2,990 sq. ft.
8 Heaton Court, Sugar Grove, IL 60554
MLS# 12598226Listed by: COMPASS 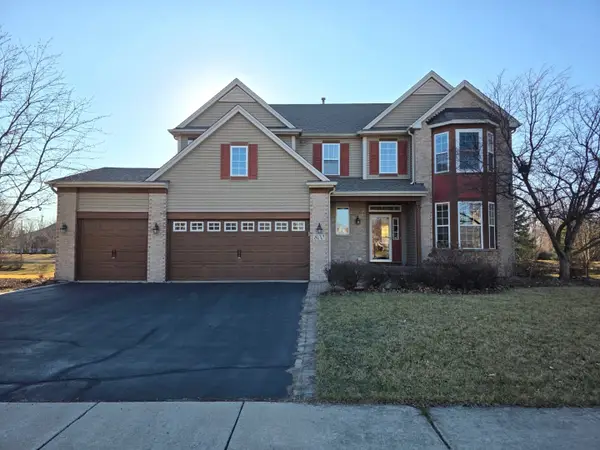 $519,000Active5 beds 4 baths2,922 sq. ft.
800 Boyce Road, Sugar Grove, IL 60554
MLS# 12588569Listed by: KELLER WILLIAMS INFINITY $669,900Pending4 beds 5 baths3,667 sq. ft.
841 Black Walnut Drive, Sugar Grove, IL 60554
MLS# 12589715Listed by: ONE SOURCE REALTY $345,000Pending3 beds 3 baths1,687 sq. ft.
352 Normandie Drive, Sugar Grove, IL 60554
MLS# 12594431Listed by: KELLER WILLIAMS INNOVATE - AURORA $295,000Active3 beds 2 baths1,466 sq. ft.
533 Mallard Lane #C, Sugar Grove, IL 60554
MLS# 12585907Listed by: REDFIN CORPORATION $400,000Pending3 beds 3 baths1,504 sq. ft.
90 Arbor Avenue, Sugar Grove, IL 60554
MLS# 12586025Listed by: COLDWELL BANKER REAL ESTATE GROUP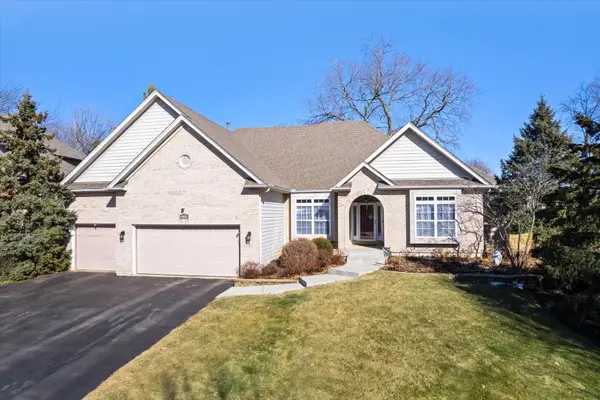 $545,000Pending3 beds 3 baths2,362 sq. ft.
Address Withheld By Seller, Sugar Grove, IL 60554
MLS# 12588755Listed by: LEGACY PROPERTIES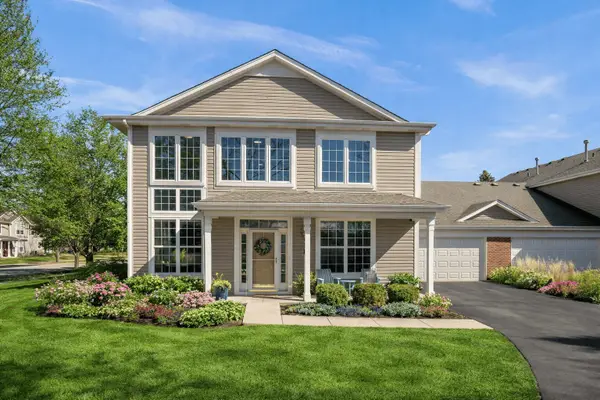 $319,900Pending2 beds 3 baths1,697 sq. ft.
165 E Park Avenue #A, Sugar Grove, IL 60554
MLS# 12588292Listed by: ONE SOURCE REALTY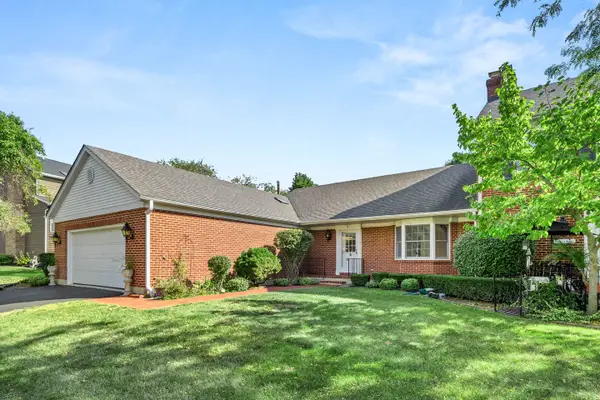 $349,000Pending2 beds 2 baths1,738 sq. ft.
7 Douglas Drive, Sugar Grove, IL 60554
MLS# 12584995Listed by: KELLER WILLIAMS INNOVATE - AURORA $399,900Pending5 beds 3 baths2,216 sq. ft.
222 Meadows Drive, Sugar Grove, IL 60554
MLS# 12490579Listed by: FATHOM REALTY IL LLC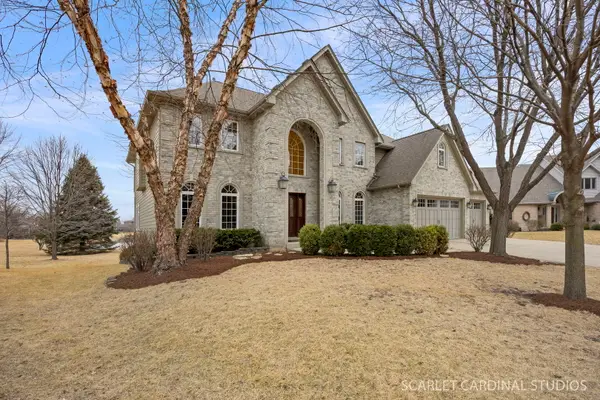 $659,000Pending4 beds 4 baths3,402 sq. ft.
708 Stonehill Court, Sugar Grove, IL 60554
MLS# 12580477Listed by: SOUTHWESTERN REAL ESTATE, INC.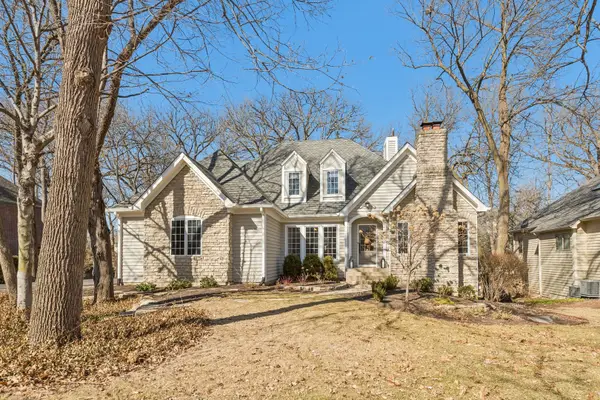 $649,900Pending4 beds 4 baths2,477 sq. ft.
771 Black Walnut Court, Sugar Grove, IL 60554
MLS# 12578216Listed by: EXP REALTY - ST. CHARLES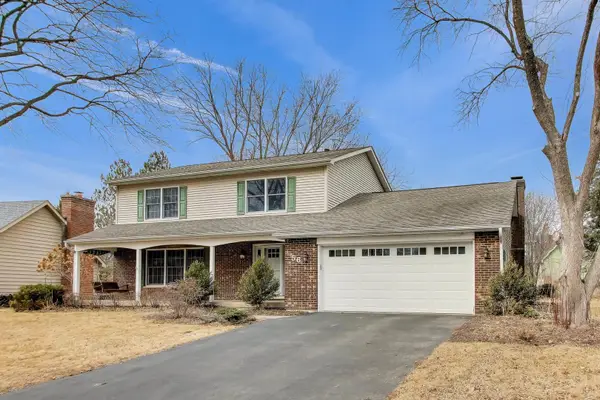 $445,000Pending4 beds 3 baths2,439 sq. ft.
56 Winthrop New Road, Sugar Grove, IL 60554
MLS# 12584215Listed by: @PROPERTIES CHRISTIES INTERNATIONAL REAL ESTATE $315,000Pending3 beds 2 baths1,073 sq. ft.
103 Main Street, Sugar Grove, IL 60554
MLS# 12576888Listed by: EXP REALTY - CHICAGO NORTH AVE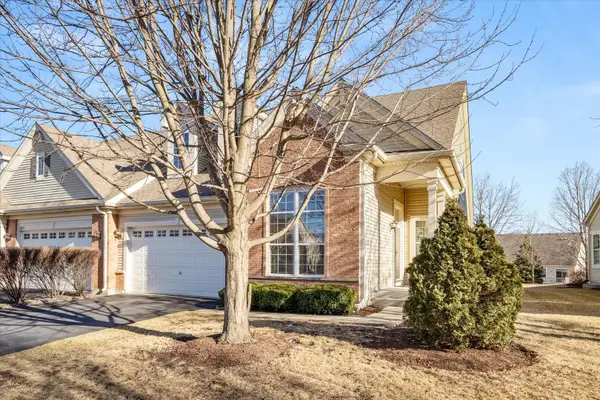 $449,000Pending3 beds 3 baths2,053 sq. ft.
1787 Glenwood Circle #A, Sugar Grove, IL 60554
MLS# 12572468Listed by: KELLER WILLIAMS INNOVATE - AURORA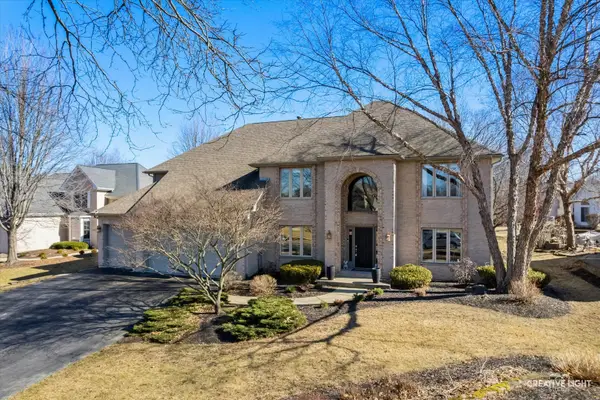 $645,000Pending4 beds 4 baths3,800 sq. ft.
982 Jennifer Court, Sugar Grove, IL 60554
MLS# 12487203Listed by: LEGACY PROPERTIES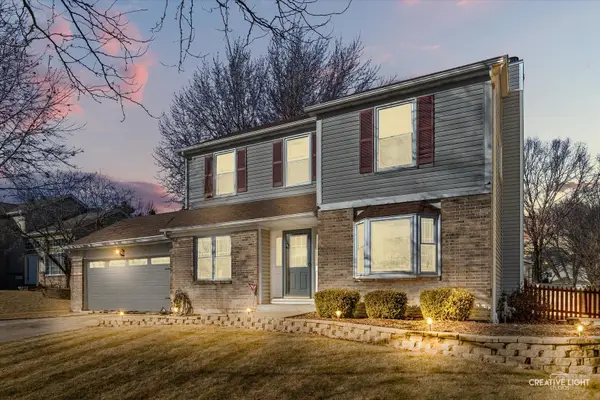 $415,000Active3 beds 3 baths1,947 sq. ft.
102 Chelsea Avenue, Sugar Grove, IL 60554
MLS# 12570761Listed by: KELLER WILLIAMS INSPIRE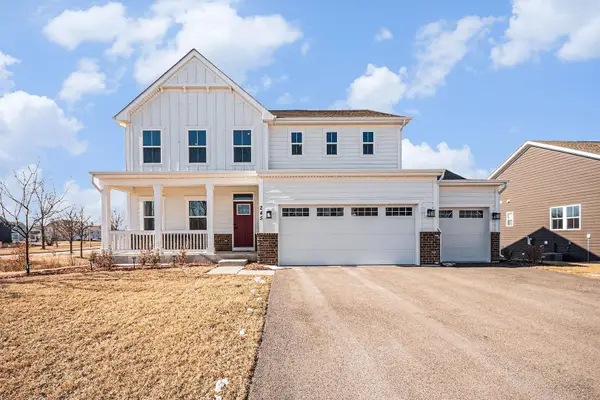 $600,000Pending4 beds 3 baths3,010 sq. ft.
245 Goldenrod Drive, Sugar Grove, IL 60554
MLS# 12569385Listed by: KELLER WILLIAMS INNOVATE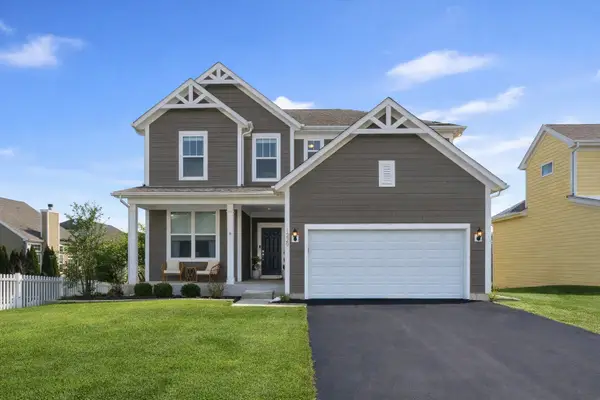 $525,000Pending3 beds 3 baths2,500 sq. ft.
1229 Mariemont Road, Sugar Grove, IL 60554
MLS# 12560761Listed by: COMPASS $325,000Pending2 beds 3 baths1,650 sq. ft.
192 Brompton Lane, Sugar Grove, IL 60554
MLS# 12549831Listed by: @PROPERTIES CHRISTIE'S INTERNATIONAL REAL ESTATE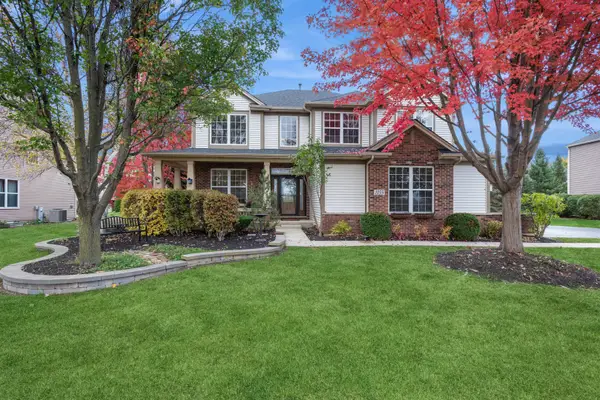 $520,000Pending4 beds 3 baths3,114 sq. ft.
1155 Mcdole Drive, Sugar Grove, IL 60554
MLS# 12562748Listed by: BAIRD & WARNER FOX VALLEY - GENEVA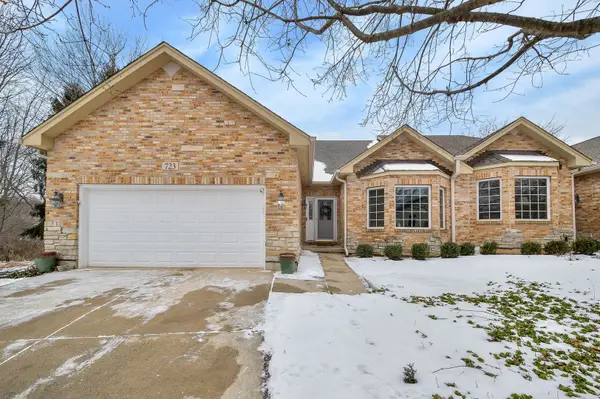 $459,000Pending4 beds 3 baths1,807 sq. ft.
723 Manor Hill Place, Sugar Grove, IL 60554
MLS# 12547109Listed by: KELLER WILLIAMS INFINITY $445,000Active2 beds 3 baths1,808 sq. ft.
Address Withheld By Seller, Sugar Grove, IL 60554
MLS# 12534518Listed by: LEGACY PROPERTIES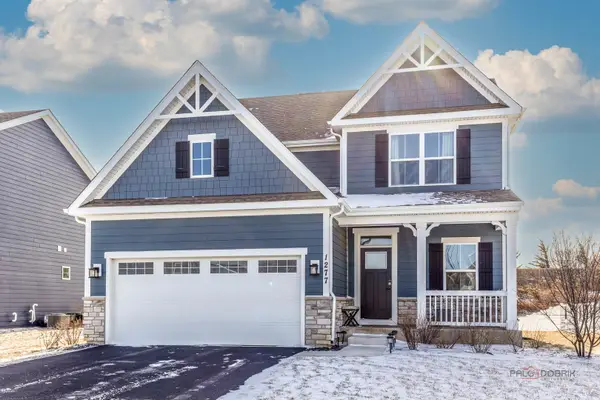 $484,900Pending4 beds 3 baths2,350 sq. ft.
Address Withheld By Seller, Sugar Grove, IL 60554
MLS# 12560324Listed by: CORE REALTY & INVESTMENTS, INC $495,000Pending4 beds 3 baths2,692 sq. ft.
133 Caledonian Avenue, Sugar Grove, IL 60554
MLS# 12554870Listed by: REDFIN CORPORATION $480,000Pending4 beds 3 baths2,486 sq. ft.
Address Withheld By Seller, Sugar Grove, IL 60554
MLS# 12329009Listed by: KELLER WILLIAMS INSPIRE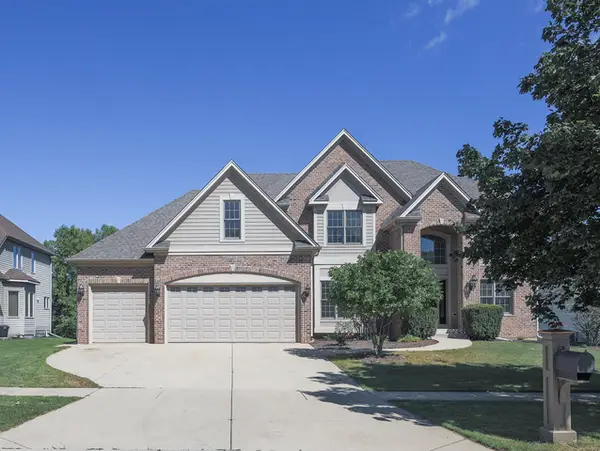 $659,000Pending5 beds 5 baths2,888 sq. ft.
618 Pine Street, Sugar Grove, IL 60554
MLS# 12533281Listed by: CONCENTRIC REALTY, INC $475,000Active3 beds 4 baths2,559 sq. ft.
781 Manor Hill Place, Sugar Grove, IL 60554
MLS# 12508475Listed by: PILMER REAL ESTATE, INC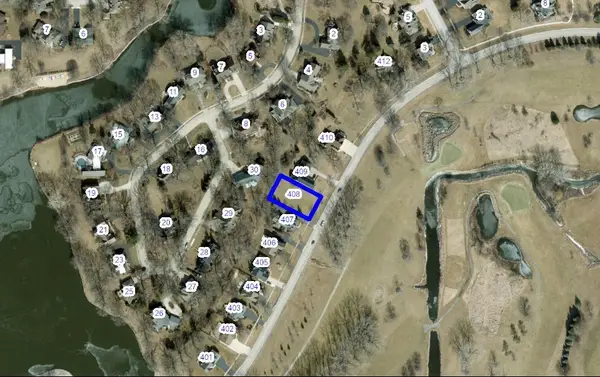 $80,000Active0.25 Acres
408 Hankes Road, Sugar Grove, IL 60554
MLS# 12521391Listed by: LISTWITHFREEDOM.COM $80,000Active0.5 Acres
670 Sheffield Circle, Sugar Grove, IL 60554
MLS# 12521421Listed by: LISTWITHFREEDOM.COM $44,000Active0.4 Acres
1310 Airs Avenue, Sugar Grove, IL 60554
MLS# 12486145Listed by: KELLER WILLIAMS INNOVATE - AURORA $534,000Pending6 beds 4 baths4,300 sq. ft.
965 Carmen Road, Sugar Grove, IL 60554
MLS# 12477633Listed by: KELLER WILLIAMS ONECHICAGO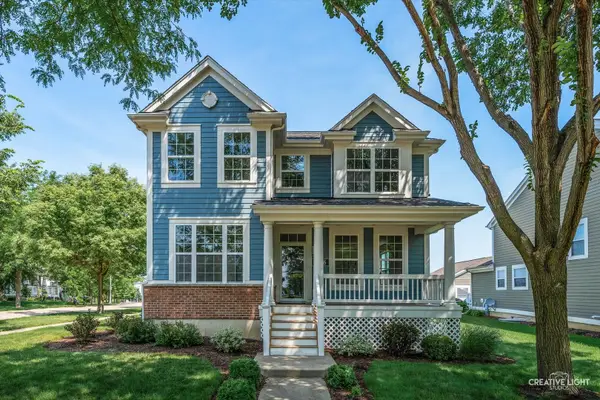 $519,000Active5 beds 4 baths2,515 sq. ft.
1266 Airs Avenue, Sugar Grove, IL 60554
MLS# 12574754Listed by: EXP REALTY - GENEVA $539,000Active3 beds 3 baths2,940 sq. ft.
954 Black Walnut Drive, Sugar Grove, IL 60554
MLS# 12428271Listed by: @PROPERTIES CHRISTIE'S INTERNATIONAL REAL ESTATE $125,000Active0.75 Acres
43W690 Marian Circle, Sugar Grove, IL 60554
MLS# 12302681Listed by: SWANSON REAL ESTATE $699,999Active3 beds 2 baths2,000 sq. ft.
868 Edgewood Drive, Sugar Grove, IL 60554
MLS# 12190021Listed by: CIRCLE ONE REALTY $290,000Active4.65 Acres
30 Us-30 Highway, Shabbona, IL 60550
MLS# 12066232Listed by: WEICHERT REALTORS SIGNATURE PROFESSIONALS $55,000Active0.39 Acres
1070 Wheatfield Avenue, Sugar Grove, IL 60554
MLS# 12042015Listed by: JOHN GREENE, REALTOR $65,000Active0.39 Acres
905 Wheatfield Avenue, Sugar Grove, IL 60554
MLS# 12042057Listed by: JOHN GREENE, REALTOR $74,000Pending0.36 Acres
778 Wheatfield Avenue, Sugar Grove, IL 60554
MLS# 12041559Listed by: JOHN GREENE, REALTOR $74,000Active0.38 Acres
966 Wheatfield Avenue, Sugar Grove, IL 60554
MLS# 12041564Listed by: JOHN GREENE, REALTOR $74,000Active0.33 Acres
917 Wheatfield Avenue, Sugar Grove, IL 60554
MLS# 12037261Listed by: JOHN GREENE, REALTOR $69,900Active0.36 Acres
Lot 30 Chestnut Hill Lane, Sugar Grove, IL 60554
MLS# 11971192Listed by: PREMIER LIVING PROPERTIES $39,000Active0.3 Acres
160 Isbell Drive, Sugar Grove, IL 60554
MLS# 11885958Listed by: SOUTHWESTERN REAL ESTATE, INC. $39,000Active0.31 Acres
1130 Coneflower Circle, Sugar Grove, IL 60554
MLS# 11885846Listed by: SOUTHWESTERN REAL ESTATE, INC. $70,000Active0.22 Acres
684 Greenfield Road, Sugar Grove, IL 60554
MLS# 12051414Listed by: MARY LOUISE PROPERTIES $70,000Active0.26 Acres
706 Brighton Drive, Sugar Grove, IL 60554
MLS# 12051426Listed by: MARY LOUISE PROPERTIES $70,000Active0.3 Acres
933 Lakeridge Court, Sugar Grove, IL 60554
MLS# 12051429Listed by: MARY LOUISE PROPERTIES $70,000Active0.3 Acres
947 Lakeridge Court, Sugar Grove, IL 60554
MLS# 12051433Listed by: MARY LOUISE PROPERTIES
Local realty services provided by:CENTURY 21 New Heritage
Copyright 2026 Midwest Real Estate Data LLC. All rights reserved. The data relating to real estate for sale on this web site comes in part from the Broker Reciprocity Program of the Midwest Real Estate Data LLC. Listing information is deemed reliable but not guaranteed.
Popular searches near 60554
Popular neighborhoods near 60554
- Big Woods Marmion, Aurora homes for sale
- Blackberry Countryside, Aurora homes for sale
- Blackhawk, Aurora homes for sale
- Edgelawn Randall, Aurora homes for sale
- Eola Yards, Aurora homes for sale
- Grande Reserve, Yorkville homes for sale
- Grande Reserve North, Oswego homes for sale
- Indian Creek, Aurora homes for sale
- Light of the Community, Aurora homes for sale
- McCarty Burlington, Aurora homes for sale
- Near West Galena, Aurora homes for sale
- North River, Aurora homes for sale
- Pigeon Hill, Aurora homes for sale
- Seasons Ridge, Montgomery homes for sale
- South End, Aurora homes for sale
- South Farnsworth, Aurora homes for sale
- Southeast, Aurora homes for sale
- The Townes at Ashcroft Walk, Oswego homes for sale
- University Neighbors, Aurora homes for sale
- Waubonsee, Aurora homes for sale
Counties near Sugar Grove, 60554
- Boone County homes for sale
- Bureau County homes for sale
- Cook County homes for sale
- DeKalb County homes for sale
- DuPage County homes for sale
- Grundy County homes for sale
- Kane County homes for sale
- Kankakee County homes for sale
- Kendall County homes for sale
- Lake County homes for sale
- Lake County homes for sale
- LaSalle County homes for sale
- Lee County homes for sale
- Livingston County homes for sale
- McHenry County homes for sale
- Ogle County homes for sale
- Putnam County homes for sale
- Walworth County homes for sale
- Will County homes for sale
- Winnebago County homes for sale
Protect your home and budget from life's surprises with an Assurant Home Warranty, backed by a partner that supports you through every step of homeownership. Explore Plans.
©2026 Century 21 Real Estate LLC. All rights reserved. CENTURY 21®, the CENTURY 21 Logo and C21® are service marks owned by Century 21 Real Estate LLC. Century 21 Real Estate LLC fully supports the principles of the Fair Housing Act and the Equal Opportunity Act. Each office is independently owned and operated. Listing information is deemed reliable but not guaranteed accurate.