- Deridder homes for sale
- Dry Creek homes for sale
- Elmer homes for sale
- Elton homes for sale
- Glenmora homes for sale
- Hineston homes for sale
- Kinder homes for sale
- Leesville homes for sale
- Longville homes for sale
- Merryville homes for sale
- New Llano homes for sale
- Oakdale homes for sale
- Oberlin homes for sale
- Pitkin homes for sale
- Ragley homes for sale
- Reeves homes for sale
- Rosepine homes for sale
- Simpson homes for sale
- Singer homes for sale
- Sugartown homes for sale
70662, LA - homes for sale
5 of 5 results displayed
- New
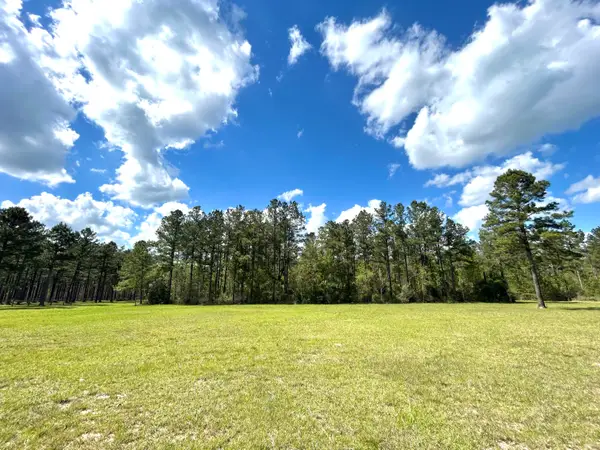 $42,000Active3 Acres
0 Boggs, Sugartown, LA 70662
MLS# 26-5282Listed by: EXIT REAL ESTATE CONSULTANTS 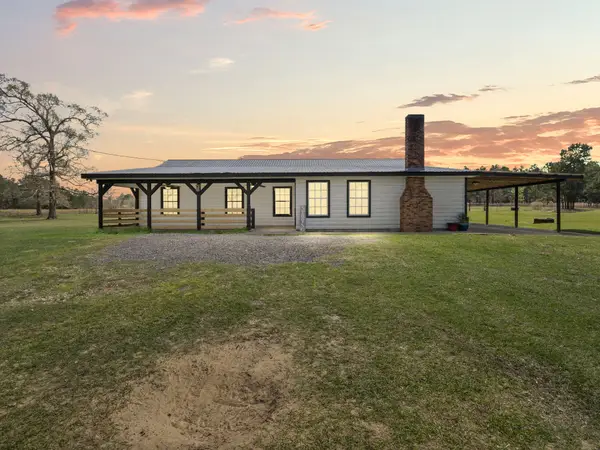 $530,000Active3 beds 2 baths3,159 sq. ft.
438 Billy Young, Sugartown, LA 70662
MLS# 18-6831Listed by: ERA SARVER REAL ESTATE
 $229,900Active4 beds 3 baths2,661 sq. ft.
116 Nixon Rd, Sugartown, LA 70662
MLS# 02-6256Listed by: CENTURY 21 DELIA REALTY GROUP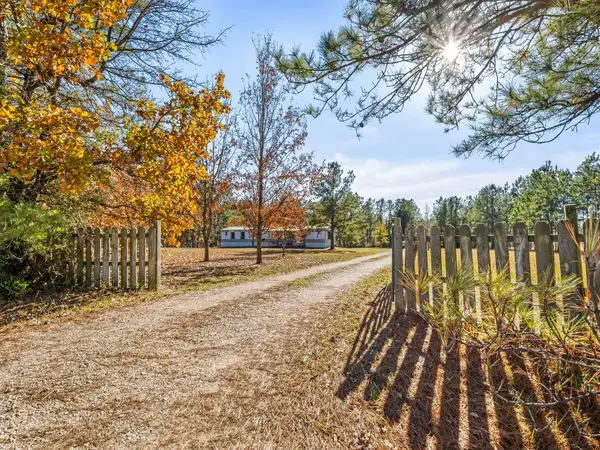 $129,500Active3 beds 2 baths1,216 sq. ft.
9106 Hwy 26, Sugartown, LA 70662
MLS# 26-5196Listed by: EXIT REAL ESTATE CONSULTANTS $48,000Active9 Acres
Tbd Jewell Mckellar Rd, Sugartown, LA 70662
MLS# 26-4970Listed by: EXIT REAL ESTATE CONSULTANTS
Local realty services provided by:CENTURY 21 Delia Realty Group
Popular searches near 70662
Popular neighborhoods near 70662
- Arnould Heights, Lafayette homes for sale
- Bendel Gardens, Lafayette homes for sale
- Beverly Hills, Sulphur homes for sale
- Cable, Beaumont homes for sale
- Charlton Pollard, Beaumont homes for sale
- College Corridor, Beaumont homes for sale
- Gold Hill, Beaumont homes for sale
- Graywood, Lake Charles homes for sale
- Magnolia Park, Lafayette homes for sale
- Maplewood, Sulphur homes for sale
- MLK, Beaumont homes for sale
- North End, Beaumont homes for sale
- Oaklawn Heights, Lafayette homes for sale
- Pinecrest, Beaumont homes for sale
- River Ranch, Lafayette homes for sale
- Souvenir Heights, Lafayette homes for sale
- Sugar Mill Pond, Youngsville homes for sale
- West End Heights West, Lafayette homes for sale
- Westwood, Westlake homes for sale
- Woodland Acres, Beaumont homes for sale
Counties near Sugartown, 70662
- Acadia County homes for sale
- Allen County homes for sale
- Avoyelles County homes for sale
- Beauregard County homes for sale
- Calcasieu County homes for sale
- Cameron County homes for sale
- Evangeline County homes for sale
- Grant County homes for sale
- Jasper County homes for sale
- Jefferson Davis County homes for sale
- Lafayette County homes for sale
- LaSalle County homes for sale
- Natchitoches County homes for sale
- Newton County homes for sale
- Orange County homes for sale
- Rapides County homes for sale
- Sabine County homes for sale
- Sabine County homes for sale
- St. Landry County homes for sale
- Vernon County homes for sale
Protect your home and budget from life's surprises with an Assurant Home Warranty, backed by a partner that supports you through every step of homeownership. Explore Plans.
©2026 Century 21 Real Estate LLC. All rights reserved. CENTURY 21®, the CENTURY 21 Logo and C21® are service marks owned by Century 21 Real Estate LLC. Century 21 Real Estate LLC fully supports the principles of the Fair Housing Act and the Equal Opportunity Act. Each office is independently owned and operated. Listing information is deemed reliable but not guaranteed accurate.