- Bishopville homes for sale
- Dalzell homes for sale
- Eastover homes for sale
- Elloree homes for sale
- Lakewood homes for sale
- Lamar homes for sale
- Manning homes for sale
- Manning East homes for sale
- North Santee homes for sale
- Pinewood homes for sale
- Rembert homes for sale
- Sardinia homes for sale
- Shaw AFB-Horatio homes for sale
- Stateburg homes for sale
- Summerton homes for sale
- Sumter homes for sale
- Sumter North homes for sale
- Sumter Southwest homes for sale
- Wedgefield homes for sale
- Wyboo homes for sale
29150, SC - homes for sale
70 of 70 results displayed
- New
 $190,500Active3 beds 3 baths1,895 sq. ft.
81 Radcliff Drive, Sumter, SC 29150
MLS# 638781Listed by: NORTHGROUP REAL ESTATE LLC 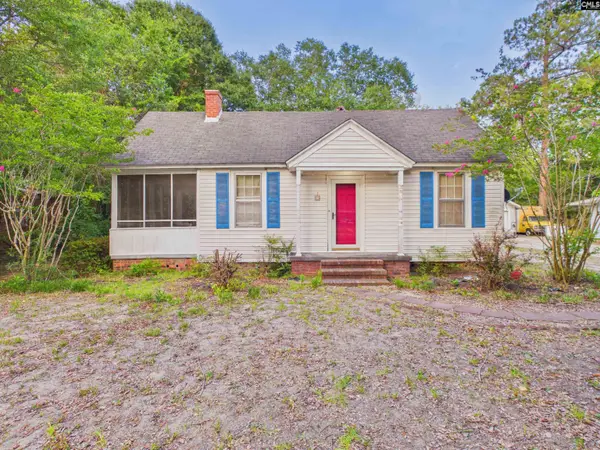 $105,000Pending2 beds 1 baths1,031 sq. ft.
15 Gerald Street, Sumter, SC 29150
MLS# 638474Listed by: GUNTER & ASSOCIATES REALTY- New
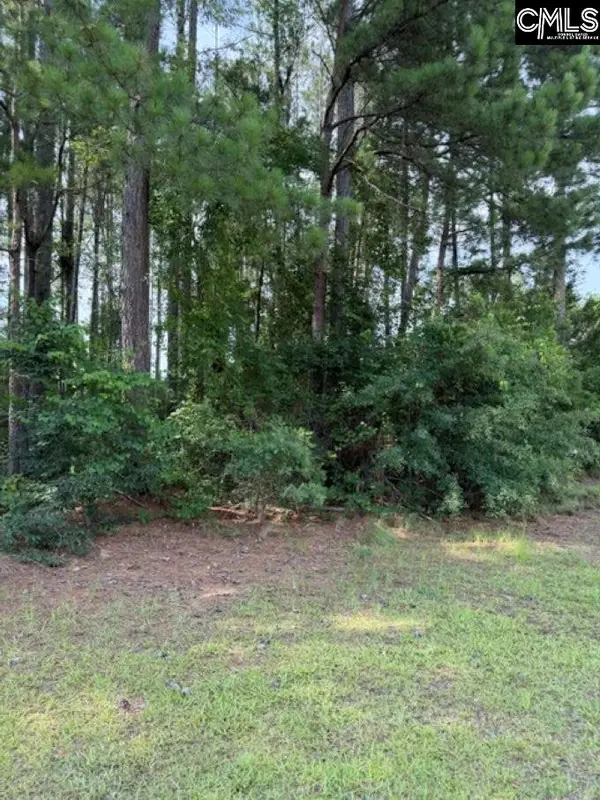 $70,000Active0.5 Acres
2140 Watersong Run, Sumter, SC 29150
MLS# 638312Listed by: ERA WILDER REALTY - New
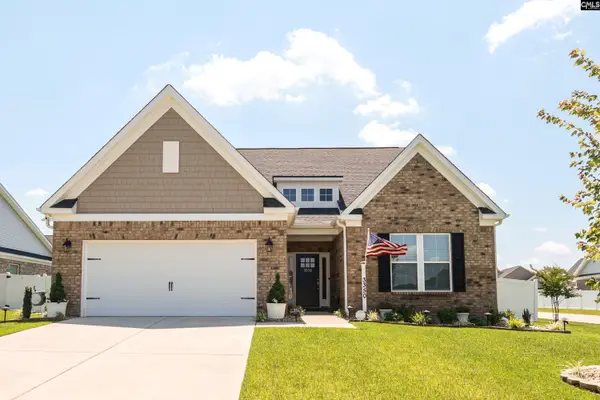
 $378,888Active3 beds 3 baths1,750 sq. ft.
50 Daufaskie Court, Sumter, SC 29150
MLS# 638319Listed by: ERA WILDER REALTY - New
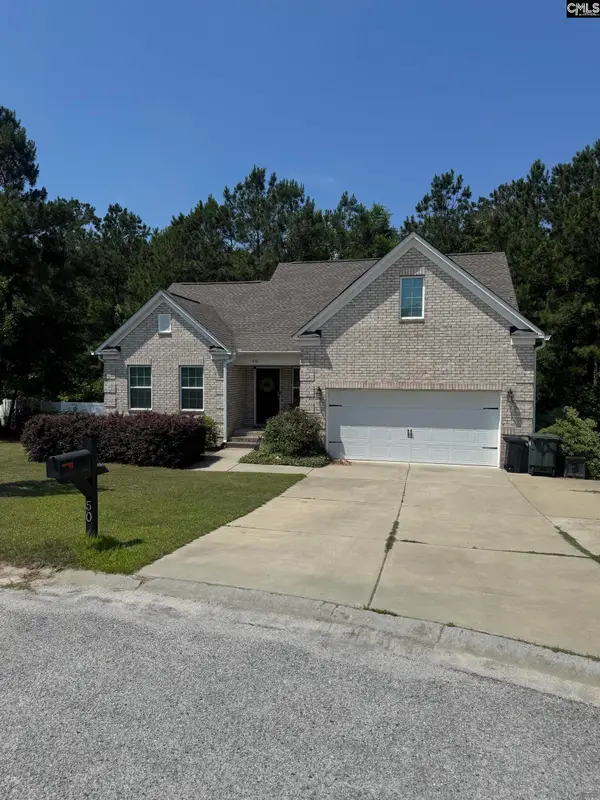
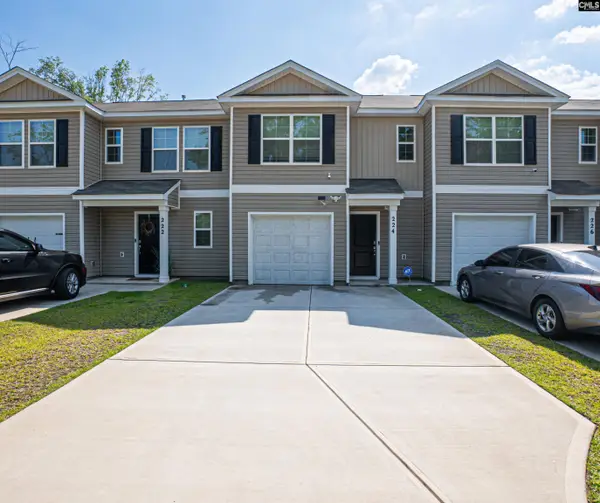 $207,000Active3 beds 3 baths1,418 sq. ft.
224 Wall Street, Summerville, SC 29154
MLS# 638245Listed by: EXP REALTY LLC - New
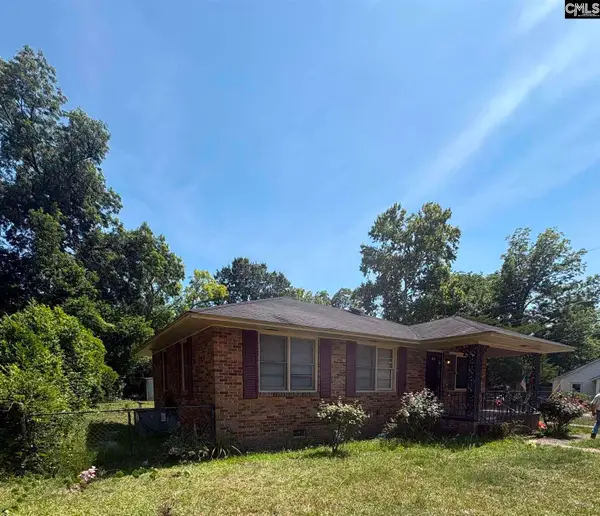
 $175,000Active4 beds 2 baths2,624 sq. ft.
805 Murray Street, Sumter, SC 29150
MLS# 638242Listed by: JPAR MAGNOLIA GROUP - New
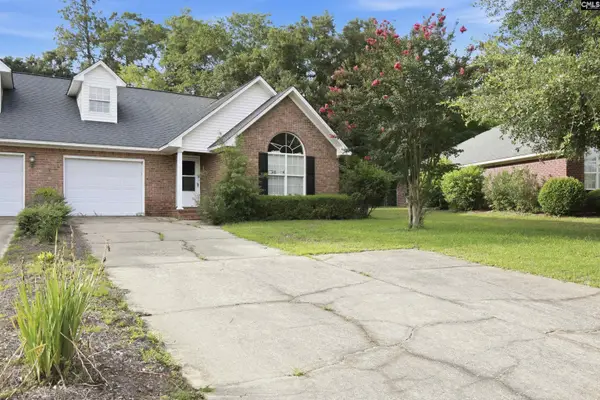
 $53,900Active3 beds 2 baths1,068 sq. ft.
506 Atlantic Street, Sumter, SC 29150
MLS# 638147Listed by: COMPAS REALTY, LLC - New
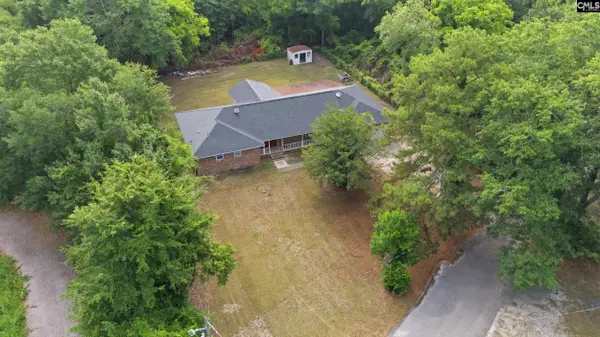
 $375,000Active3 beds 3 baths2,300 sq. ft.
3350 Rustic Drive, Sumter, SC 29150
MLS# 638086Listed by: NORTHGROUP REAL ESTATE LLC - New
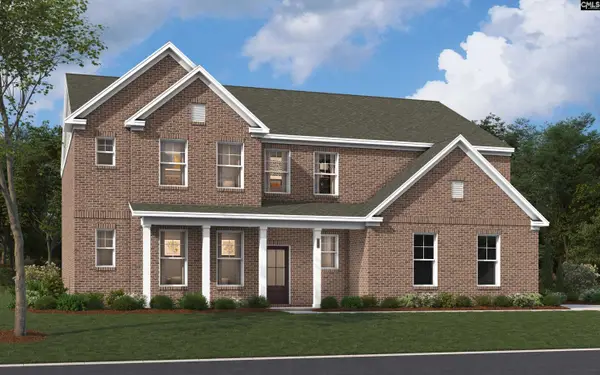 $505,880Active6 beds 5 baths3,689 sq. ft.
3255 Trotter Court, Sumter, SC 29150
MLS# 638077Listed by: SM SOUTH CAROLINA BROKERAGE LLC 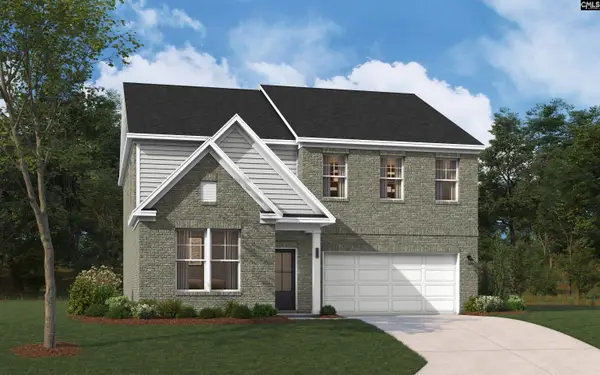 $364,785Pending4 beds 3 baths2,729 sq. ft.
3405 Traveler Trail, Sumter, SC 29150
MLS# 638074Listed by: SM SOUTH CAROLINA BROKERAGE LLC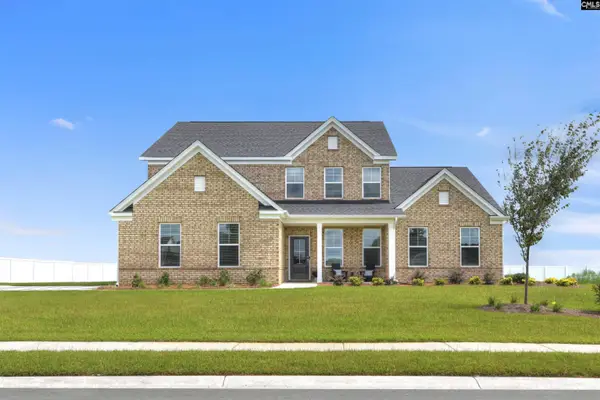 $476,195Pending4 beds 4 baths3,559 sq. ft.
3245 Trotter Court, Sumter, SC 29150
MLS# 638038Listed by: SM SOUTH CAROLINA BROKERAGE LLC- New
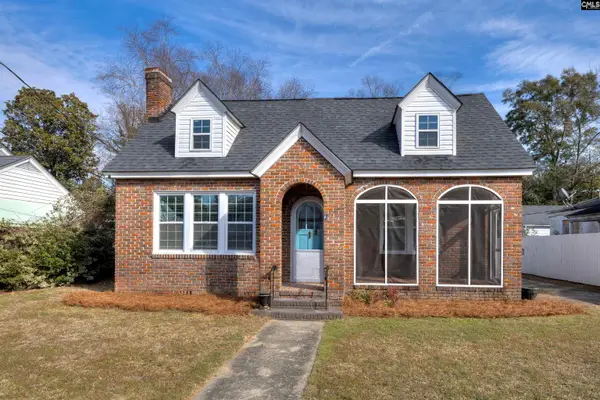 $194,000Active3 beds 2 baths1,460 sq. ft.
3 Warren, Sumter, SC 29150
MLS# 638012Listed by: COLDWELL BANKER REALTY 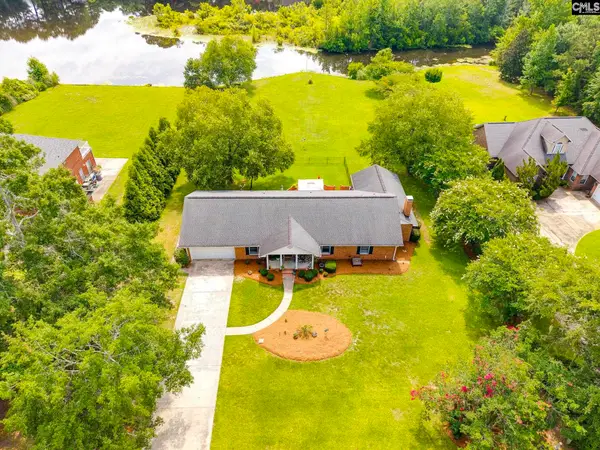 $326,500Active3 beds 3 baths2,229 sq. ft.
3315 Green View Parkway, Sumter, SC 29150
MLS# 637927Listed by: TZEDI CO REALTY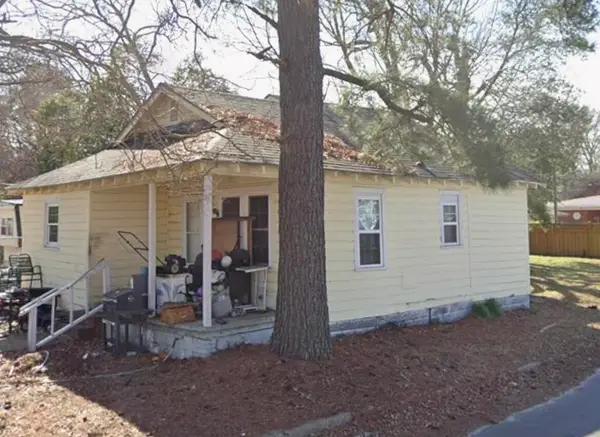 $60,000Active2 beds 2 baths922 sq. ft.
2 Green Lane, Sumter, SC 29150
MLS# 26019078Listed by: CAROLINA ONE REAL ESTATE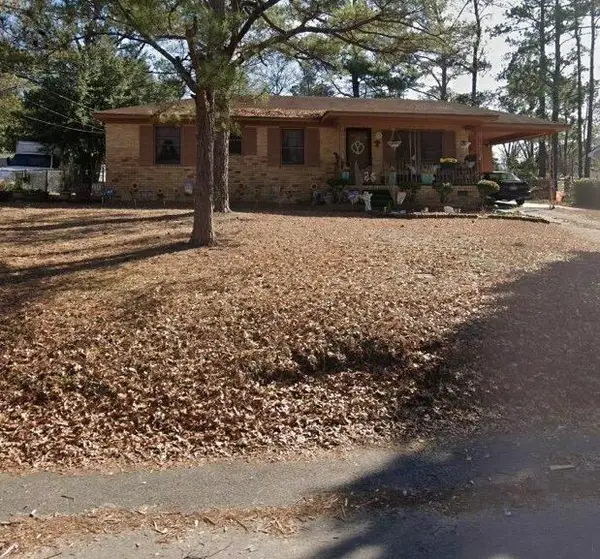 $125,000Active3 beds 2 baths1,056 sq. ft.
122 Perkins Avenue, Sumter, SC 29150
MLS# 26019070Listed by: CAROLINA ONE REAL ESTATE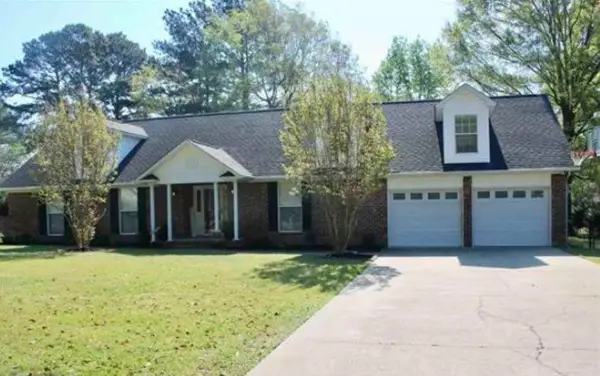 $379,000Active4 beds 3 baths2,468 sq. ft.
680 Torrey Pines Dr, Sumter, SC 29150
MLS# 2616720Listed by: EPPS MILES EADDY REALTY INC $189,900Active3 beds 2 baths1,533 sq. ft.
7 Victory Drive, Sumter, SC 29150
MLS# 637661Listed by: BEYCOME BROKERAGE REALTY LLC $155,000Active3 beds 1 baths1,145 sq. ft.
6 Emily Drive, Sumter, SC 29150
MLS# 637533Listed by: AVS REALTY $110,000Pending-- beds 2 baths1,651 sq. ft.
45 Highland Avenue, Sumter, SC 29150
MLS# 637537Listed by: AVS REALTY $55,000Active3 beds 2 baths1,245 sq. ft.
7 Short Street, Sumter, SC 29150
MLS# 637521Listed by: AVS REALTY $155,000Pending3 beds 1 baths1,175 sq. ft.
701 E Charlotte Avenue, Sumter, SC 29150
MLS# 637328Listed by: KELLER WILLIAMS REALTY $127,900Active3 beds 1 baths1,010 sq. ft.
205 Cuttino Road, Sumter, SC 29150
MLS# 510868Listed by: HILTON HEAD REAL ESTATE PARTNERS
 $290,000Active4 beds 2 baths2,376 sq. ft.
114 Horseshoe Cove, Sumter, SC 29150
MLS# 636559Listed by: KELLER WILLIAMS REALTY $125,000Pending-- beds 2 baths1,626 sq. ft.
48 Highland Avenue, Sumter, SC 29150
MLS# 636286Listed by: AVS REALTY $204,000Pending3 beds 2 baths1,343 sq. ft.
523 S Main Street, Sumter, SC 29150
MLS# 636258Listed by: LPT REALTY LLC $200,000Active3 beds 2 baths1,578 sq. ft.
541 W Calhoun Street, Sumter, SC 29150
MLS# 636074Listed by: EXP REALTY LLC $199,900Active3 beds 2 baths1,228 sq. ft.
480 Lee Street, Sumter, SC 29150
MLS# 635345Listed by: ADVANTAGE REALTY GROUP INC $325,000Pending5 beds 3 baths2,514 sq. ft.
20 Rallidae Court, Sumter, SC 29150
MLS# 635262Listed by: EXP REALTY LLC $80,000Active3 beds 1 baths1,464 sq. ft.
425 E Charlotte Avenue, Sumter, SC 29150
MLS# 635190Listed by: AVS REALTY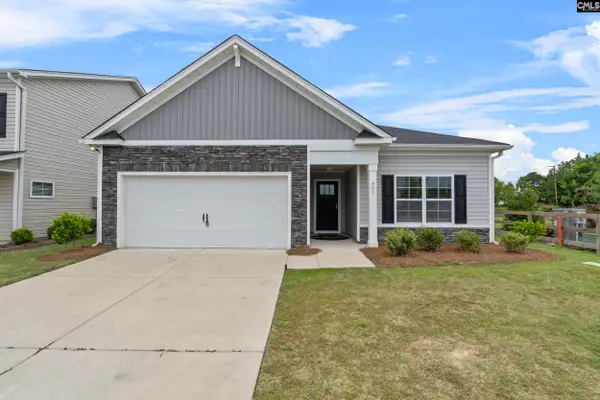 $240,900Pending3 beds 2 baths1,392 sq. ft.
635 Marbled Teal Lane, Hopkins, SC 29061
MLS# 635059Listed by: MCGUINN HOMES LLC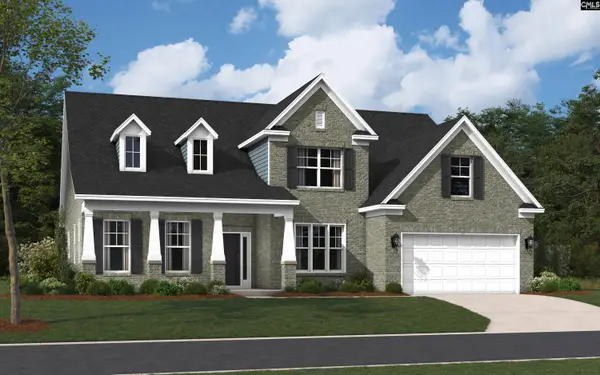 $485,230Pending5 beds 3 baths3,216 sq. ft.
3215 Trotter Court, Sumter, SC 29150
MLS# 632710Listed by: SM SOUTH CAROLINA BROKERAGE LLC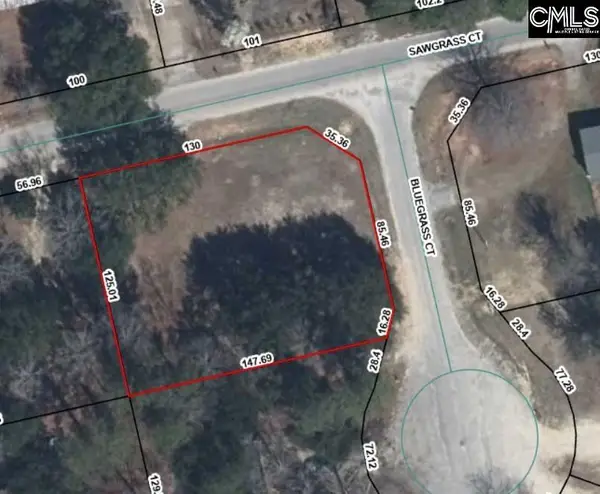 $30,000Active0.44 Acres
70 Sawgrass Court, Sumter, SC 29150
MLS# 634830Listed by: AVS REALTY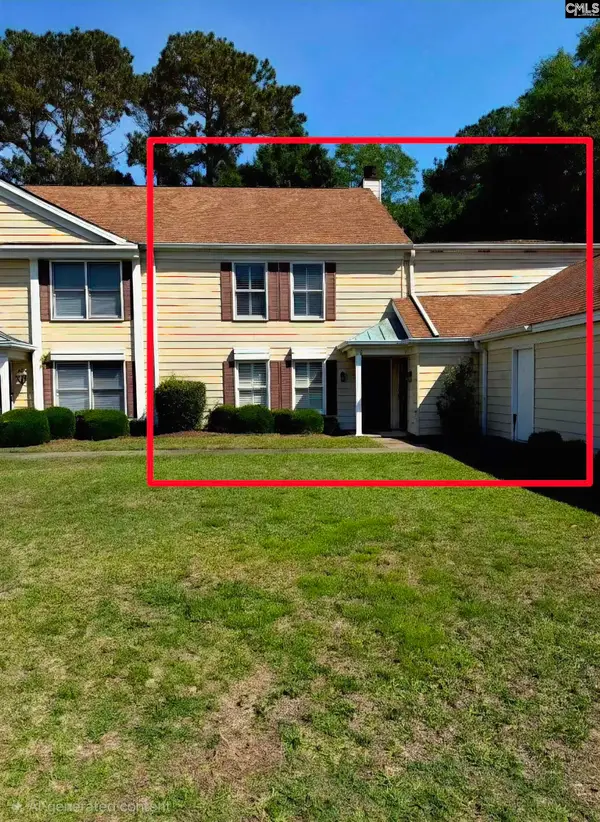 $154,000Active3 beds 3 baths1,763 sq. ft.
1038 N Guignard Drive, Sumter, SC 29150
MLS# 634683Listed by: COLDWELL BANKER REALTY $40,000Pending0.43 Acres
235 Sawgrass Court, Sumter, SC 29150
MLS# 26013687Listed by: COLDWELL BANKER TODD LAND AGENCY $14,900Active0.23 Acres
112 Brent Street, Sumter, SC 29150
MLS# 632608Listed by: HOMECOIN.COM $414,000Active4 beds 4 baths3,297 sq. ft.
219 Haynsworth Street, Sumter, SC 29150
MLS# 633258Listed by: KELLER WILLIAMS PALMETTO $210,000Active3 beds 2 baths1,442 sq. ft.
1 Kenilworth Avenue, Sumter, SC 29150
MLS# 633219Listed by: OPENDOOR BROKERAGE LLC $362,175Pending4 beds 3 baths2,729 sq. ft.
3350 Traveler Trail, Sumter, SC 29150
MLS# 632694Listed by: SM SOUTH CAROLINA BROKERAGE LLC $364,900Active4 beds 3 baths2,729 sq. ft.
3370 Traveler Trail, Sumter, SC 29150
MLS# 632698Listed by: SM SOUTH CAROLINA BROKERAGE LLC $343,000Active4 beds 3 baths2,455 sq. ft.
590 Edenwood Drive, Sumter, SC 29150
MLS# 632703Listed by: SM SOUTH CAROLINA BROKERAGE LLC $334,900Active3 beds 3 baths1,972 sq. ft.
1250 Winyah Street, Sumter, SC 29150
MLS# 632669Listed by: ERA WILDER REALTY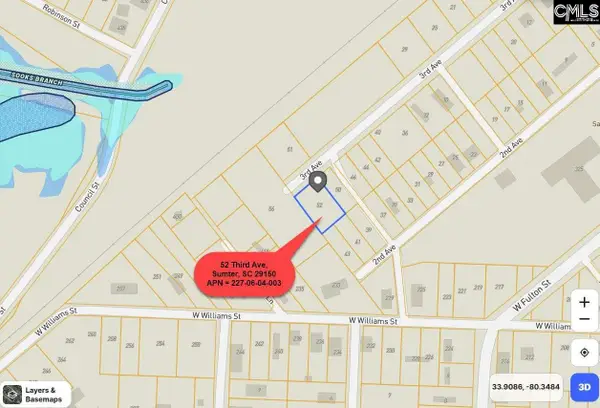 $13,900Active0.22 Acres
52 3rd Avenue, Sumter, SC 29150
MLS# 632414Listed by: CHOSEN REALTY LLC
 $344,900Pending5 beds 5 baths3,658 sq. ft.
2808 Loretto Drive, Sumter, SC 29150
MLS# 632092Listed by: CENTURY 21 VANGUARD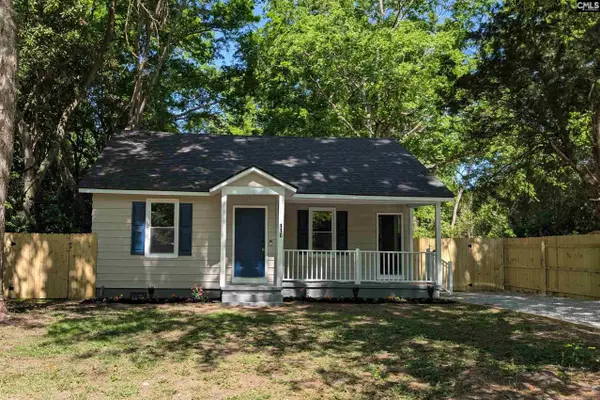 $160,000Pending3 beds 1 baths950 sq. ft.
110 Woodlawn Avenue, Sumter, SC 29152
MLS# 631918Listed by: UNITED REAL ESTATE SC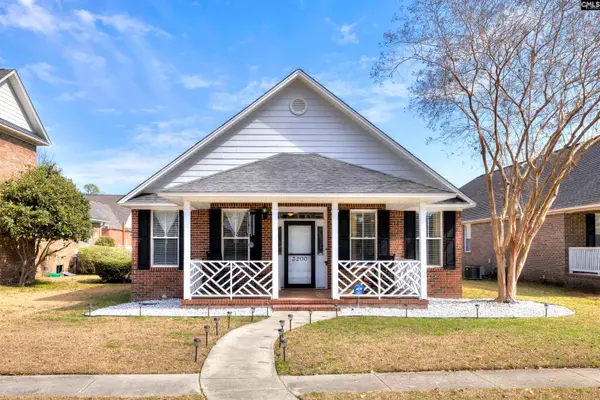 $299,000Active3 beds 2 baths2,382 sq. ft.
3200 Mayflower Lane, Sumter, SC 29150
MLS# 631517Listed by: KELLER WILLIAMS PALMETTO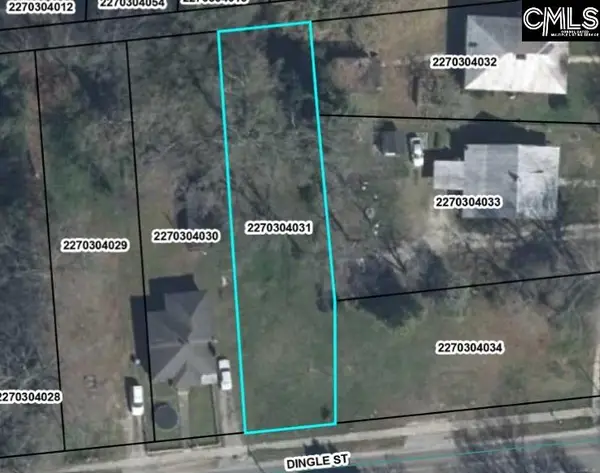 $12,500Active0.26 Acres
505 Dingle Street, Sumter, SC 29150
MLS# 631525Listed by: SOUTHERN VISIONS REALTY I LLC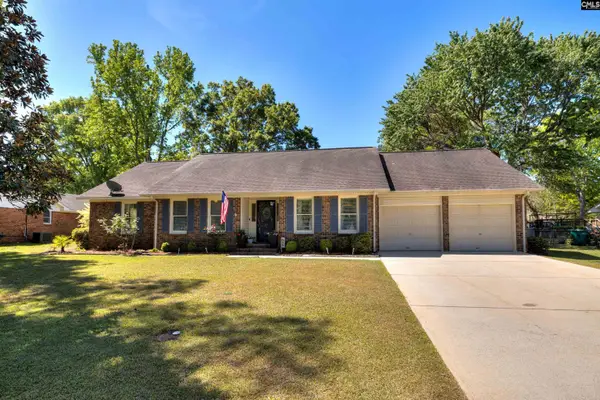 $297,000Active4 beds 2 baths2,179 sq. ft.
85 Planters Drive, Sumter, SC 29150
MLS# 631469Listed by: RE/MAX SUMMIT LLC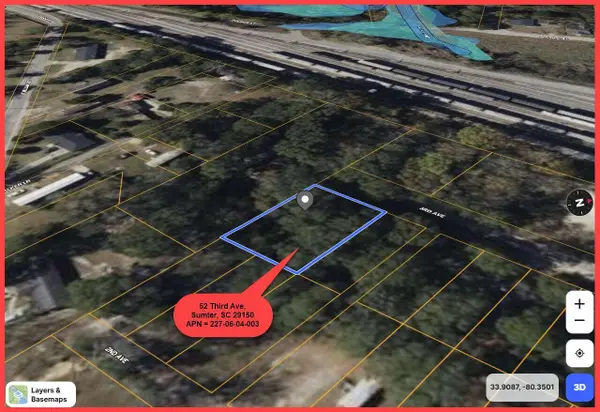 $13,900Active0.22 Acres
52 3rd Avenue, Sumter, SC 29150
MLS# 26009904Listed by: CHOSEN REALTY LLC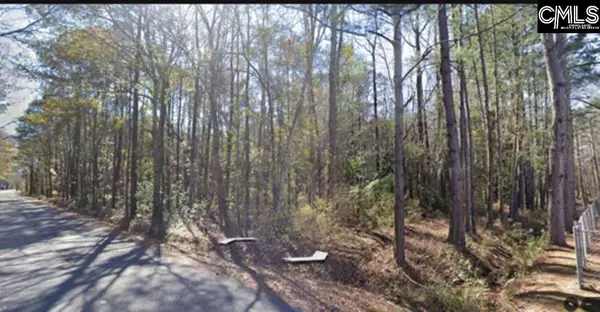 $12,000Active0.57 Acres
233 & 237 Poinsett Drive, Sumter, SC 29150
MLS# 631060Listed by: TRUHOME REALTY $684,900Active4 beds 4 baths3,586 sq. ft.
2885 Lillington Drive, Sumter, SC 29150
MLS# 630698Listed by: COLDWELL BANKER REALTY $249,500Active4 beds 2 baths2,214 sq. ft.
328 Stuckey Street, Sumter, SC 29150
MLS# 630409Listed by: KELLER WILLIAMS PALMETTO $200,000Pending3 beds 2 baths1,319 sq. ft.
509 Winn Street, Sumter, SC 29150
MLS# 630205Listed by: RE/MAX SUMMIT LLC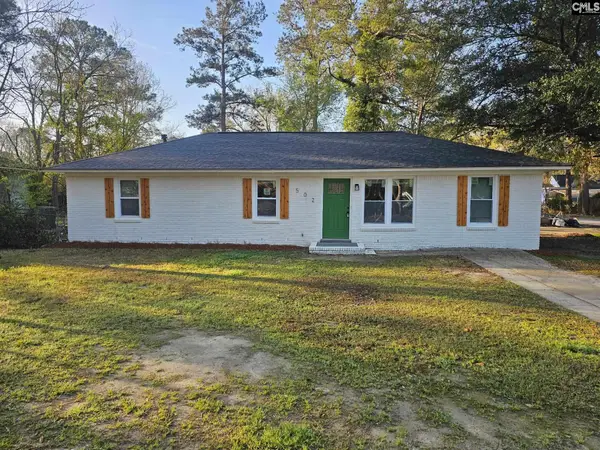 $159,900Active3 beds 1 baths1,251 sq. ft.
502 Dogwood Drive, Sumter, SC 29150
MLS# 629919Listed by: AGENT GROUP REALTY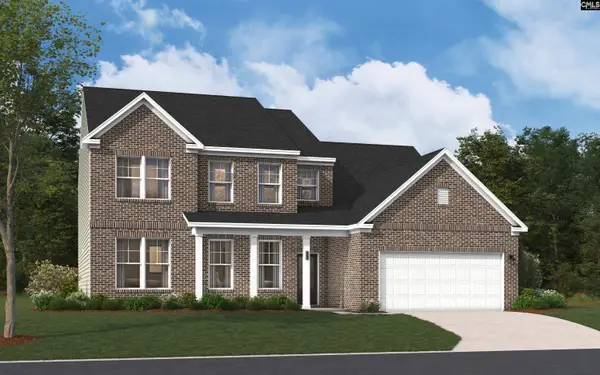 $470,090Pending5 beds 4 baths3,300 sq. ft.
440 Hacienda Court, Sumter, SC 29150
MLS# 629906Listed by: SM SOUTH CAROLINA BROKERAGE LLC $179,000Active5 Acres
260 N Bultman Drive, Sumter, SC 29150
MLS# 628902Listed by: GRAHAM REALTY, INC $8,200,000Active107.46 Acres
0 Beulah Cuttino Road, Sumter, SC 29150
MLS# 26005268Listed by: THE BOULEVARD COMPANY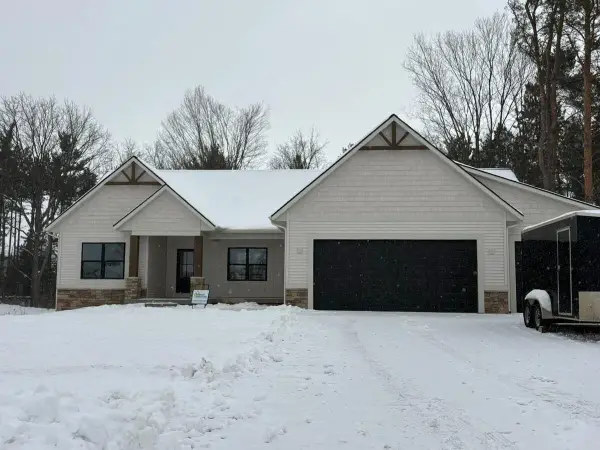 $614,900Active3 beds 2 baths1,622 sq. ft.
1800 Ringneck Court Nw, Grand Rapids, MI 49534
MLS# 26006405Listed by: KYLE VANDERSTEL REALTY GROUP, LLC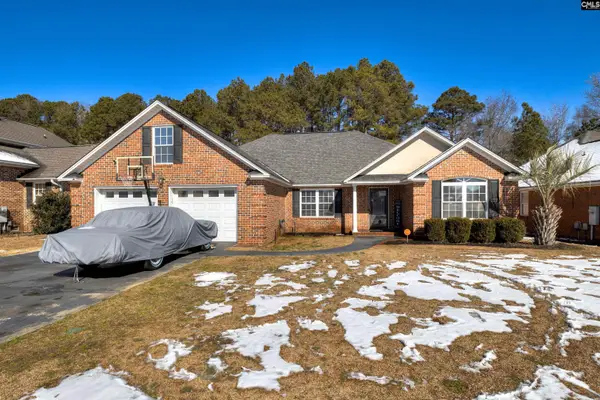 $325,000Pending5 beds 3 baths2,418 sq. ft.
3141 Daufaskie Road, Sumter, SC 29150
MLS# 626331Listed by: KELLER WILLIAMS PALMETTO $165,000Pending2 beds 2 baths1,443 sq. ft.
2234 Preot Street, Sumter, SC 29150
MLS# 625765Listed by: COLDWELL BANKER REALTY $39,900Active0.4 Acres
1123 Russell Avenue, Sumter, SC 29150
MLS# 625389Listed by: NANCY BRADLEY & ASSOCIATES LLC $129,000Active3 beds 1 baths1,021 sq. ft.
1924 Georgianna Drive, Sumter, SC 29150
MLS# 26001596Listed by: THE BOULEVARD COMPANY $249,900Pending5 beds 3 baths2,317 sq. ft.
2895 Old Field Road, Sumter, SC 29150
MLS# 623887Listed by: CENTURY 21 VANGUARD $7,900Active0.86 Acres
23 Middle Street, Sumter, SC 29150
MLS# 621949Listed by: CENTURY 21 VANGUARD $39,000Active3 beds 1 baths1,115 sq. ft.
33 White Street, Sumter, SC 29150
MLS# 621953Listed by: CENTURY 21 VANGUARD $39,000Active3 beds 1 baths924 sq. ft.
31 White Street, Sumter, SC 29150
MLS# 621928Listed by: CENTURY 21 VANGUARD $49,000Active4 beds 2 baths2,513 sq. ft.
24 Community Street, Sumter, SC 29150
MLS# 621743Listed by: CENTURY 21 VANGUARD $28,000Active1 beds 1 baths401 sq. ft.
9 Maney Street, Sumter, SC 29150
MLS# 621334Listed by: CENTURY 21 VANGUARD $141,900Pending32.52 Acres
0 Highway 15 Street, Sumter, SC 29150
MLS# 25024243Listed by: SELL YOUR HOME SERVICES, LLC $374,990Pending3 beds 3 baths1,767 sq. ft.
120 Henderson Street, Oswego, IL 60543
MLS# 12336575Listed by: JOHN GREENE, REALTOR $405,990Pending3 beds 3 baths1,840 sq. ft.
126 Henderson Street, Oswego, IL 60543
MLS# 12275211Listed by: JOHN GREENE, REALTOR
Local realty services provided by:CENTURY 21 The Harrelson Group, CENTURY 21 A Low Country Realty, CENTURY 21 Affiliated, CENTURY 21 North East
Last Updated: July 16, 2026 The data relating to real estate on this Web site derive in part from the Carolina Multiple Listing Services, Inc. IDX program. Brokers make an effort to deliver accurate information, but buyers should independently verify any information on which they will rely in a transaction. All properties are subject to prior sale, change or withdrawal. Neither CENTURY 21 The Harrelson Groupnor any listing broker shall be responsible for any typographical errors, misinformation, or misprints, and they shall be held totally harmless from any damages arising from reliance upon this data. This data is provided exclusively for consumers' personal, non-commercial use and may not be used for any purpose other than to identify prospective properties they may be interested in purchasing. Copyright 2026 Carolina Multiple Listing Services, Inc. SC_CML Member Broker: Richard Hine
Copyright 2026 Charleston Trident MLS. Information is being provided is for consumers' personal, non-commercial use and may not be used for any purpose other than to identify prospective properties consumers may be interested in purchasing. Information deemed reliable but not guaranteed. SC_CTAR Member Broker: Sherry Pitman
Provided courtesy of the Coastal Carolinas MLS. © 2026 of the Coastal Carolinas MLS. All rights reserved. Information is provided exclusively for consumers' personal, non-commercial use, and may not be used for any purpose other than to identify prospective properties consumers may be interested in purchasing. Data is deemed reliable but is not guaranteed accurate by the Coastal Carolinas MLS. SC_CCAR Member Broker: Margaret McBride
Copyright 2026 Midwest Real Estate Data LLC. All rights reserved. The data relating to real estate for sale on this web site comes in part from the Broker Reciprocity Program of the Midwest Real Estate Data LLC. Listing information is deemed reliable but not guaranteed. MLSNI Member Broker: Nate Brown
Popular searches near 29150
Popular neighborhoods near 29150
- Alexander Pointe, Hopkins homes for sale
- Ashcroft, Columbia homes for sale
- Berkley Forest, Columbia homes for sale
- Bernside Farms, Columbia homes for sale
- Catawba Hill, Pontiac homes for sale
- Caughman Park, Columbia homes for sale
- Caughman Place, Columbia homes for sale
- Charlestowne, Columbia homes for sale
- Crossbridge, Pontiac homes for sale
- Hazelwood Acres, Columbia homes for sale
- Hickory Ridge, Columbia homes for sale
- Lake Pointe, Columbia homes for sale
- Liberty Ridge, Pontiac homes for sale
- Reflections, Columbia homes for sale
- Royal Pines Estates, Columbia homes for sale
- The Park, Pontiac homes for sale
- The Valley, Pontiac homes for sale
- Waterbury, Columbia homes for sale
- Wildewood, Columbia homes for sale
- Woodcreek Farms, Pontiac homes for sale
Counties near Sumter, 29150
- Bamberg County homes for sale
- Berkeley County homes for sale
- Calhoun County homes for sale
- Chesterfield County homes for sale
- Clarendon County homes for sale
- Darlington County homes for sale
- Dillon County homes for sale
- Dorchester County homes for sale
- Fairfield County homes for sale
- Florence County homes for sale
- Kershaw County homes for sale
- Lancaster County homes for sale
- Lee County homes for sale
- Lexington County homes for sale
- Marion County homes for sale
- Marlboro County homes for sale
- Orangeburg County homes for sale
- Richland County homes for sale
- Sumter County homes for sale
- Williamsburg County homes for sale
Protect your home and budget from life's surprises with an Assurant Home Warranty, backed by a partner that supports you through every step of homeownership. Explore Plans.
©2026 Century 21 Real Estate LLC. All rights reserved. CENTURY 21®, the CENTURY 21 Logo and C21® are service marks owned by Century 21 Real Estate LLC. Century 21 Real Estate LLC fully supports the principles of the Fair Housing Act and the Equal Opportunity Act. Each office is independently owned and operated. Listing information is deemed reliable but not guaranteed accurate.