- Allen Park, Miami homes for sale
- Aventura, Miami homes for sale
- Biscayne North, North Miami Beach homes for sale
- Biscayne South, North Miami Beach homes for sale
- Eastern Shores, North Miami Beach homes for sale
- Golden Beach, North Miami Beach homes for sale
- Highland Village, Miami homes for sale
- Ives Estate, Miami homes for sale
- Kings Point, Sunny Isles Beach homes for sale
- North Miami Beach City Center, Miami homes for sale
- Oakgrove, Miami homes for sale
- Ojus, Miami homes for sale
- Pickwick, Miami homes for sale
- Skylake, Miami homes for sale
- Sunny Isles, North Miami Beach homes for sale
- Sunray West, Miami homes for sale
- The Waterways, Miami homes for sale
- Uleta, Miami homes for sale
- Williams Island, Aventura homes for sale
- Winward, Miami homes for sale
Sunray East, North Miami Beach, FL - homes for sale
32 of 32 results displayed
- New
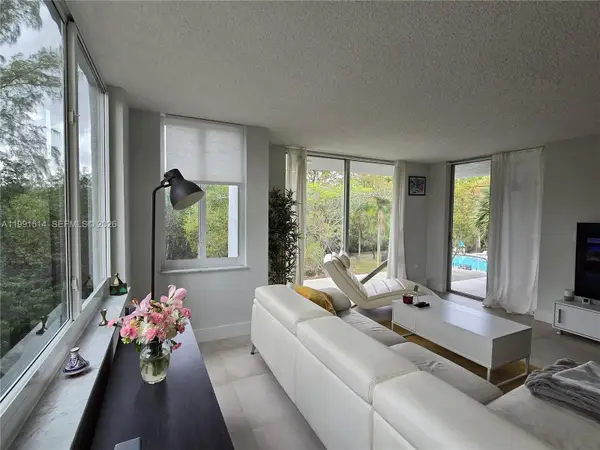 $340,000Active3 beds 2 baths1,652 sq. ft.
17890 W Dixie Hwy #307, North Miami Beach, FL 33160
MLS# A11991514Listed by: PARTNERSHIP REALTY INC. - New
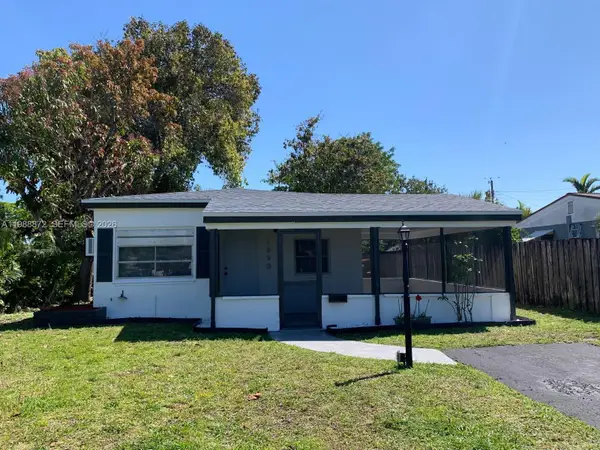 $449,000Active3 beds 1 baths1,012 sq. ft.
1990 NE 181st St, North Miami Beach, FL 33162
MLS# A11988872Listed by: FABIAN REALTY INC  $949,000Active3 beds 2 baths2,040 sq. ft.
1960 NE 182nd St, North Miami Beach, FL 33162
MLS# A11981195Listed by: DOUGLAS ELLIMAN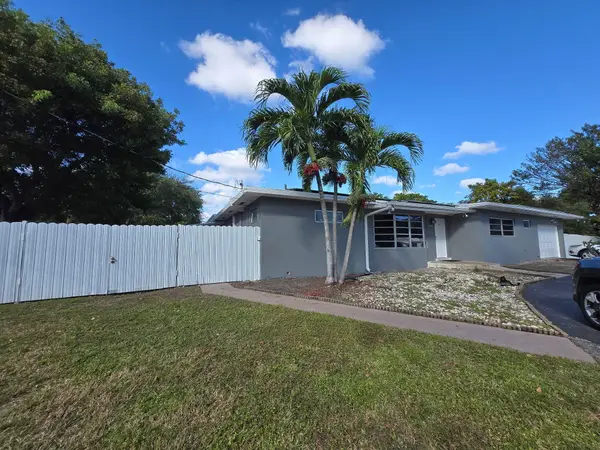 $985,000Active4 beds 3 baths2,514 sq. ft.
17390 NE 22nd Avenue, North Miami Beach, FL 33160
MLS# B26002637Listed by: UNITED REALTY GROUP INC $539,000Active3 beds 2 baths1,536 sq. ft.
2048 NE 180th St, North Miami Beach, FL 33162
MLS# A11978815Listed by: SOL/MAR REAL ESTATE LLC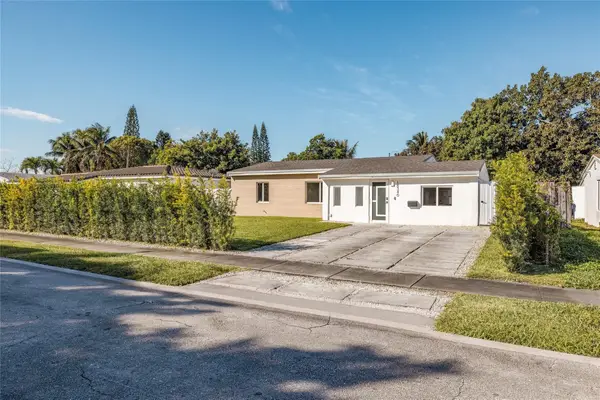 $715,900Active3 beds 2 baths1,466 sq. ft.
18340 NE 20th Court, North Miami Beach, FL 33179
MLS# F10551104Listed by: M18 PROPERTY GROUP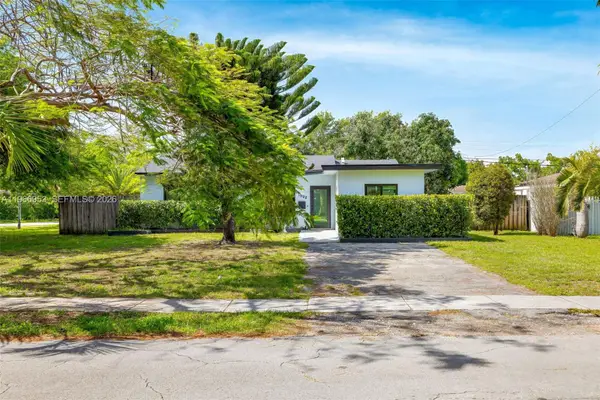 $720,000Active3 beds 2 baths1,492 sq. ft.
1998 NE 180th St, North Miami Beach, FL 33162
MLS# A11966953Listed by: MIAMI NEW REALTY $1,450,000Active3 beds 2 baths1,433 sq. ft.
18500 NE 23rd Ct, Miami, FL 33180
MLS# A11959677Listed by: ONE SOTHEBY'S INTERNATIONAL REALTY $645,900Active4 beds 3 baths2,111 sq. ft.
18441 NE 21st Ave, North Miami Beach, FL 33179
MLS# A11965420Listed by: BEACHFRONT REALTY INC $820,000Active4 beds 3 baths1,556 sq. ft.
2375 NE 185th St, Miami, FL 33180
MLS# A11955638Listed by: EQUITY REAL PROPERTY AND MGT. $740,000Active-- beds -- baths1,778 sq. ft.
2470-2472 NE 182nd Ter, North Miami Beach, FL 33160
MLS# A11954873Listed by: ROBERT SLACK LLC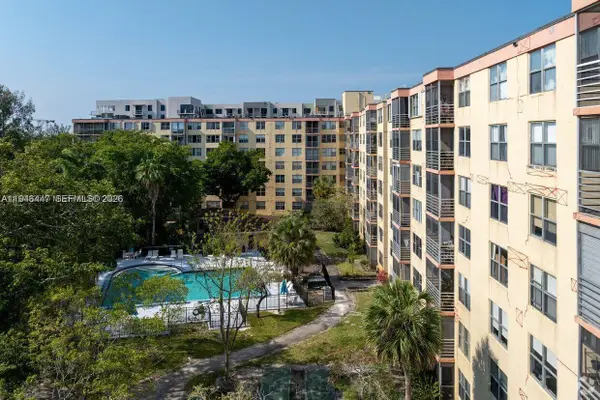 $168,000Active2 beds 2 baths1,213 sq. ft.
17890 W Dixie #302, Miami, FL 33160
MLS# A11946447Listed by: YAFFE INTERNATIONAL REALTY $265,000Active2 beds 2 baths1,213 sq. ft.
17890 W Dixie #603, North Miami Beach, FL 33160
MLS# A11945299Listed by: UNITED REALTY GROUP INC $180,000Pending2 beds 2 baths1,213 sq. ft.
17890 W Dixie Hwy 614 Hwy #614, North Miami Beach, FL 33160
MLS# A11933068Listed by: AVANTI WAY BRICKELL $500,000Active3 beds 2 baths1,254 sq. ft.
2063 NE 173rd St, North Miami Beach, FL 33162
MLS# A11931294Listed by: COMPASS FLORIDA, LLC $769,000Active0.15 Acres
2410 NE 184st, North Miami Beach, FL 33160
MLS# A11925005Listed by: SWANN REALTY PARTNERS, LLC. $770,000Active-- beds -- baths1,911 sq. ft.
2540 NE 181st St, North Miami Beach, FL 33160
MLS# A11903391Listed by: BEACHFRONT REALTY INC $1,760,000Active5 beds 5 baths3,300 sq. ft.
2572 NE 182nd Ter, North Miami Beach, FL 33160
MLS# A11913477Listed by: SWANN REALTY PARTNERS, LLC. $319,000Active3 beds 2 baths1,652 sq. ft.
17890 W Dixie Hwy #606, North Miami Beach, FL 33160
MLS# A11900953Listed by: BEACHFRONT REALTY INC $649,000Active3 beds 2 baths1,416 sq. ft.
1980 NE 173rd St, North Miami Beach, FL 33162
MLS# A11890739Listed by: UNITED REALTY GROUP INC $179,999Active2 beds 2 baths1,213 sq. ft.
17890 W Dixie Hwy 421 Hwy #421, North Miami Beach, FL 33160
MLS# A11896789Listed by: NEW EMPORIUM PROPERTIES, INC. $179,000Active1 beds 2 baths928 sq. ft.
17890 W Dixie Hwy 319 Hwy #319, North Miami Beach, FL 33160
MLS# A11893004Listed by: KELLER WILLIAMS REALTY INTERNATIONAL LIFESTYLES $725,000Active3 beds 2 baths1,475 sq. ft.
2515 NE 182nd St, North Miami Beach, FL 33160
MLS# A11880985Listed by: COLFAX REALTY INTERNATIONAL INC $320,000Active3 beds 2 baths1,652 sq. ft.
17890 W Dixie Hwy #106, North Miami Beach, FL 33160
MLS# A11980899Listed by: DEZER PLATINUM REALTY LLC $1,079,000Active-- beds -- baths2,142 sq. ft.
1958 NE 172nd St, North Miami Beach, FL 33162
MLS# A11856839Listed by: JDM REALTY GROUP, INC $3,750,000Active0.23 Acres
18560 Biscayne Blvd, Aventura, FL 33180
MLS# A11852563Listed by: THE KEYES COMPANY $249,000Active2 beds 2 baths1,213 sq. ft.
17890 W Dixie Highway #714, North Miami Beach, FL 33160
MLS# A11775656Listed by: JULIES REALTY, LLC $330,000Active3 beds 2 baths1,652 sq. ft.
17890 W Dixie Hwy 318 Hwy #3, North Miami Beach, FL 33160
MLS# A11771999Listed by: OPTIMAR INTERNATIONAL REALTY $529,000Active3 beds 2 baths814 sq. ft.
2465 NE 184th St, North Miami Beach, FL 33160
MLS# A11756905Listed by: MIRI SELLS MIAMI, LLC $649,500Active1 beds 1 baths795 sq. ft.
18550 NE Ne 23rd Ct #209, Unincorporated Dade, FL 33180
MLS# A11733755Listed by: COMPASS FLORIDA, LLC. $275,000Active2 beds 2 baths1,213 sq. ft.
17890 W Dixie Hwy 601 Hwy #601, North Miami Beach, FL 33160
MLS# A11612160Listed by: FLORIDA REALTY OF MIAMI CORP $799,500Pending3 beds 4 baths1,012 sq. ft.
2198 NE 183rd St, North Miami Beach, FL 33179
MLS# A11576409Listed by: FIP REALTY SERVICES, LLC
Local realty services provided by:CENTURY 21 World Connection, CENTURY 21 AllPoints Realty
Information deemed reliable but not guaranteed. Information is provided, in part, by Greater Miami MLS. This information being provided is for consumer's personal, non-commercial use and may not be used for any other purpose other than to identify prospective properties consumers may be interested in purchasing.
Popular neighborhoods near Sunray East, North Miami Beach, FL
Zip codes near Sunray East, North Miami Beach, FL
- 33009 homes for sale
- 33019 homes for sale
- 33020 homes for sale
- 33021 homes for sale
- 33023 homes for sale
- 33054 homes for sale
- 33056 homes for sale
- 33138 homes for sale
- 33141 homes for sale
- 33150 homes for sale
- 33154 homes for sale
- 33160 homes for sale
- 33161 homes for sale
- 33162 homes for sale
- 33167 homes for sale
- 33168 homes for sale
- 33169 homes for sale
- 33179 homes for sale
- 33180 homes for sale
- 33181 homes for sale
Protect your home and budget from life's surprises with an Assurant Home Warranty, backed by a partner that supports you through every step of homeownership. Explore Plans.
©2026 Century 21 Real Estate LLC. All rights reserved. CENTURY 21®, the CENTURY 21 Logo and C21® are service marks owned by Century 21 Real Estate LLC. Century 21 Real Estate LLC fully supports the principles of the Fair Housing Act and the Equal Opportunity Act. Each office is independently owned and operated. Listing information is deemed reliable but not guaranteed accurate.