Swan Valley, ID - homes for sale
13 of 13 results displayed
- New
 $235,000Active3.03 Acres
Lt 5 Blk 1 Wapiti Run, SWAN VALLEY, ID 83449
MLS# 2184939Listed by: EVOLV BROKERAGE 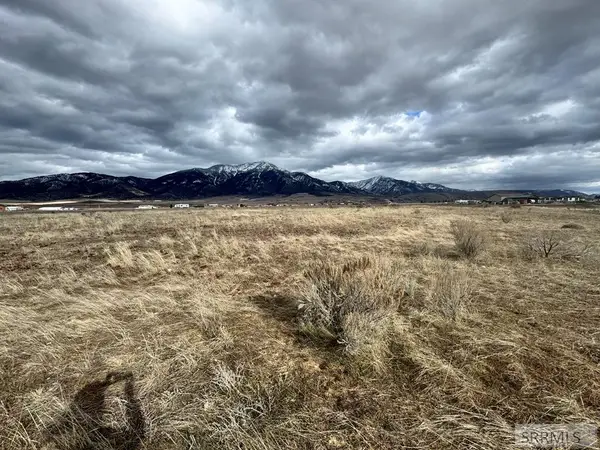
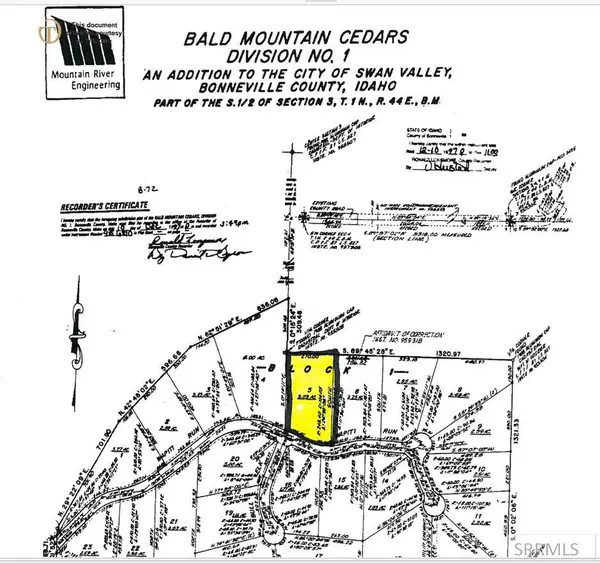
 $235,000Active6.3 Acres
TBD Tumbleweed Drive, SWAN VALLEY, ID 83449
MLS# 2184498Listed by: CENTURY 21 HIGH DESERT $142,871Pending2.51 Acres
112 Elk Path, Swan Valley, ID 83428
MLS# 98968073Listed by: HOMES OF IDAHO- $145,718Pending2.56 Acres
116 Elk Path, Swan Valley, ID 83428
MLS# 98968075Listed by: HOMES OF IDAHO - $151,410Pending2.66 Acres
122 Elk Path, Swan Valley, ID 83428
MLS# 98968076Listed by: HOMES OF IDAHO 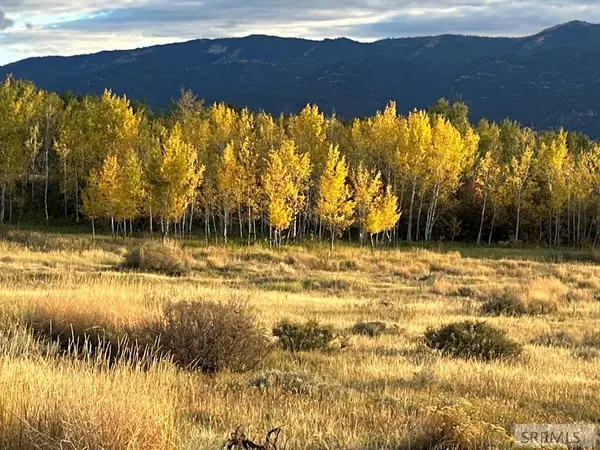 $200,000Pending2.85 Acres
170 Elk Path, SWAN VALLEY, ID 83449
MLS# 2179917Listed by: KELLER WILLIAMS TETON VALLEY, IDAHO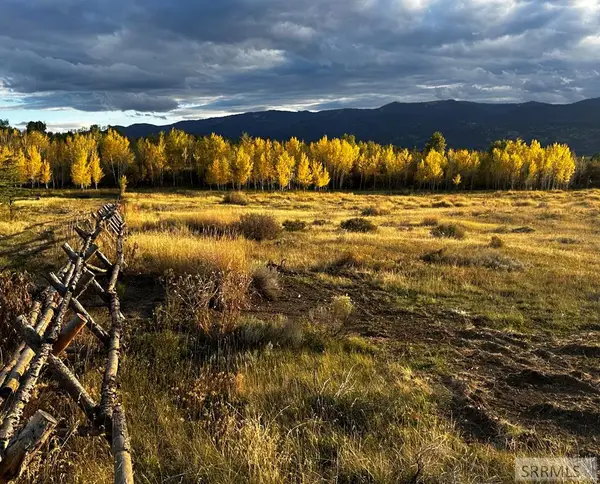 $275,000Pending3.34 Acres
176 Elk Path, SWAN VALLEY, ID 83449
MLS# 2179916Listed by: KELLER WILLIAMS TETON VALLEY, IDAHO $335,000Active2.96 Acres
TBD Whitetail Drive, SWAN VALLEY, ID 83449
MLS# 2179716Listed by: KELLER WILLIAMS TETON VALLEY, IDAHO- $400,000Active3.2 Acres
TBD Trumpeter Road, SWAN VALLEY, ID 83449
MLS# 2177797Listed by: SILVERCREEK REALTY GROUP  $399,000Active5 Acres
L1B1 Grand View Heights, SWAN VALLEY, ID 83449
MLS# 2180292Listed by: REAL BROKER LLC $399,000Active5 Acres
L2B1 Grand View Heights, SWAN VALLEY, ID 83449
MLS# 2180293Listed by: REAL BROKER LLC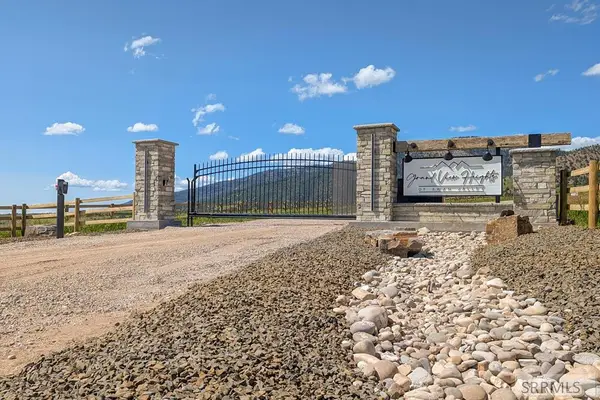 $550,000Active7 Acres
L6B1 Grand View Heights, SWAN VALLEY, ID 83449
MLS# 2180294Listed by: REAL BROKER LLC $550,000Active7 Acres
L7B1 Grand View Heights, SWAN VALLEY, ID 83449
MLS# 2180295Listed by: REAL BROKER LLC
Local realty services provided by:CENTURY 21 High Desert, CENTURY 21 Northstar
Property information provided by the RAFGC MLS – a service of the REALTOR® Association of Franklin & Gulf Counties.
Neighborhoods near Swan Valley, ID
Zip codes near Swan Valley, ID
- 83014 homes for sale
- 83025 homes for sale
- 83118 homes for sale
- 83120 homes for sale
- 83285 homes for sale
- 83401 homes for sale
- 83406 homes for sale
- 83414 homes for sale
- 83422 homes for sale
- 83424 homes for sale
- 83427 homes for sale
- 83428 homes for sale
- 83436 homes for sale
- 83440 homes for sale
- 83442 homes for sale
- 83443 homes for sale
- 83449 homes for sale
- 83451 homes for sale
- 83452 homes for sale
- 83455 homes for sale
Popular searches near Swan Valley, ID
- Alpine homes for sale
- Alpine Northeast homes for sale
- Alpine Northwest homes for sale
- Alta homes for sale
- Driggs homes for sale
- Hoback homes for sale
- Irwin homes for sale
- Jackson homes for sale
- Moose Wilson Rd homes for sale
- Newdale homes for sale
- Nordic homes for sale
- Rafter J Ranch homes for sale
- Ririe homes for sale
- Ririe homes for sale
- South Park homes for sale
- Teton Village homes for sale
- Tetonia homes for sale
- Victor homes for sale
- Wayan homes for sale
- Wilson homes for sale
Protect your home and budget from life's surprises with an Assurant Home Warranty, backed by a partner that supports you through every step of homeownership. Explore Plans.
©2026 Century 21 Real Estate LLC. All rights reserved. CENTURY 21®, the CENTURY 21 Logo and C21® are service marks owned by Century 21 Real Estate LLC. Century 21 Real Estate LLC fully supports the principles of the Fair Housing Act and the Equal Opportunity Act. Each office is independently owned and operated. Listing information is deemed reliable but not guaranteed accurate.