- Astoria Township homes for sale
- Astoria homes for sale
- Bushnell Township homes for sale
- Bushnell homes for sale
- Cuba homes for sale
- Georgetown homes for sale
- Havana homes for sale
- Industry homes for sale
- Industry Township homes for sale
- Lewistown homes for sale
- Lewistown Township homes for sale
- Macomb Township homes for sale
- Macomb homes for sale
- Macomb City homes for sale
- Putman homes for sale
- Rushville township homes for sale
- Scotland homes for sale
- Table Grove homes for sale
- Vermont Township homes for sale
- Walnut Grove homes for sale
61482, IL - homes for sale
4 of 4 results displayed
 $760,000Active3 beds 2 baths4,656 sq. ft.
868 E County Highway 3 Highway, Table Grove, IL 61482
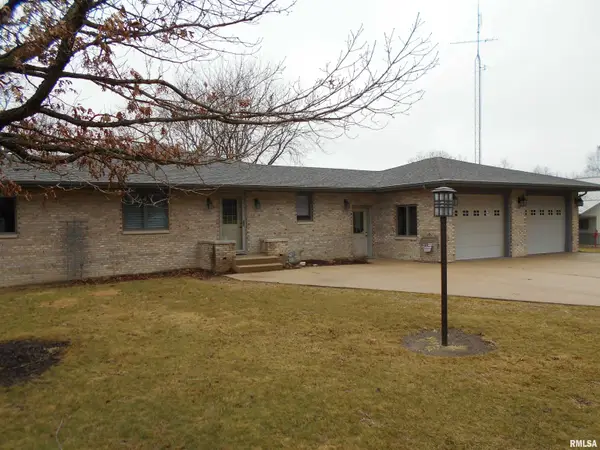
MLS# PA1264918Listed by: REMAX ALIGNED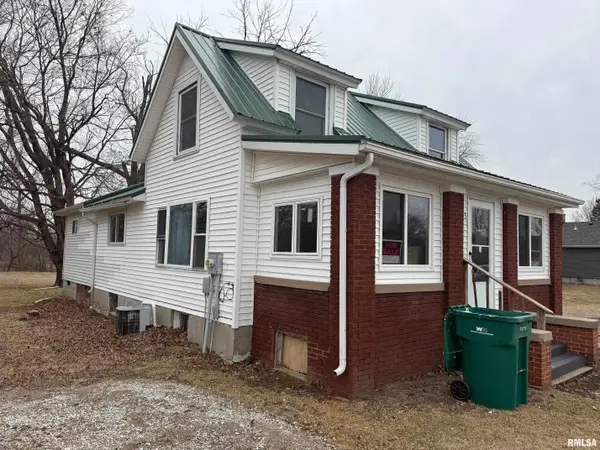 $79,900Active4 beds 1 baths1,872 sq. ft.
305 W Market Street, Table Grove, IL 61482
MLS# CA1041983Listed by: THE REAL ESTATE GROUP, INC. $35,000Pending2 beds 2 baths1,440 sq. ft.
109 E Laurel Street, Table Grove, IL 61482
MLS# PA1262111Listed by: TNT REALTY GROUP, INC.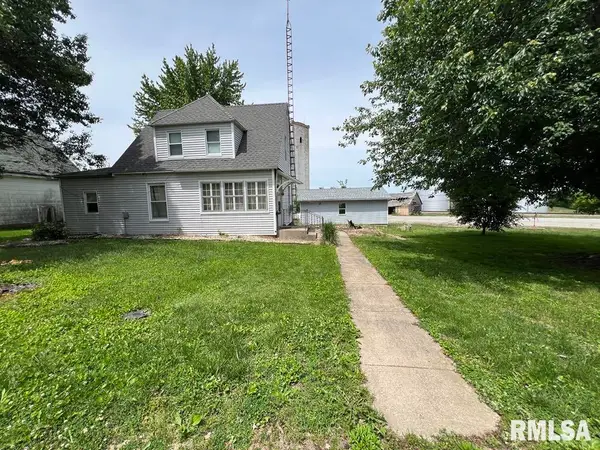 $45,000Active3 beds 1 baths1,196 sq. ft.
102 & 104 W 1st Street, Table Grove, IL 61482
MLS# PA1262647Listed by: TNT REALTY GROUP, INC.
Local realty services provided by:CENTURY 21 Signature Real Estate
Popular searches near 61482
Popular neighborhoods near 61482
- Bartonville, Peoria homes for sale
- Hamilton Park, Peoria homes for sale
- Hilltop Manor, Creve Coeur homes for sale
- Lake Camelot, Mapleton homes for sale
- Lynnhurst, Peoria homes for sale
- Moss Bradley, Peoria homes for sale
- Northwest Peoria, Peoria homes for sale
- Norwood Park, Peoria homes for sale
- Park East, Peoria homes for sale
- Pekin Gardens, Pekin homes for sale
- Sommer Place, Edwards homes for sale
- South Peoria, Peoria homes for sale
- Sunset Hills, Pekin homes for sale
- Village Grande, Peoria homes for sale
- Wardcliffe, Peoria homes for sale
- Weaver Ridge, Peoria homes for sale
- Wee-Ma-Tuk, Cuba homes for sale
- West Laramie, Peoria homes for sale
- West Peoria, Peoria homes for sale
- West Peoria, Peoria homes for sale
Counties near Table Grove, 61482
- Adams County homes for sale
- Brown County homes for sale
- Cass County homes for sale
- Des Moines County homes for sale
- Fulton County homes for sale
- Hancock County homes for sale
- Henderson County homes for sale
- Knox County homes for sale
- Logan County homes for sale
- Mason County homes for sale
- McDonough County homes for sale
- Menard County homes for sale
- Morgan County homes for sale
- Peoria County homes for sale
- Sangamon County homes for sale
- Schuyler County homes for sale
- Scott County homes for sale
- Stark County homes for sale
- Tazewell County homes for sale
- Warren County homes for sale
Protect your home and budget from life's surprises with an Assurant Home Warranty, backed by a partner that supports you through every step of homeownership. Explore Plans.
©2026 Century 21 Real Estate LLC. All rights reserved. CENTURY 21®, the CENTURY 21 Logo and C21® are service marks owned by Century 21 Real Estate LLC. Century 21 Real Estate LLC fully supports the principles of the Fair Housing Act and the Equal Opportunity Act. Each office is independently owned and operated. Listing information is deemed reliable but not guaranteed accurate.