- Adelphi, Hyattsville homes for sale
- Brightwood, Washington homes for sale
- Brightwood Park, Washington homes for sale
- Chillum, Hyattsville homes for sale
- Colonial Village, Washington homes for sale
- Fort Totten, Washington homes for sale
- Hyattsville, Hyattsville homes for sale
- Lamond Riggs, Washington homes for sale
- Langley Park, Hyattsville homes for sale
- Manor Park, Washington homes for sale
- Michigan Park, Washington homes for sale
- North Michigan Park, Washington homes for sale
- Petworth, Washington homes for sale
- Pleasant Hill, Washington homes for sale
- Queens Chapel, Washington homes for sale
- Shepherd Park, Washington homes for sale
- Silver Spring, Silver Spring homes for sale
- Takoma, Washington homes for sale
- Takoma Park, Takoma Park homes for sale
- Walter Reed Army Medical Center, Washington homes for sale
Takoma Park, MD - homes for sale
53 of 53 results displayed
- New
 $659,900Active4 beds -- baths2,100 sq. ft.
805 Houston Ave, TAKOMA PARK, MD 20912
MLS# MDMC2215958Listed by: SMART REALTY, LLC - Open Wed, 5 to 6pmNew
 $1,099,000Active2 beds 1 baths
7801 Lockney Ave, TAKOMA PARK, MD 20912
MLS# MDMC2218614Listed by: IKON REALTY - New
 $599,000Active3 beds 3 baths1,672 sq. ft.
805 Forston St, TAKOMA PARK, MD 20912
MLS# MDMC2209156Listed by: COMPASS - New
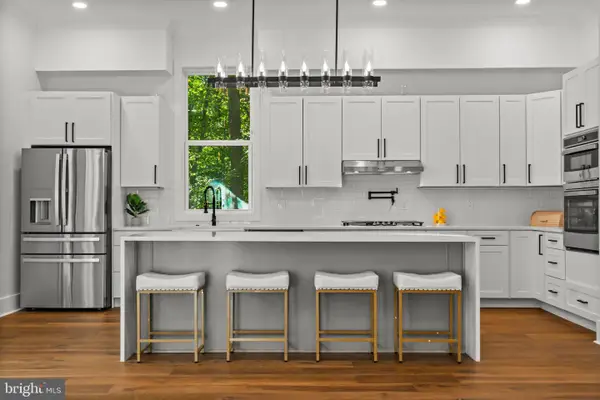
 $849,999Active3 beds -- baths2,333 sq. ft.
8203 Greenwood Ave, TAKOMA PARK, MD 20912
MLS# MDMC2218450Listed by: STEWART REAL ESTATE, LLC - Coming Soon
 $1,190,000Coming Soon6 beds 5 baths
908 Davis Ave, TAKOMA PARK, MD 20912
MLS# MDMC2218386Listed by: SAMSON PROPERTIES - New
 $199,900Active2 beds 1 baths993 sq. ft.
7333 New Hampshire Ave #509, TAKOMA PARK, MD 20912
MLS# MDMC2218326Listed by: CONTINENTAL PROPERTIES, LTD. - New
 $249,900Active2 beds 2 baths1,172 sq. ft.
7333 New Hampshire Ave #712 S, TAKOMA PARK, MD 20912
MLS# MDMC2217340Listed by: BETTER HOMES AND GARDENS REAL ESTATE RESERVE - Open Wed, 5 to 6pmNew
 $1,099,000Active8 beds -- baths
7801 Lockney Ave, TAKOMA PARK, MD 20912
MLS# MDMC2217576Listed by: IKON REALTY  $759,000Pending3 beds 3 baths1,536 sq. ft.
6711 Poplar Ave, TAKOMA PARK, MD 20912
MLS# MDMC2214620Listed by: PERENNIAL REAL ESTATE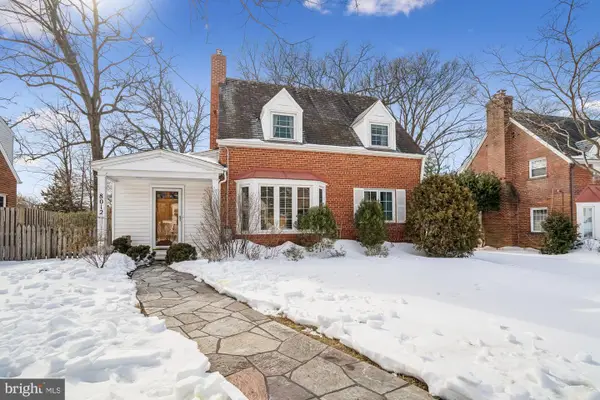 $700,000Pending3 beds 2 baths1,571 sq. ft.
8012 Barron St, TAKOMA PARK, MD 20912
MLS# MDMC2215830Listed by: WEICHERT, REALTORS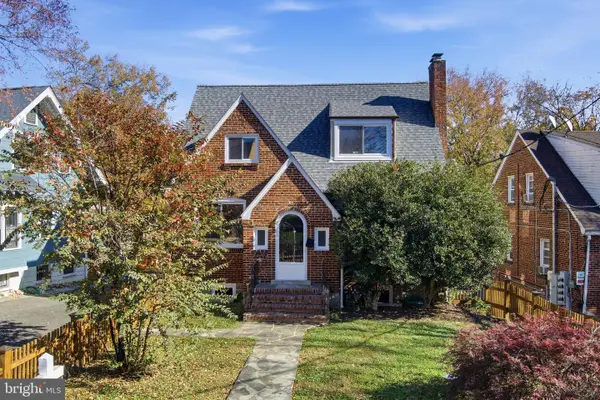 $939,000Active4 beds 4 baths3,145 sq. ft.
8209 Flower Ave, TAKOMA PARK, MD 20912
MLS# MDMC2216516Listed by: CUPID REAL ESTATE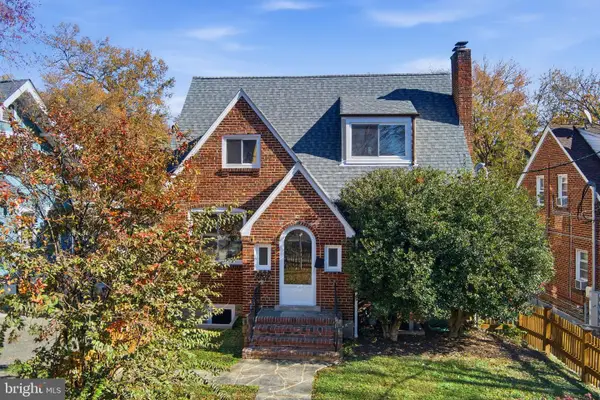 $939,000Active4 beds -- baths3,145 sq. ft.
8209 Flower Ave, TAKOMA PARK, MD 20912
MLS# MDMC2216514Listed by: CUPID REAL ESTATE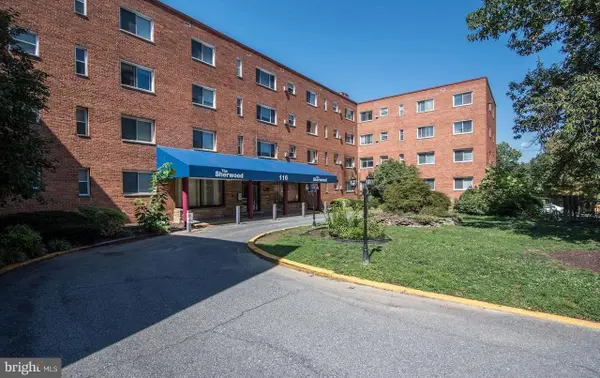 $199,000Active3 beds 2 baths1,248 sq. ft.
-116 Lee Avenue #110, TAKOMA PARK, MD 20912
MLS# MDMC2215584Listed by: LONG & FOSTER REAL ESTATE, INC.- Coming Soon
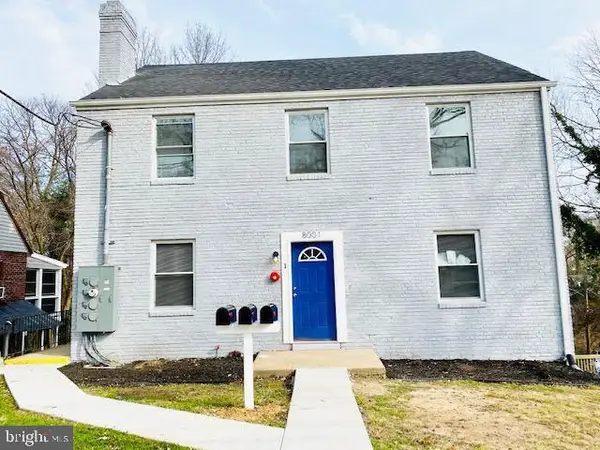 $899,500Coming Soon6 beds -- baths
8001 Garland Ave, TAKOMA PARK, MD 20912
MLS# MDMC2215480Listed by: REAL BROKER, LLC  $539,900Active3 beds 2 baths1,604 sq. ft.
8506 Glenville Rd, TAKOMA PARK, MD 20912
MLS# MDMC2215162Listed by: SAMSON PROPERTIES $400,000Pending3 beds 3 baths1,350 sq. ft.
14 Seek Ct, TAKOMA PARK, MD 20912
MLS# MDMC2214714Listed by: KELLER WILLIAMS FLAGSHIP $550,000Active3 beds 3 baths1,130 sq. ft.
605 Ethan Allen Ave, TAKOMA PARK, MD 20912
MLS# MDMC2214576Listed by: SCOTT GUNN REAL ESTATE GROUP, LLC $1,150,000Pending5 beds 4 baths3,725 sq. ft.
6604 Gude Ave, TAKOMA PARK, MD 20912
MLS# MDMC2213058Listed by: TTR SOTHEBY'S INTERNATIONAL REALTY $184,900Active1 beds 1 baths725 sq. ft.
7611 Maple Ave #511, TAKOMA PARK, MD 20912
MLS# MDMC2213642Listed by: REAL BROKER, LLC $249,990Active2 beds 1 baths938 sq. ft.
111 Lee Ave #412, TAKOMA PARK, MD 20912
MLS# MDMC2213598Listed by: COLDWELL BANKER REALTY $599,900Pending4 beds 2 baths2,150 sq. ft.
1104 Kirklynn Ave, TAKOMA PARK, MD 20912
MLS# MDMC2213386Listed by: LONG & FOSTER REAL ESTATE, INC. $1,099,000Active4 beds 4 baths2,994 sq. ft.
15 Ritchie Ave, SILVER SPRING, MD 20910
MLS# MDMC2213044Listed by: SAMSON PROPERTIES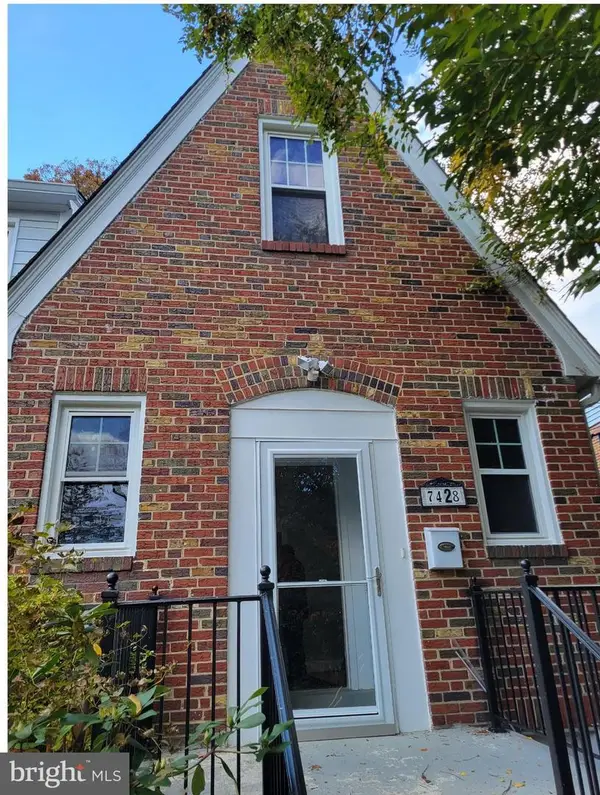 $950,000Active3 beds 4 baths1,380 sq. ft.
7428 Piney Branch Rd, TAKOMA PARK, MD 20912
MLS# MDMC2212556Listed by: MICHAEL BENMIRA VILLACRES $724,999Active5 beds 3 baths2,600 sq. ft.
6914 New Hampshire Ave, TAKOMA PARK, MD 20912
MLS# MDMC2209462Listed by: REALTY PROS $559,900Active5 beds 3 baths1,644 sq. ft.
6813 10th Ave, TAKOMA PARK, MD 20912
MLS# MDPG2184780Listed by: EXP REALTY, LLC $699,000Active5 beds 3 baths1,310 sq. ft.
717 Ludlow St, TAKOMA PARK, MD 20912
MLS# MDMC2209400Listed by: COMPASS $145,000Active1 beds 1 baths606 sq. ft.
116 Lee Ave #108, TAKOMA PARK, MD 20912
MLS# MDMC2209392Listed by: FATHOM REALTY MD, LLC $550,000Active3 beds 2 baths1,216 sq. ft.
8103 Kennewick Ave, TAKOMA PARK, MD 20912
MLS# MDMC2208194Listed by: PEARSON SMITH REALTY, LLC $1,195,000Pending3 beds 3 baths1,525 sq. ft.
7013 Sycamore Ave, TAKOMA PARK, MD 20912
MLS# MDMC2205256Listed by: PERENNIAL REAL ESTATE $545,000Pending5 beds -- baths2,237 sq. ft.
7916 Long Branch Pkwy, TAKOMA PARK, MD 20912
MLS# MDMC2206794Listed by: RE/MAX REALTY SERVICES $775,000Active4 beds 4 baths2,834 sq. ft.
7918 Long Branch Pkwy, TAKOMA PARK, MD 20912
MLS# MDMC2208088Listed by: RE/MAX REALTY SERVICES $590,000Active3 beds 2 baths1,344 sq. ft.
7107 13th Ave, TAKOMA PARK, MD 20912
MLS# MDMC2206856Listed by: COMPASS $685,000Pending3 beds 3 baths1,266 sq. ft.
410 Mississippi Ave, SILVER SPRING, MD 20910
MLS# MDMC2205512Listed by: LONG & FOSTER REAL ESTATE, INC. $829,180Active4 beds 2 baths1,880 sq. ft.
720 Kennebec Ave, TAKOMA PARK, MD 20912
MLS# MDMC2205704Listed by: COLDWELL BANKER REALTY $729,900Active5 beds 3 baths1,958 sq. ft.
7605 Wildwood Dr, TAKOMA PARK, MD 20912
MLS# MDMC2205230Listed by: APEX REALTY- Open Sun, 11am to 2pm
 $214,900Active2 beds 1 baths774 sq. ft.
7738 Maple Ave #6, TAKOMA PARK, MD 20912
MLS# MDMC2204964Listed by: FAIRFAX REALTY SELECT  $849,999Active5 beds 4 baths2,333 sq. ft.
8203 Greenwood Ave, TAKOMA PARK, MD 20912
MLS# MDMC2204396Listed by: STEWART REAL ESTATE, LLC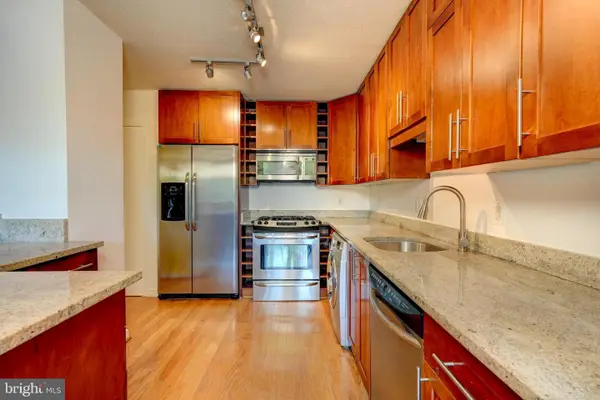 $249,000Active2 beds 2 baths1,200 sq. ft.
7333 New Hampshire Ave #510 S, TAKOMA PARK, MD 20912
MLS# MDMC2204616Listed by: KELLER WILLIAMS CAPITAL PROPERTIES $549,000Active2 beds 2 baths1,188 sq. ft.
652 Kennebec Ave #2, TAKOMA PARK, MD 20912
MLS# MDMC2181456Listed by: PERENNIAL REAL ESTATE $299,000Pending3 beds 3 baths1,350 sq. ft.
24 Seek Ct, TAKOMA PARK, MD 20912
MLS# MDMC2201026Listed by: SMART REALTY, LLC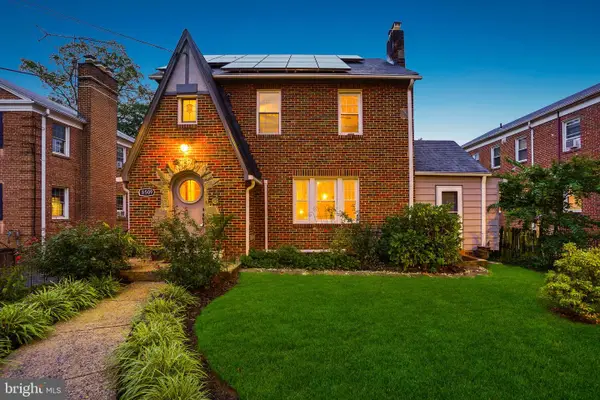 $995,000Active5 beds 4 baths2,403 sq. ft.
8509 Flower Ave, TAKOMA PARK, MD 20912
MLS# MDMC2200150Listed by: PERENNIAL REAL ESTATE $1,695,000Active5 beds 4 baths
110 Geneva, SILVER SPRING, MD 20912
MLS# MDMC2205456Listed by: PERENNIAL REAL ESTATE $975,000Active5 beds -- baths2,712 sq. ft.
8511 Flower Ave, TAKOMA PARK, MD 20912
MLS# MDMC2198906Listed by: PERENNIAL REAL ESTATE $570,000Active3 beds 3 baths1,364 sq. ft.
7606 15th Ave, TAKOMA PARK, MD 20912
MLS# MDPG2164876Listed by: SAMSON PROPERTIES $159,900Active2 beds 1 baths
116 Lee Ave #105, TAKOMA PARK, MD 20912
MLS# MDMC2195306Listed by: SAMSON PROPERTIES- New
 $1,799,000Active5 beds 4 baths4,900 sq. ft.
811 Sligo Creek Pkwy, TAKOMA PARK, MD 20912
MLS# MDMC2217860Listed by: REDFIN CORP  $140,000Active2 beds 1 baths944 sq. ft.
116 Lee Ave #303, TAKOMA PARK, MD 20912
MLS# MDMC2212172Listed by: SAMSON PROPERTIES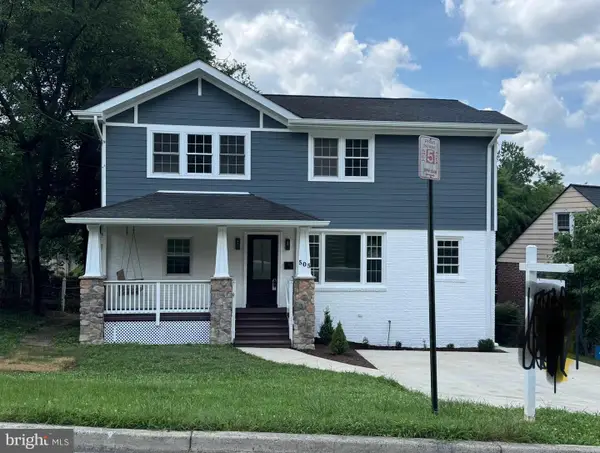 $850,000Active4 beds 4 baths1,727 sq. ft.
505 Belford Pl, TAKOMA PARK, MD 20912
MLS# MDMC2186458Listed by: SAMSON PROPERTIES $150,000Active1 beds 1 baths704 sq. ft.
116 Lee Ave #112, TAKOMA PARK, MD 20912
MLS# MDMC2209596Listed by: SAMSON PROPERTIES $11,500,000Active2.82 Acres
117 Elm Ave, TAKOMA PARK, MD 20912
MLS# MDMC2181326Listed by: SERHANT $850,000Active5 beds 4 baths3,611 sq. ft.
8107 Chester St, TAKOMA PARK, MD 20912
MLS# MDMC2180194Listed by: EXP REALTY, LLC $525,000Pending0.14 Acres
6503 Kansas Ln, TAKOMA PARK, MD 20912
MLS# MDMC2158856Listed by: KBM REALTORS, LLC $425,000Pending0.15 Acres
6505 Kansas Ln, TAKOMA PARK, MD 20912
MLS# MDMC2158858Listed by: KBM REALTORS, LLC
Local realty services provided by:CENTURY 21 Home Team Realty
Neighborhoods near Takoma Park, MD
Zip codes near Takoma Park, MD
- 20008 homes for sale
- 20010 homes for sale
- 20011 homes for sale
- 20012 homes for sale
- 20015 homes for sale
- 20017 homes for sale
- 20018 homes for sale
- 20306 homes for sale
- 20712 homes for sale
- 20722 homes for sale
- 20740 homes for sale
- 20781 homes for sale
- 20782 homes for sale
- 20783 homes for sale
- 20815 homes for sale
- 20901 homes for sale
- 20902 homes for sale
- 20903 homes for sale
- 20910 homes for sale
- 20912 homes for sale
Popular searches near Takoma Park, MD
- 16, Hyattsville homes for sale
- 17, Chillum homes for sale
- Adelphi homes for sale
- Brentwood homes for sale
- Burnt Mills homes for sale
- Chevy Chase homes for sale
- Chevy Chase Village homes for sale
- Chillum homes for sale
- College Park homes for sale
- Forest Glen homes for sale
- Four Corners homes for sale
- Hillandale homes for sale
- Hyattsville homes for sale
- Kemp Mill homes for sale
- Langley Park homes for sale
- Mt Rainier homes for sale
- Riverdale Park homes for sale
- Silver Spring homes for sale
- University Park homes for sale
- White Oak homes for sale
Protect your home and budget from life's surprises with an Assurant Home Warranty, backed by a partner that supports you through every step of homeownership. Explore Plans.
©2026 Century 21 Real Estate LLC. All rights reserved. CENTURY 21®, the CENTURY 21 Logo and C21® are service marks owned by Century 21 Real Estate LLC. Century 21 Real Estate LLC fully supports the principles of the Fair Housing Act and the Equal Opportunity Act. Each office is independently owned and operated. Listing information is deemed reliable but not guaranteed accurate.