- Arlington Heights, Tampa homes for sale
- Buffalo Heights, Tampa homes for sale
- Grove Park Estates, Tampa homes for sale
- Hampton Terrace, Tampa homes for sale
- Idlewild on Hillsborough, Tampa homes for sale
- Lowry Park, Tampa homes for sale
- North Park, Tampa homes for sale
- Old Seminole Heights, Tampa homes for sale
- Plaza Terrace, Tampa homes for sale
- Riverbend, Tampa homes for sale
- Riverside Heights, Tampa homes for sale
- Riverside North, Tampa homes for sale
- South Seminole Heights, Tampa homes for sale
- Southeast Seminole Heights, Tampa homes for sale
- Stadium Area, Tampa homes for sale
- Tampa Heights, Tampa homes for sale
- The Marina Club of Tampa, Tampa homes for sale
- Wellswood, Tampa homes for sale
- West Riverside Heights, Tampa homes for sale
- Ybor Heights, Tampa homes for sale
Tampa, FL - homes for sale
300 of 2,675 results displayed
- New
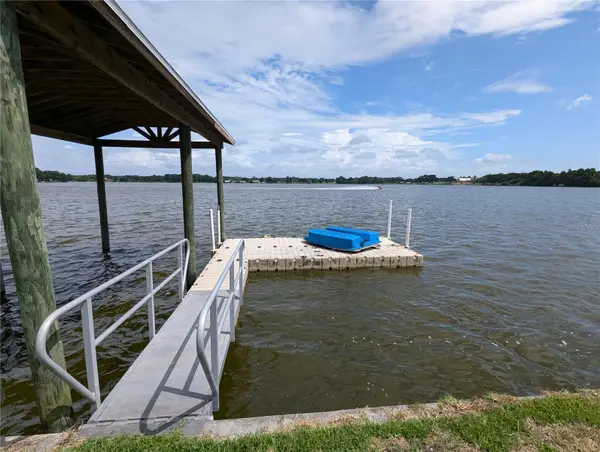
 $849,900Active6 beds 5 baths3,500 sq. ft.
10262 Memorial Highway, TAMPA, FL 33615
MLS# TB8484255Listed by: NEXTHOME BY THE BAY - New
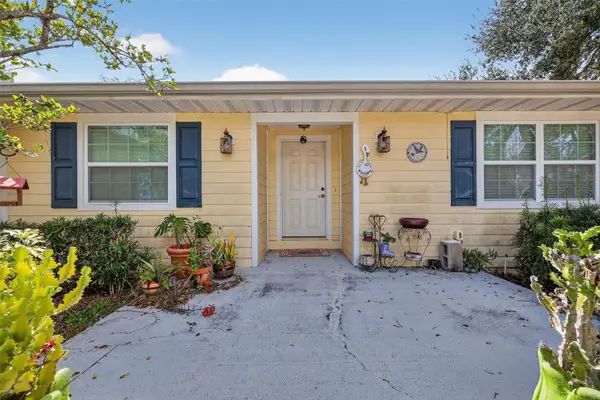
 $455,000Active3 beds 2 baths1,536 sq. ft.
8714 Imperial Court, TAMPA, FL 33635
MLS# O6388858Listed by: UNITED REALTY GROUP INC - New
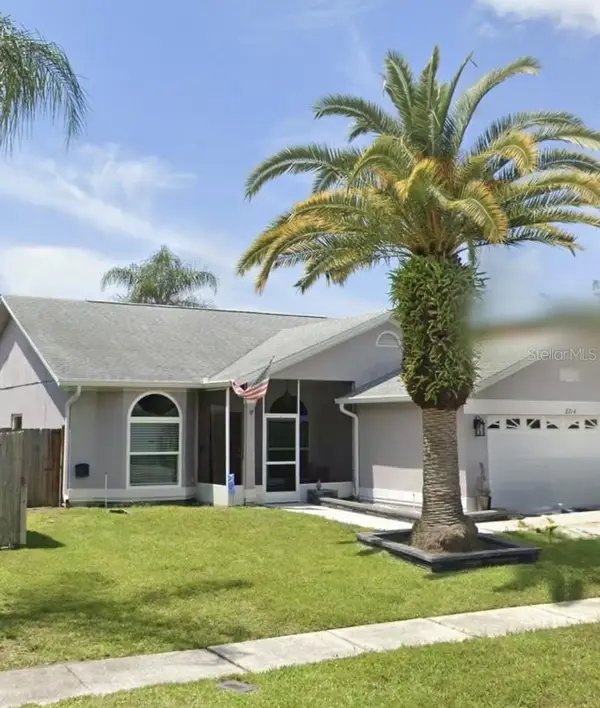
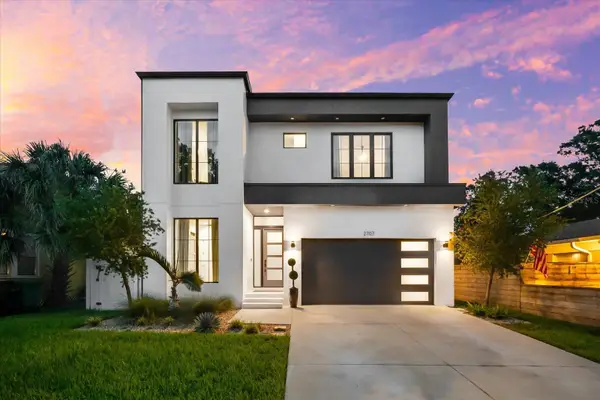
 $560,000Active5 beds 3 baths2,184 sq. ft.
2814 W Powhatan Avenue, TAMPA, FL 33614
MLS# TB8484350Listed by: CENTURY 21 ROSA LEON - New
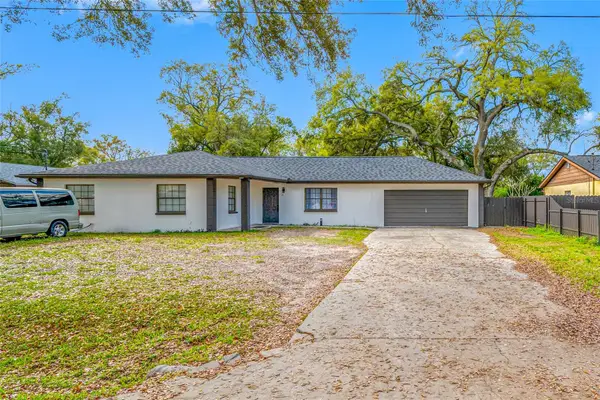
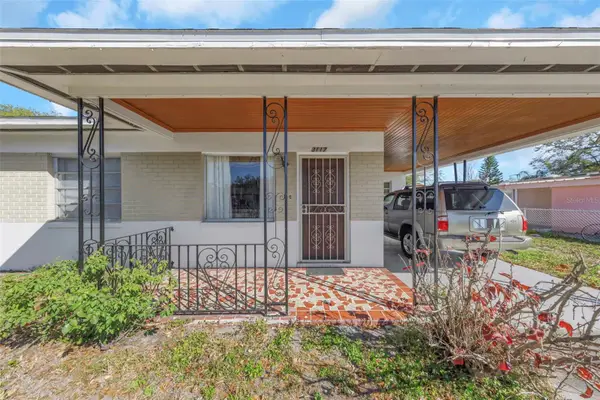
 $439,999Active4 beds 2 baths2,080 sq. ft.
314 E 137th Avenue, TAMPA, FL 33613
MLS# TB8474559Listed by: REAL BROKER, LLC - New
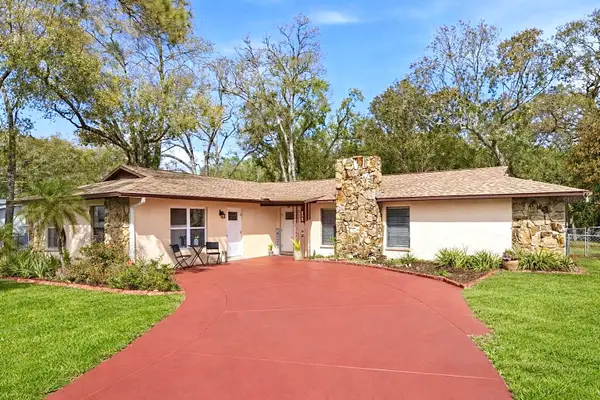
 $550,000Active7 beds 6 baths2,411 sq. ft.
2706 W Powhatan Avenue, TAMPA, FL 33614
MLS# TB8483863Listed by: JPT REALTY LLC - New
 $550,000Active4 beds 4 baths2,888 sq. ft.
18048 Java Isle Drive, TAMPA, FL 33647
MLS# A4684711Listed by: SHOWTIME REALTY - New
 $419,900Active3 beds 3 baths1,614 sq. ft.
11817 Branch Mooring Drive, TAMPA, FL 33635
MLS# TB8484209Listed by: REAL ESTATE FIRM OF FLORIDA, LLC - New
 $189,000Active2 beds 1 baths1,248 sq. ft.
2310 W Walnut Street, TAMPA, FL 33607
MLS# TB8478951Listed by: EXP REALTY LLC - New
 $369,900Active4 beds 2 baths1,805 sq. ft.
10310 Goldenbrook Way, TAMPA, FL 33647
MLS# TB8483728Listed by: REALTY ONE GROUP EPIC  $335,000Pending3 beds 2 baths2,092 sq. ft.
3820 Cypress Meadows Road, TAMPA, FL 33624
MLS# TB8484062Listed by: VITA LUXURY REALTY LLC- New
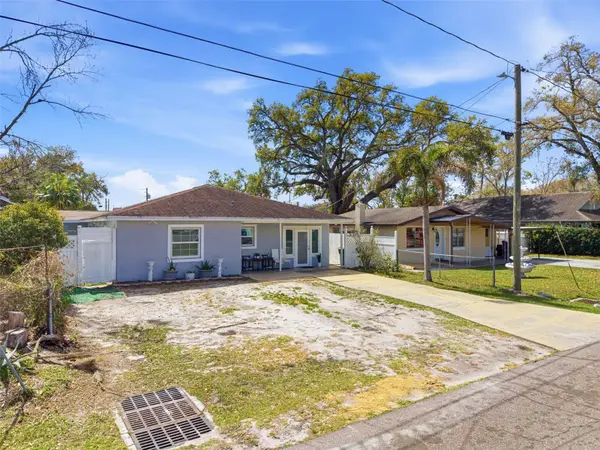
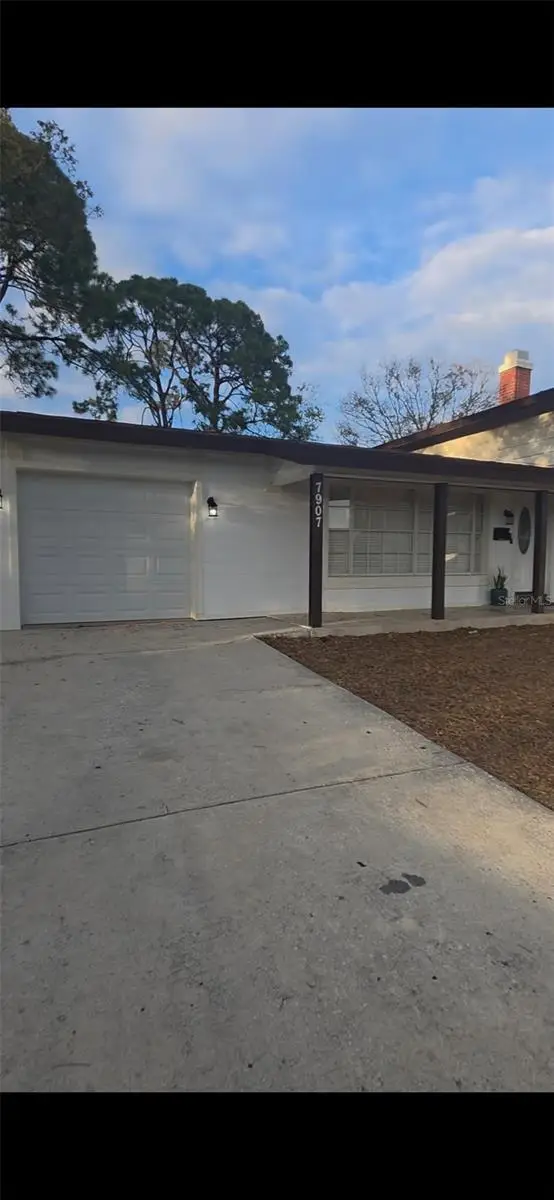 $617,000Active4 beds 3 baths1,690 sq. ft.
7907 W Hiawatha Street, TAMPA, FL 33615
MLS# TB8483616Listed by: SELLING USA, LLC - New
 $500,000Active3 beds 2 baths2,067 sq. ft.
17746 Nathans Drive, TAMPA, FL 33647
MLS# TB8483544Listed by: BRG REAL ESTATE INC - New
 $985,000Active3 beds 3 baths2,266 sq. ft.
43 Aegean Avenue, TAMPA, FL 33606
MLS# TB8484152Listed by: KNOWN REAL ESTATE LLC - New
 $389,999Active2 beds 1 baths1,084 sq. ft.
816 W Idlewild Avenue, TAMPA, FL 33604
MLS# TB8483654Listed by: FRANK ALBERT REALTY - New
 $995,000Active3 beds 2 baths2,318 sq. ft.
4508 Henderson Boulevard, TAMPA, FL 33629
MLS# TB8484034Listed by: RE/MAX ALLIANCE GROUP - New
 $318,900Active4 beds 2 baths1,384 sq. ft.
3602 Tamarix Drive, TAMPA, FL 33619
MLS# TB8484106Listed by: POWERS REAL ESTATE SOLUTIONS LLC - New
 $445,000Active2 beds 2 baths1,281 sq. ft.
2512 W Texas Avenue #C, TAMPA, FL 33629
MLS# TB8484108Listed by: NORMAN ALEXANDER INVESTMENT - New
 $419,900Active4 beds 2 baths1,328 sq. ft.
3907 W Rogers Avenue, TAMPA, FL 33611
MLS# TB8483490Listed by: FLAT FEE MLS REALTY - New
 $1,075,000Active4 beds 3 baths2,680 sq. ft.
2407 W Carmen Street, TAMPA, FL 33609
MLS# TB8483631Listed by: COMPASS FLORIDA LLC - New
 $480,000Active4 beds 3 baths2,523 sq. ft.
10005 Katie Court, TAMPA, FL 33647
MLS# TB8479062Listed by: KEY PREMIER REALTY - New
 $434,500Active3 beds 2 baths1,182 sq. ft.
2909 W Dewey Street, TAMPA, FL 33607
MLS# TB8481048Listed by: VANDERLEELIE & ASSOC.RE ESTATE - New
 $300,000Active2 beds 2 baths994 sq. ft.
3934 Shoreside Circle, TAMPA, FL 33624
MLS# TB8483593Listed by: CHARLES RUTENBERG REALTY INC - New
 $1,750,000Active5 beds 4 baths3,784 sq. ft.
3608 E Tampa Circle, TAMPA, FL 33629
MLS# TB8483702Listed by: IMPACT REALTY TAMPA BAY - New
 $345,000Active4 beds 3 baths1,372 sq. ft.
4732 Eldorado Drive, TAMPA, FL 33615
MLS# TB8483754Listed by: LA ROSA REALTY, LLC - New
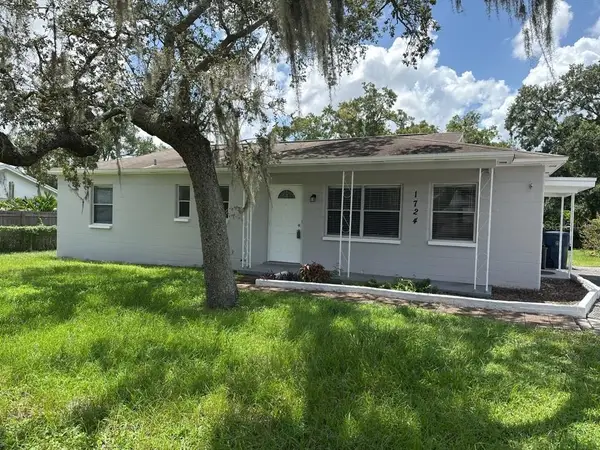 $384,500Active4 beds 2 baths1,128 sq. ft.
1724 W Eldred Drive, TAMPA, FL 33603
MLS# TB8484030Listed by: ADVANTAGE REALTY SERVICES, INC - Open Sun, 11am to 1pmNew
 $630,000Active3 beds 3 baths1,934 sq. ft.
14503 Thornfield Court, TAMPA, FL 33624
MLS# TB8481949Listed by: TOMLIN, ST CYR & ASSOCIATES LLC - New
 $580,000Active3 beds 2 baths2,070 sq. ft.
12111 Steppingstone Boulevard, TAMPA, FL 33635
MLS# TB8484010Listed by: 1 STEP AHEAD REALTY GROUP LLC - New
 $680,000Active4 beds 3 baths2,426 sq. ft.
7709 S Wall Street, TAMPA, FL 33616
MLS# TB8483232Listed by: KELLER WILLIAMS SOUTH TAMPA - New
 $314,900Active2 beds 1 baths768 sq. ft.
7804 N Church Avenue, TAMPA, FL 33614
MLS# TB8483891Listed by: KELLER WILLIAMS TAMPA PROP. - New
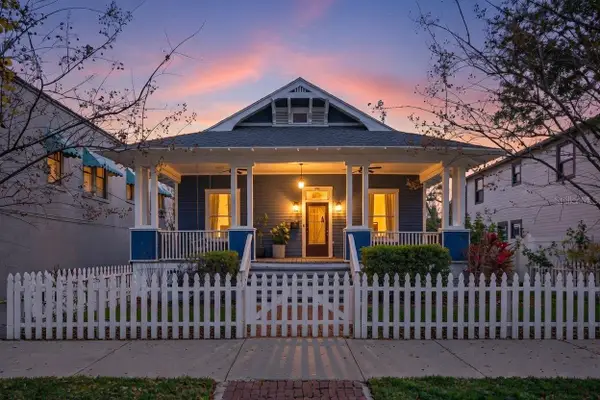
 $645,000Active3 beds 3 baths2,888 sq. ft.
205 E Park Avenue, TAMPA, FL 33602
MLS# TB8484004Listed by: SCHLEICHER SELECT PROPERTIES - New
 $498,000Active3 beds 2 baths1,677 sq. ft.
11903 Steppingstone Boulevard, TAMPA, FL 33635
MLS# TB8471883Listed by: FUTURE HOME REALTY INC - New
 $625,000Active3 beds 3 baths2,235 sq. ft.
7304 Ardenwood, TAMPA, FL 33625
MLS# L4959991Listed by: KELLER WILLIAMS REALTY SMART - New
 $230,000Active2 beds 1 baths963 sq. ft.
4607 E Yukon Street, TAMPA, FL 33617
MLS# O6388485Listed by: MARK SPAIN REAL ESTATE - Open Wed, 11am to 1pmNew
 $2,450,000Active3 beds 3 baths3,610 sq. ft.
4115 W Zelar Street, TAMPA, FL 33629
MLS# TB8448389Listed by: SMITH & ASSOCIATES REAL ESTATE - New
 $350,000Active3 beds 2 baths1,078 sq. ft.
2604 E 18th Avenue, TAMPA, FL 33605
MLS# TB8479594Listed by: SMITH & ASSOCIATES REAL ESTATE - New
 $285,000Active3 beds 2 baths1,461 sq. ft.
2402 Corrine Street, TAMPA, FL 33605
MLS# TB8482431Listed by: RE/MAX PREMIER GROUP - New
 $305,000Active2 beds 2 baths987 sq. ft.
3244 Fox Lake Drive, TAMPA, FL 33618
MLS# TB8482573Listed by: REALTY ONE GROUP SUNSHINE - New
 $610,000Active2 beds 1 baths1,209 sq. ft.
3612 W Platt Street, TAMPA, FL 33609
MLS# TB8482812Listed by: PINEYWOODS REALTY LLC - New
 $1,805,000Active4 beds 4 baths4,140 sq. ft.
5210 S Crescent Drive, TAMPA, FL 33611
MLS# TB8482927Listed by: SMITH & ASSOCIATES REAL ESTATE - New
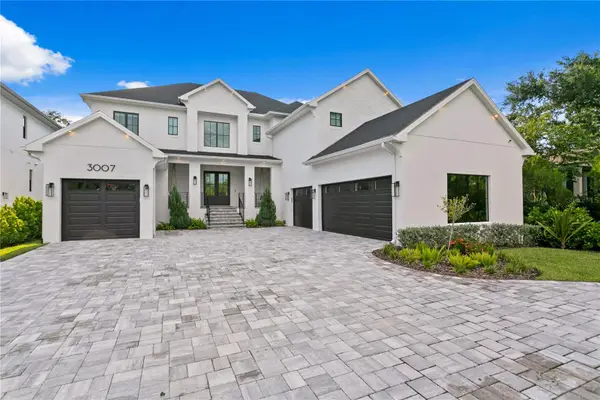 $3,499,000Active5 beds 6 baths5,496 sq. ft.
3007 S West Shore Boulevard, TAMPA, FL 33629
MLS# TB8483361Listed by: COMPASS FLORIDA LLC  $285,000Pending3 beds 2 baths1,570 sq. ft.
9501 Camden Hill Court, TAMPA, FL 33615
MLS# TB8483551Listed by: SMITH & ASSOCIATES REAL ESTATE- New
 $469,900Active4 beds 3 baths2,302 sq. ft.
3330 Foxridge Circle, TAMPA, FL 33618
MLS# TB8483683Listed by: KELLER WILLIAMS TAMPA PROP. - New
 $450,000Active3 beds 2 baths1,450 sq. ft.
6701 Larimer Drive, TAMPA, FL 33615
MLS# TB8483735Listed by: BELL HENDERSON REAL ESTATE - New
 $350,000Active3 beds 2 baths1,787 sq. ft.
7041 Silvermill Drive, TAMPA, FL 33635
MLS# TB8483843Listed by: MARZUCCO REAL ESTATE - New
 $549,900Active3 beds 2 baths1,459 sq. ft.
406 W Flora Street, TAMPA, FL 33604
MLS# TB8483917Listed by: SMITH & ASSOCIATES REAL ESTATE - New
 $5,000Active4 beds 3 baths1,463 sq. ft.
7332 Winchester Drive, Tampa, FL 33615
MLS# 396981Listed by: JAMIE L BOONE LLC - New
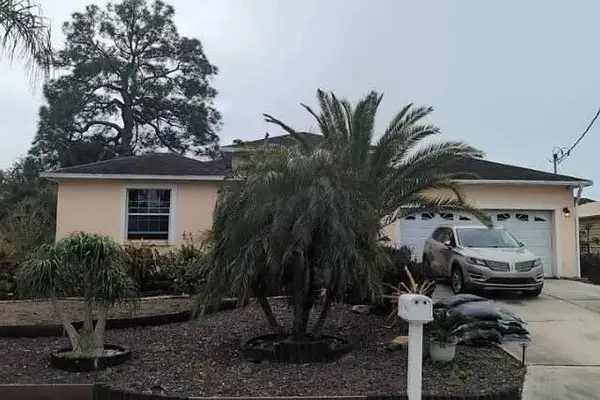
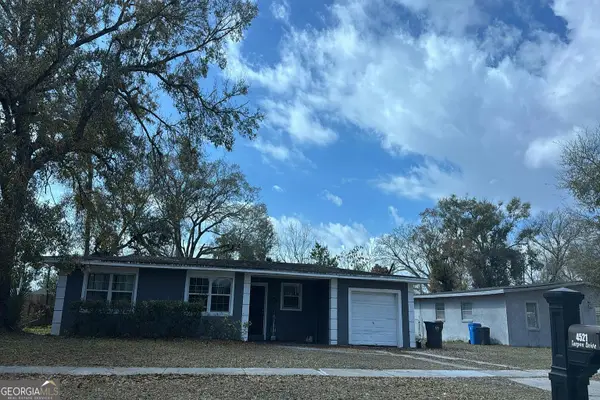 $190,000Active2 beds 1 baths974 sq. ft.
4521 Tarpon Drive, Tampa, FL 33617
MLS# 10705072Listed by: Federa
- New
 $474,999Active3 beds 2 baths1,777 sq. ft.
14403 Brentwood Drive, TAMPA, FL 33618
MLS# TB8483320Listed by: HOMAN REALTY GROUP INC - New
 $300,000Active1 beds 1 baths1,064 sq. ft.
4103 W Pearl Avenue, TAMPA, FL 33611
MLS# W7883434Listed by: RE/MAX MARKETING SPECIALISTS - New
 $615,000Active3 beds 2 baths1,727 sq. ft.
231 W Jean Street, TAMPA, FL 33604
MLS# TB8482723Listed by: FUTURE HOME REALTY INC  $499,900Active4 beds 3 baths2,767 sq. ft.
16161 Colchester Palms Drive, TAMPA, FL 33647
MLS# O6367128Listed by: MAINSTAY BROKERAGE LLC- New
 $375,000Active2 beds 1 baths1,272 sq. ft.
4408 W Wisconsin Avenue, TAMPA, FL 33616
MLS# TB8463495Listed by: COASTAL PROPERTIES GROUP INTERNATIONAL - New
 $389,000Active3 beds 2 baths1,512 sq. ft.
10922 Tailfeather Court, TAMPA, FL 33625
MLS# TB8472961Listed by: PINEYWOODS REALTY LLC  $529,900Pending3 beds 2 baths1,354 sq. ft.
4110 W Mango Avenue, TAMPA, FL 33616
MLS# TB8482343Listed by: QUICKSILVER REAL ESTATE GROUP- Open Sat, 10am to 1pmNew
 $439,000Active3 beds 2 baths1,197 sq. ft.
8014 N Lynn Avenue, TAMPA, FL 33604
MLS# TB8482776Listed by: LPT REALTY, LLC - New
 $650,000Active3 beds 3 baths2,675 sq. ft.
2804 Linthicum Place, TAMPA, FL 33618
MLS# TB8483134Listed by: KELLER WILLIAMS TAMPA PROP. - New
 $739,000Active4 beds 3 baths2,242 sq. ft.
6024 S 6th Street, TAMPA, FL 33611
MLS# TB8483556Listed by: LPT REALTY, LLC - New
 $1,450,000Active4 beds 3 baths3,107 sq. ft.
2807 W Sitios Street, TAMPA, FL 33629
MLS# TB8483573Listed by: SMITH & ASSOCIATES REAL ESTATE - New
 $749,000Active4 beds 5 baths2,559 sq. ft.
115 W Hiawatha Street #1/2, TAMPA, FL 33604
MLS# TB8483678Listed by: MADISON HEIGHTS REALTY GROUP - New
 $750,000Active5 beds 3 baths2,373 sq. ft.
7608 Palmbrook Drive, TAMPA, FL 33615
MLS# TB8483650Listed by: VITA LUXURY REALTY LLC - New
 $273,500Active3 beds 1 baths648 sq. ft.
2102 E Caracas Street, TAMPA, FL 33610
MLS# TB8483136Listed by: REALNET FLORIDA REAL ESTATE - New
 $615,000Active4 beds 4 baths3,258 sq. ft.
8815 W Norfolk Street, TAMPA, FL 33615
MLS# TB8483036Listed by: LOMBARDO TEAM REAL ESTATE LLC - New
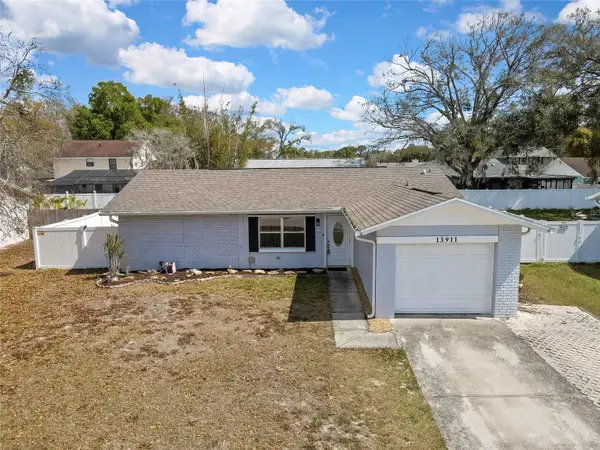 $399,000Active3 beds 2 baths1,572 sq. ft.
13911 Pathfinder Drive, TAMPA, FL 33625
MLS# W7883634Listed by: CHARLES RUTENBERG REALTY INC - New
 $440,000Active3 beds 2 baths1,588 sq. ft.
4912 E Serena Drive, TAMPA, FL 33617
MLS# TB8483582Listed by: GRAYSTONE REAL ESTATE - New
 $374,900Active3 beds 2 baths1,102 sq. ft.
4210 River Hills Drive, TAMPA, FL 33617
MLS# TB8483600Listed by: ENTERPRISE REALTY SERVICES LLC  $460,000Pending4 beds 3 baths1,225 sq. ft.
5407 Rosemont Avenue, TAMPA, FL 33614
MLS# TB8483624Listed by: DALTON WADE INC- New
 $415,000Active3 beds 3 baths1,503 sq. ft.
3510 S 75th Street, TAMPA, FL 33619
MLS# O6388293Listed by: LISTING PROS REALTY LLC - New
 $849,000Active3 beds 4 baths2,468 sq. ft.
201 S Sherrill Street, TAMPA, FL 33609
MLS# TB8479166Listed by: COASTAL PROPERTIES GROUP INTER - New
 $795,000Active4 beds 4 baths2,745 sq. ft.
3311 Leila Avenue W, TAMPA, FL 33611
MLS# TB8479344Listed by: REAL BROKER, LLC - New
 $350,000Active3 beds 2 baths1,518 sq. ft.
14301 Lofton Way, TAMPA, FL 33625
MLS# TB8483574Listed by: COMPASS FLORIDA LLC - New
 $415,000Active4 beds 2 baths1,525 sq. ft.
10202 N Boulevard, TAMPA, FL 33612
MLS# TB8481206Listed by: SENW - New
 $465,000Active4 beds 2 baths1,656 sq. ft.
16119 Copperfield Drive, TAMPA, FL 33618
MLS# TB8483143Listed by: PEOPLE'S CHOICE REALTY SVC LLC - New
 $610,000Active3 beds 2 baths1,690 sq. ft.
12504 Twin Branch Acres Road, TAMPA, FL 33626
MLS# TB8483420Listed by: RE/MAX PREMIER GROUP - New
 $575,000Active4 beds 3 baths1,854 sq. ft.
905 E Hanna Avenue, TAMPA, FL 33604
MLS# TB8483426Listed by: FRANK ALBERT REALTY - New
 $521,900Active3 beds 2 baths1,144 sq. ft.
4211 W Bay View Avenue, TAMPA, FL 33611
MLS# TB8483547Listed by: OUT FAST REALTY & INVESTMENTS - New
 $1,620,000Active5 beds 5 baths3,646 sq. ft.
3610 E Clark Circle, TAMPA, FL 33629
MLS# TB8481658Listed by: TAMPA BAY KEY REALTY - New
 $649,900Active3 beds 2 baths1,565 sq. ft.
201 W Thomas Street, TAMPA, FL 33604
MLS# TB8482805Listed by: PREMIER SOTHEBYS INTL REALTY - New
 $1,200,000Active6 beds 4 baths2,713 sq. ft.
236 W North Street, TAMPA, FL 33604
MLS# TB8483186Listed by: SELLSTATE COASTAL REALTY - New
 $680,000Active4 beds 3 baths2,966 sq. ft.
2201 S Village Avenue, TAMPA, FL 33612
MLS# TB8480381Listed by: COLDWELL BANKER REALTY - New
 $400,000Active4 beds 3 baths1,375 sq. ft.
2318 Carroll Place, TAMPA, FL 33612
MLS# TB8482564Listed by: MARK SPAIN REAL ESTATE - New
 $475,000Active4 beds 2 baths1,302 sq. ft.
6511 Sawyer Court, TAMPA, FL 33634
MLS# TB8483080Listed by: MARK SPAIN REAL ESTATE - New
 $535,000Active4 beds 4 baths2,668 sq. ft.
10884 Cory Lake Drive, TAMPA, FL 33647
MLS# TB8483482Listed by: SEFAIR INVESTMENTS INC - New
 $399,000Active3 beds 2 baths1,539 sq. ft.
8607 N Taliaferro Avenue, TAMPA, FL 33604
MLS# TB8483525Listed by: CENTURY 21 LIST WITH BEGGINS - Open Sat, 11am to 1pmNew
 $1,499,000Active5 beds 3 baths2,903 sq. ft.
344 W Rio Vista Court, TAMPA, FL 33604
MLS# TB8477785Listed by: POST REALTY II INC - New
 $549,900Active2 beds 2 baths1,200 sq. ft.
4514 W Fig Street, TAMPA, FL 33609
MLS# TB8482709Listed by: BAY REALTY OF FLORIDA  $1,650,000Pending4 beds 4 baths3,801 sq. ft.
807 W West Street, TAMPA, FL 33602
MLS# TB8483194Listed by: KELLER WILLIAMS TAMPA CENTRAL- New
 $199,900Active3 beds 2 baths1,268 sq. ft.
10405 N 22nd Street, TAMPA, FL 33612
MLS# TB8483491Listed by: TAMPA BAY PREMIER REALTY - New
 $224,000Active2 beds 1 baths798 sq. ft.
8209 N 18th Street, TAMPA, FL 33604
MLS# TB8482850Listed by: FLORIDA REALTY - New
 $519,000Active5 beds 3 baths3,542 sq. ft.
20509 Carolina Cherry Court, TAMPA, FL 33647
MLS# TB8481103Listed by: KIRSCHNER REALTY SERVICES  $425,000Pending4 beds 2 baths1,816 sq. ft.
11328 N Oakleaf Avenue, TAMPA, FL 33612
MLS# TB8477162Listed by: PINEYWOODS REALTY LLC- New
 $575,000Active4 beds 3 baths2,302 sq. ft.
17705 Esprit Drive, TAMPA, FL 33647
MLS# TB8482824Listed by: ABALARIS - New
 $799,000Active3 beds 2 baths1,740 sq. ft.
3906 W Vasconia Street, TAMPA, FL 33629
MLS# TB8483098Listed by: BELL HENDERSON REAL ESTATE - New
 $2,100,000Active5 beds 6 baths4,149 sq. ft.
807 W Park Avenue, TAMPA, FL 33602
MLS# TB8483397Listed by: MADISON HEIGHTS REALTY GROUP - New
 $1,000,000Active4 beds 4 baths2,554 sq. ft.
3104 W Fielder Street, TAMPA, FL 33611
MLS# TB8480089Listed by: KELLER WILLIAMS ST PETE REALTY - New
 $789,000Active3 beds 2 baths2,309 sq. ft.
10413 Applecross Lane, TAMPA, FL 33626
MLS# TB8482826Listed by: PREMIER SOTHEBYS INTL REALTY - New
 $485,000Active3 beds 1 baths1,540 sq. ft.
3312 Nakora Drive, TAMPA, FL 33618
MLS# TB8482948Listed by: COLDWELL BANKER REALTY - New
 $729,900Active4 beds 4 baths2,848 sq. ft.
7204 S Saint Patrick Street, TAMPA, FL 33616
MLS# TB8483345Listed by: SELECT PROPERTIES INC - New
 $665,000Active3 beds 1 baths1,210 sq. ft.
3616 W Azeele Street, TAMPA, FL 33609
MLS# TB8483169Listed by: KNOWN REAL ESTATE LLC - New
 $665,000Active2 beds 1 baths1,230 sq. ft.
3620 W Azeele Street, TAMPA, FL 33609
MLS# TB8483171Listed by: KNOWN REAL ESTATE LLC - New
 $374,900Active3 beds 2 baths1,084 sq. ft.
9010 W Hamilton Avenue, TAMPA, FL 33615
MLS# TB8483297Listed by: FIRST HOUSING REALTY GROUP - New
 $595,000Active4 beds 3 baths2,084 sq. ft.
14114 Bardsdale Lane, TAMPA, FL 33625
MLS# W7883574Listed by: 1% LISTS CENTRAL FLORIDA - New
 $800,000Active3 beds 2 baths1,392 sq. ft.
2306 S Lois Avenue, TAMPA, FL 33629
MLS# TB8481115Listed by: SMITH & ASSOCIATES REAL ESTATE - New
 $395,000Active4 beds 2 baths1,935 sq. ft.
3613 Romano Busciglio Street, TAMPA, FL 33619
MLS# TB8483221Listed by: EXP REALTY LLC  $1,300,000Pending5 beds 4 baths4,169 sq. ft.
12116 San Chaliford Court, TAMPA, FL 33626
MLS# TB8483239Listed by: SMITH & ASSOCIATES REAL ESTATE- New
 $360,000Active3 beds 2 baths1,215 sq. ft.
4419 W Iowa Avenue, TAMPA, FL 33616
MLS# TB8483261Listed by: RE/MAX COLLECTIVE - New
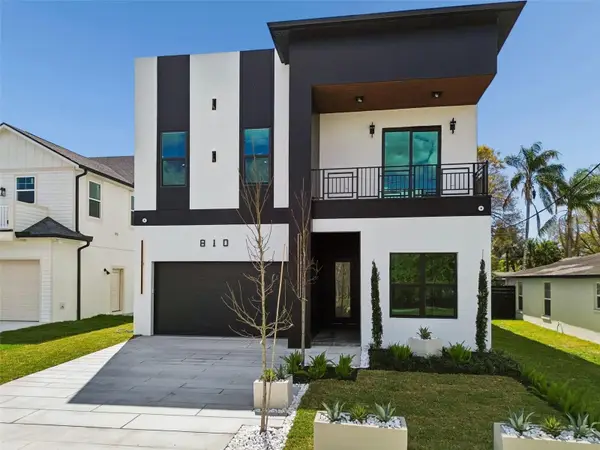 $1,800,000Active4 beds 4 baths3,513 sq. ft.
810 W Braddock Street, TAMPA, FL 33603
MLS# TB8431083Listed by: COMPASS FLORIDA LLC - New
 $1,295,000Active4 beds 2 baths2,847 sq. ft.
4830 Longwater Way, TAMPA, FL 33615
MLS# TB8479322Listed by: COLDWELL BANKER REALTY - New
 $350,000Active2 beds 1 baths832 sq. ft.
110 W Cayuga Street, TAMPA, FL 33603
MLS# TB8483199Listed by: REAL BROKER, LLC - New
 $530,000Active4 beds 3 baths2,631 sq. ft.
20153 Oakflower Avenue, TAMPA, FL 33647
MLS# TB8474016Listed by: KELLER WILLIAMS TAMPA PROP. - New
 $3,249,000Active5 beds 6 baths5,293 sq. ft.
4304 W Jetton Avenue, TAMPA, FL 33629
MLS# TB8479741Listed by: COLDWELL BANKER REALTY - New
 $3,950,000Active6 beds 6 baths6,290 sq. ft.
534 Ladrone Avenue, TAMPA, FL 33606
MLS# TB8482117Listed by: FADAL & CO - New
 $615,000Active4 beds 3 baths1,812 sq. ft.
7810 N Cameron Avenue, TAMPA, FL 33614
MLS# TB8482942Listed by: KELLER WILLIAMS TAMPA PROP. - New
 $2,500,000Active5 beds 6 baths6,500 sq. ft.
604 & 602 Channel Dr, TAMPA, FL 33606
MLS# TB8483000Listed by: SHORE2BAY REALTY - New
 $475,000Active2 beds 1 baths676 sq. ft.
402 S Oregon Avenue, TAMPA, FL 33606
MLS# TB8482683Listed by: LOMBARDO TEAM REAL ESTATE LLC - New
 $309,900Active3 beds 3 baths1,470 sq. ft.
3511 S 76th Street, TAMPA, FL 33619
MLS# TB8483070Listed by: LOMBARDO TEAM REAL ESTATE LLC - New
 $530,000Active4 beds 3 baths2,888 sq. ft.
15246 Anguilla Isle Avenue, TAMPA, FL 33647
MLS# TB8476630Listed by: DALTON WADE INC - New
 $695,000Active5 beds 3 baths2,695 sq. ft.
8785 Ashworth Drive, TAMPA, FL 33647
MLS# TB8481180Listed by: COLDWELL BANKER REALTY - New
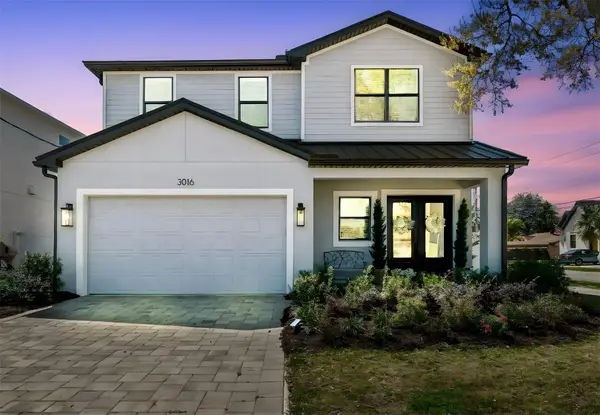 $1,375,000Active4 beds 4 baths3,194 sq. ft.
3016 W Ballast Point Boulevard, TAMPA, FL 33611
MLS# TB8482965Listed by: PALERMO REAL ESTATE PROF. INC. - New
 $1,100,000Active6 beds 7 baths3,012 sq. ft.
3901 W Platt Street, TAMPA, FL 33609
MLS# TB8479931Listed by: LPT REALTY, LLC 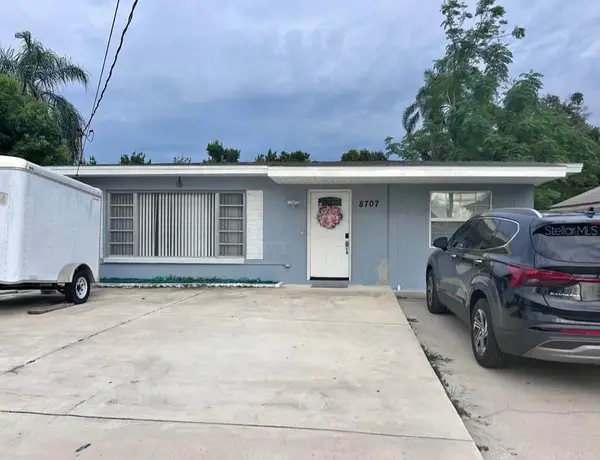 $430,000Pending4 beds 3 baths1,304 sq. ft.
8707 El Portal Drive, TAMPA, FL 33604
MLS# TB8483123Listed by: HOME PRIME REALTY LLC- New
 $524,000Active3 beds 2 baths1,518 sq. ft.
6317 N 22nd Street, TAMPA, FL 33610
MLS# TB8483050Listed by: PINEYWOODS REALTY LLC  $304,000Pending3 beds 1 baths1,246 sq. ft.
7712 E Comanche Avenue, TAMPA, FL 33610
MLS# TB8482437Listed by: FRANK ALBERT REALTY $1,100,000Pending3 beds 2 baths2,600 sq. ft.
3408 W Palmira Avenue, TAMPA, FL 33629
MLS# TB8481806Listed by: KELLER WILLIAMS SOUTH TAMPA- New
 $400,000Active6 beds 2 baths2,048 sq. ft.
7407 S 33rd Avenue S, TAMPA, FL 33619
MLS# TB8482151Listed by: TAMPA INVESTORS SOLUTIONS LLC - New
 $649,900Active3 beds 2 baths1,533 sq. ft.
6415 Windwood Court, TAMPA, FL 33634
MLS# TB8482371Listed by: FRIENDS REALTY LLC - New
 $359,980Active4 beds 2 baths1,196 sq. ft.
3704 Meadowbreeze Drive, TAMPA, FL 33619
MLS# TB8483084Listed by: REAL BROKER, LLC  $815,000Pending3 beds 4 baths2,840 sq. ft.
20170 Umbria Hill Drive, TAMPA, FL 33647
MLS# TB8466212Listed by: FLORIDA EXECUTIVE REALTY $1,850,000Pending5 beds 4 baths4,106 sq. ft.
4615 W Sunset Boulevard, TAMPA, FL 33629
MLS# TB8482816Listed by: KELLER WILLIAMS TAMPA CENTRAL- New
 $350,000Active3 beds 2 baths1,774 sq. ft.
3806 W Wallace Avenue, TAMPA, FL 33611
MLS# TB8482797Listed by: LOTUS REAL ESTATE LLC - New
 $376,000Active3 beds 1 baths910 sq. ft.
4114 W Cass Street, TAMPA, FL 33609
MLS# TB8482986Listed by: RE/MAX ALLIANCE GROUP - New
 $517,000Active3 beds 2 baths1,836 sq. ft.
10212 Newport Circle, TAMPA, FL 33612
MLS# TB8481786Listed by: COLDWELL BANKER REALTY - Open Wed, 12 to 2pmNew
 $359,000Active3 beds 2 baths1,032 sq. ft.
4718 W Oklahoma Avenue, TAMPA, FL 33616
MLS# TB8482972Listed by: CENTURY 21 LIST WITH BEGGINS - New
 $369,000Active3 beds 3 baths1,660 sq. ft.
10301 Chadbourne Drive, TAMPA, FL 33624
MLS# O6387599Listed by: SET HOMES REALTY LLC - New
 $304,900Active3 beds 1 baths1,212 sq. ft.
3005 Cord Street, TAMPA, FL 33605
MLS# TB8481697Listed by: TMWRK BROKERAGE LLC - New
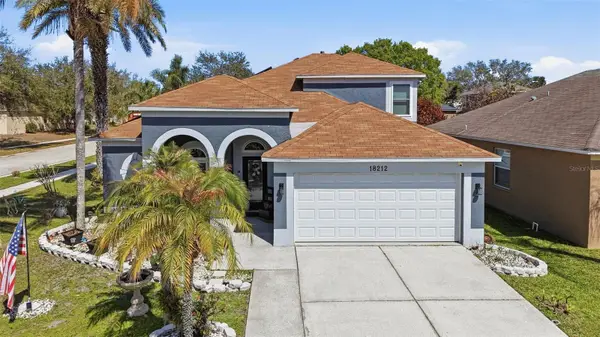 $429,999Active5 beds 3 baths2,350 sq. ft.
18212 Brookpark Drive, TAMPA, FL 33647
MLS# TB8482784Listed by: MIHARA & ASSOCIATES INC.  $499,000Pending4 beds 3 baths2,012 sq. ft.
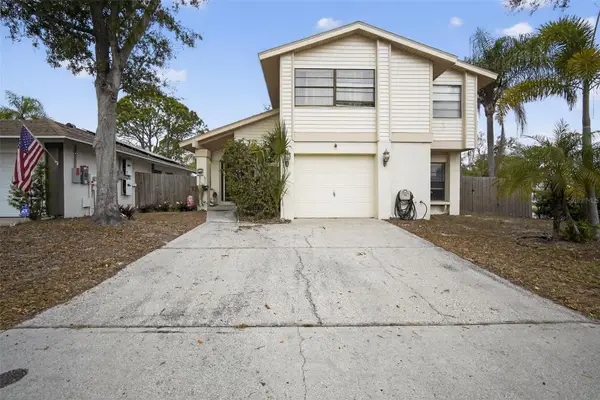
8205 Tanglewood Lane, TAMPA, FL 33615
MLS# TB8481636Listed by: HOME PRIME REALTY LLC- New
 $549,000Active3 beds 2 baths1,432 sq. ft.
615 N Woodlynne Avenue, TAMPA, FL 33609
MLS# TB8482297Listed by: SMITH & ASSOCIATES REAL ESTATE - New
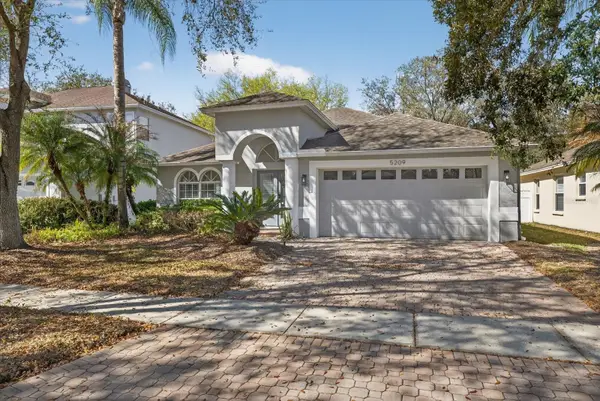 $550,000Active3 beds 2 baths2,074 sq. ft.
5209 Abbey Park Avenue, TAMPA, FL 33647
MLS# W7883567Listed by: INVESTMENT FLORIDA REALTY LLC - New
 $699,000Active2 beds 2 baths1,770 sq. ft.
306 E Ross Avenue, TAMPA, FL 33602
MLS# TB8480531Listed by: KELLER WILLIAMS ST PETE REALTY - New
 $425,000Active3 beds 2 baths1,120 sq. ft.
3909 N Tampa Street, TAMPA, FL 33603
MLS# TB8480825Listed by: REALNET FLORIDA REAL ESTATE - New
 $1,595,000Active4 beds 4 baths3,768 sq. ft.
4620 W Bay Villa Avenue, TAMPA, FL 33611
MLS# TB8480141Listed by: INSTA REAL ESTATE SOLUTIONS - New
 $300,000Active3 beds 1 baths1,248 sq. ft.
7006 Tidewater Trail, TAMPA, FL 33619
MLS# TB8481739Listed by: SUNCOAST REALTY SOLUTIONS, LLC - New
 $634,900Active4 beds 3 baths2,342 sq. ft.
8011 Red Orchard Court, TAMPA, FL 33635
MLS# TB8481993Listed by: COASTAL PROPERTIES GROUP INTER - Open Sat, 11am to 1pmNew
 $850,000Active3 beds 2 baths1,684 sq. ft.
2909 W San Isidro Street, TAMPA, FL 33629
MLS# TB8482211Listed by: PREMIER SOTHEBY'S INTL REALTY - New
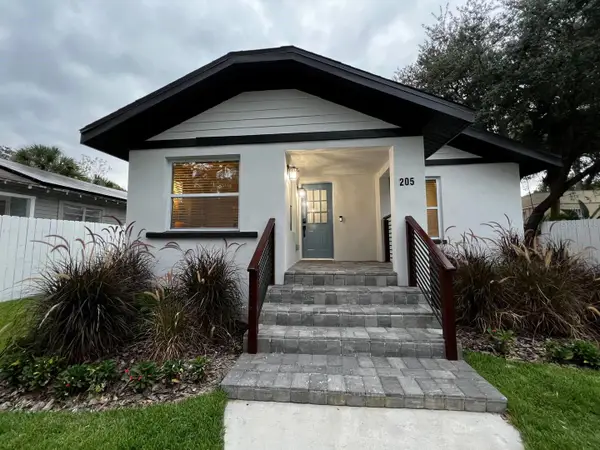 $379,900Active2 beds 1 baths960 sq. ft.
205 W Emily Street, TAMPA, FL 33603
MLS# TB8482570Listed by: KELLER WILLIAMS TAMPA CENTRAL - New
 $708,027Active3 beds 3 baths2,068 sq. ft.
3507 W San Luis Street, TAMPA, FL 33629
MLS# TB8482641Listed by: VYLLA HOME - New
 $360,000Active3 beds 2 baths1,472 sq. ft.
12520 Mondragon Drive, TAMPA, FL 33625
MLS# TB8482677Listed by: MARKELL & ASSOCIATES REALTORS - New
 $925,000Active4 beds 5 baths2,803 sq. ft.
1021 E Hamilton Avenue, TAMPA, FL 33604
MLS# TB8481711Listed by: REALTY HUB - New
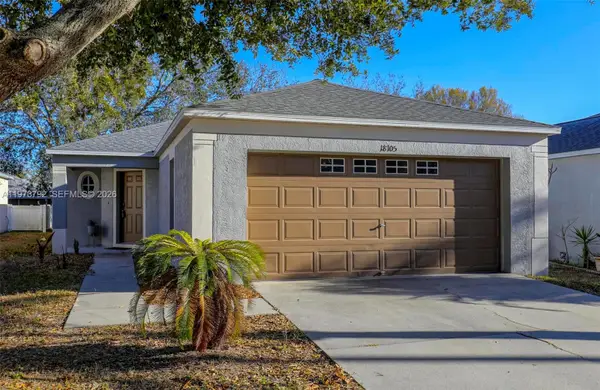 $369,000Active3 beds 2 baths1,296 sq. ft.
18105 Lembrecht Way, Tampa, FL 33647
MLS# A11973792Listed by: LAND'S END PROPERTY GROUP LLC - New
 $370,000Active4 beds 2 baths1,350 sq. ft.
4305 E Henry Avenue, TAMPA, FL 33610
MLS# TB8481692Listed by: PEREZ HOME REALTY LLC  $2,250,000Pending5 beds 5 baths4,508 sq. ft.
2601 W Morrison Avenue, TAMPA, FL 33629
MLS# TB8482415Listed by: SMITH & ASSOCIATES REAL ESTATE- New
 $525,000Active3 beds 2 baths1,132 sq. ft.
6005 Interbay Boulevard, TAMPA, FL 33611
MLS# TB8482336Listed by: PREMIER SOTHEBYS INTL REALTY  $339,900Pending3 beds 2 baths1,360 sq. ft.
2905 E 18th Avenue, TAMPA, FL 33605
MLS# TB8479906Listed by: FINE PROPERTIES- New
 $649,900Active2 beds 2 baths1,820 sq. ft.
4108 N Lynn Avenue, TAMPA, FL 33603
MLS# TB8482142Listed by: PARTNER AGENT REALTY INC - New
 $400,000Active4 beds 2 baths1,695 sq. ft.
303 E Hollywood St, TAMPA, FL 33604
MLS# TB8481378Listed by: HOME PRIME REALTY LLC - New
 $350,000Active2 beds 1 baths1,103 sq. ft.
7003 N 13th Street, TAMPA, FL 33604
MLS# TB8481236Listed by: COLDWELL BANKER REALTY - New
 $550,000Active2 beds 1 baths1,092 sq. ft.
1607 N 19th Street, TAMPA, FL 33605
MLS# TB8482500Listed by: RE/MAX MARKETING SPECIALISTS - New
 $5,000Active3 beds 3 baths2,028 sq. ft.
10243 Villa Palazzo Court, Tampa, FL 33615
MLS# 323780Listed by: JAMIE L BOONE LLC - New
 $340,000Active3 beds 2 baths1,197 sq. ft.
4709 Glenaire Court, TAMPA, FL 33624
MLS# TB8482265Listed by: COMPASS FLORIDA LLC - New
 $1,395,000Active4 beds 5 baths3,081 sq. ft.
920 W Alfred Street, TAMPA, FL 33603
MLS# TB8478177Listed by: SPIEGEL LUXURY GROUP - New
 $280,000Active3 beds 2 baths1,128 sq. ft.
2402 Cassell Street, TAMPA, FL 33605
MLS# TB8482398Listed by: FUTURE HOME REALTY - New
 $599,000Active2 beds 2 baths1,724 sq. ft.
29800 Anand Vihar Drive, WESLEY CHAPEL, FL 33543
MLS# TB8482025Listed by: PREMIER REALTY OF TAMPA - New
 $437,999Active2 beds 2 baths1,222 sq. ft.
5503 N 9th Street, TAMPA, FL 33604
MLS# TB8482259Listed by: AGILE GROUP REALTY - New
 $600,000Active2 beds 2 baths1,572 sq. ft.
2812 N Munro Street, TAMPA, FL 33602
MLS# TB8482201Listed by: LOMBARDO TEAM REAL ESTATE LLC - New
 $640,000Active4 beds 4 baths2,832 sq. ft.
18010 Java Isle Drive, TAMPA, FL 33647
MLS# O6387251Listed by: OPENDOOR BROKERAGE LLC - New
 $770,000Active4 beds 3 baths2,433 sq. ft.
213 W Giddens Avenue, TAMPA, FL 33603
MLS# TB8481824Listed by: PINEYWOODS REALTY LLC - New
 $320,000Active3 beds 2 baths1,236 sq. ft.
1013 East Chelsea Street, TAMPA, FL 33603
MLS# OM719928Listed by: DIAMOND D REALTY - New
 $625,000Active4 beds 3 baths2,537 sq. ft.
9305 Wellington Park Circle, TAMPA, FL 33647
MLS# TB8479743Listed by: KELLER WILLIAMS RLTY NEW TAMPA  $450,000Pending3 beds 2 baths1,676 sq. ft.
12322 Rome Avenue, TAMPA, FL 33612
MLS# TB8480576Listed by: SMITH & ASSOCIATES REAL ESTATE $679,000Pending4 beds 4 baths2,582 sq. ft.
4323 Honey Vista Circle, TAMPA, FL 33624
MLS# TB8480761Listed by: TAMPA BAY ELITE HOMES, LLC- New
 $519,900Active3 beds 2 baths2,057 sq. ft.
10104 N Dartmouth Avenue, TAMPA, FL 33612
MLS# TB8481926Listed by: LPT REALTY, LLC. - New
 $319,900Active3 beds 2 baths1,600 sq. ft.
5718 S Coolidge Avenue, TAMPA, FL 33616
MLS# TB8482220Listed by: SHOREBIRD PROPERTIES - New
 $480,000Active5 beds 3 baths2,415 sq. ft.
4211 Romano Busciglio Street, TAMPA, FL 33619
MLS# TB8479595Listed by: RE/MAX BAYSIDE REALTY LLC - New
 $1,599,000Active4 beds 4 baths3,051 sq. ft.
3214 W San Miguel Street, TAMPA, FL 33629
MLS# TB8479628Listed by: MOBLEY REALTY, INC. - New
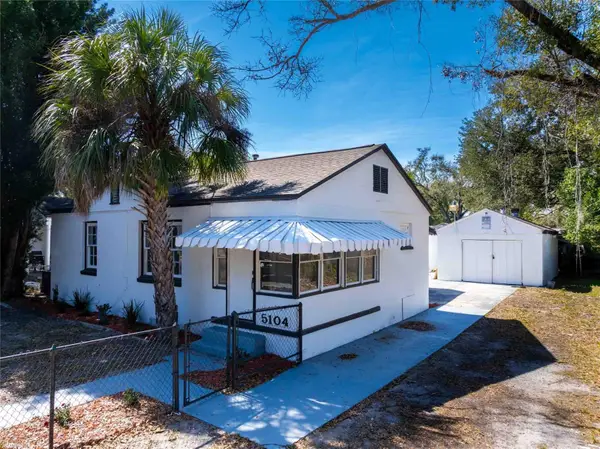 $299,000Active3 beds 2 baths1,200 sq. ft.
5104 N 15th Street, TAMPA, FL 33610
MLS# C7522595Listed by: COZZA INVESTMENT GROUP - New
 $849,900Active4 beds 3 baths2,930 sq. ft.
2919 Bayshore Vista Drive, TAMPA, FL 33611
MLS# TB8482003Listed by: CHARLES RUTENBERG REALTY INC  $1,690,000Pending5 beds 4 baths4,158 sq. ft.
4109 Preserve Forest Drive, TAMPA, FL 33618
MLS# TB8479148Listed by: KELLER WILLIAMS SOUTH TAMPA- New
 $2,599,000Active5 beds 6 baths3,891 sq. ft.
209 S Hubert Avenue, TAMPA, FL 33609
MLS# TB8481656Listed by: KELLER WILLIAMS TAMPA CENTRAL - New
 $479,900Active3 beds 2 baths2,016 sq. ft.
18810 Forest Glen Court, TAMPA, FL 33647
MLS# TB8481756Listed by: SYNERGISTIC PROPERTY MANAGEMENT - New
 $320,000Active3 beds 2 baths1,284 sq. ft.
6702 Village Grove Court, TAMPA, FL 33615
MLS# TB8476588Listed by: EXCLUSIVE HOMES REALTY, INC. - New
 $439,000Active3 beds 2 baths1,308 sq. ft.
8706 Osage Drive, TAMPA, FL 33634
MLS# TB8482029Listed by: DALTON WADE INC  $410,000Pending3 beds 2 baths1,658 sq. ft.
15501 Conway Place, TAMPA, FL 33624
MLS# TB8481778Listed by: KELLER WILLIAMS TAMPA PROP.- New
 $418,000Active3 beds 2 baths1,500 sq. ft.
2014 E Wood Street, TAMPA, FL 33604
MLS# TB8481977Listed by: PINEYWOODS REALTY LLC  $298,000Pending3 beds 2 baths1,240 sq. ft.
3808 E Osborne Avenue, TAMPA, FL 33610
MLS# TB8478907Listed by: JPT REALTY LLC- New
 $995,000Active3 beds 1 baths1,808 sq. ft.
7208 N 12th Street, TAMPA, FL 33604
MLS# TB8481902Listed by: COMPASS FLORIDA LLC - New
 $450,000Active3 beds 2 baths1,586 sq. ft.
4519 S Trask Street, TAMPA, FL 33611
MLS# TB8481464Listed by: MIHARA & ASSOCIATES INC. - New
 $675,000Active3 beds 3 baths2,283 sq. ft.
10618 Hatteras Drive, TAMPA, FL 33615
MLS# TB8481613Listed by: MARK SPAIN REAL ESTATE - New
 $899,000Active6 beds 4 baths3,028 sq. ft.
8020 Interbay Boulevard, TAMPA, FL 33616
MLS# TB8481829Listed by: CHARLES RUTENBERG REALTY INC - New
 $239,000Active2 beds 2 baths832 sq. ft.
10009 N Florence Avenue, TAMPA, FL 33612
MLS# G5108645Listed by: COLDWELL BANKER REALTY - New
 $559,000Active4 beds 3 baths2,805 sq. ft.
7809 Tuscany Woods Drive, TAMPA, FL 33647
MLS# TB8479630Listed by: RE/MAX ACTION FIRST OF FLORIDA - New
 $325,000Active2 beds 2 baths1,232 sq. ft.
4801 Ridge Point Drive, TAMPA, FL 33624
MLS# TB8480442Listed by: REALTY ONE GROUP SUNSHINE - New
 $789,900Active6 beds 5 baths3,333 sq. ft.
4518 W Idlewild Avenue, TAMPA, FL 33614
MLS# TB8481053Listed by: AVENUE HOMES LLC - New
 $499,900Active3 beds 2 baths1,374 sq. ft.
7402 S Germer Street, TAMPA, FL 33616
MLS# TB8481110Listed by: COMPASS FLORIDA LLC - New
 $1,599,000Active4 beds 3 baths2,913 sq. ft.
4157 Saltwater Boulevard, TAMPA, FL 33615
MLS# TB8481312Listed by: PRIME REALTY OF FL LLC  $650,000Pending3 beds 2 baths1,502 sq. ft.
3517 W Cherokee Avenue, TAMPA, FL 33611
MLS# TB8481534Listed by: KELLER WILLIAMS TAMPA CENTRAL- New
 $100,000Active4 beds 4 baths3,193 sq. ft.
311 Jeanal Place, Tampa, FL 33612
MLS# 10700974Listed by: Federa - New
 $309,000Active4 beds 2 baths1,102 sq. ft.
4928 S 82nd Street, TAMPA, FL 33619
MLS# TB8475652Listed by: EXP REALTY LLC - Open Sat, 2 to 5pmNew
 $469,900Active3 beds 2 baths1,271 sq. ft.
12809 Dunhill Drive, TAMPA, FL 33624
MLS# TB8481424Listed by: PEOPLE'S CHOICE REALTY SVC LLC - New
 $364,999Active3 beds 3 baths1,535 sq. ft.
2916 E 15th Avenue #2, TAMPA, FL 33605
MLS# TB8481661Listed by: HOME PRIME REALTY LLC  $739,900Pending4 beds 3 baths2,500 sq. ft.
11230 Bloomington Drive, TAMPA, FL 33635
MLS# TB8481583Listed by: TAYLORMADE PROPERTIES, INC.- New
 $364,999Active3 beds 3 baths1,535 sq. ft.
2916 E 15th Avenue #1, TAMPA, FL 33605
MLS# TB8481652Listed by: HOME PRIME REALTY LLC - New
 $489,000Active3 beds 3 baths1,676 sq. ft.
2809 N 21st Street, TAMPA, FL 33605
MLS# TB8479996Listed by: REAL BROKER, LLC - New
 $1,425,000Active4 beds 4 baths3,289 sq. ft.
2704 W Tyson Avenue, TAMPA, FL 33611
MLS# TB8480861Listed by: THE TONI EVERETT COMPANY - New
 $149,000Active2 beds 1 baths1,100 sq. ft.
8107 N 12th Street, TAMPA, FL 33604
MLS# TB8481641Listed by: QUICKSILVER REAL ESTATE GROUP  $489,000Pending3 beds 2 baths1,399 sq. ft.
2116 W Sewaha Street, TAMPA, FL 33612
MLS# TB8481591Listed by: LPT REALTY, LLC- New
 $615,000Active3 beds 2 baths1,648 sq. ft.
13528 Avista Drive, TAMPA, FL 33624
MLS# TB8481518Listed by: KELLER WILLIAMS TAMPA PROP.  $975,000Pending3 beds 2 baths1,615 sq. ft.
4215 W Palmira Avenue, TAMPA, FL 33629
MLS# TB8474053Listed by: COMPASS FLORIDA LLC- Open Sat, 12 to 3pmNew
 $445,000Active4 beds 2 baths1,606 sq. ft.
8713 Imperial Court, TAMPA, FL 33635
MLS# TB8481581Listed by: CENTURY 21 ROSA LEON - New
 $402,500Active3 beds 2 baths1,488 sq. ft.
7156 Hamilton Park Boulevard, TAMPA, FL 33615
MLS# TB8481565Listed by: GAVIN REALTY INC. - New
 $336,000Active3 beds 3 baths1,680 sq. ft.
10235 Villa Palazzo Court, TAMPA, FL 33615
MLS# TB8481501Listed by: REALTY PROPERTY GROUP LLC - New
 $989,900Active3 beds 3 baths2,160 sq. ft.
1305 Hilton Place, TAMPA, FL 33604
MLS# TB8476383Listed by: REALTY BLU - New
 $549,900Active4 beds 2 baths2,119 sq. ft.
20265 Merry Oak Avenue, TAMPA, FL 33647
MLS# TB8480626Listed by: ENTERPRISE REALTY SERVICES LLC - New
 $380,000Active3 beds 1 baths1,083 sq. ft.
4004 N Munro Street, TAMPA, FL 33603
MLS# S5144778Listed by: CAISSA REALTY INVESTMENT INC - New
 $449,000Active3 beds 2 baths1,403 sq. ft.
1305 E Osborne Avenue, TAMPA, FL 33603
MLS# TB8481457Listed by: MIHARA & ASSOCIATES INC. - New
 $579,900Active4 beds 3 baths1,954 sq. ft.
3112 W Henry Avenue, TAMPA, FL 33614
MLS# TB8481469Listed by: FIRST HOUSING REALTY GROUP - New
 $479,000Active3 beds 2 baths2,124 sq. ft.
6517 Walton Way, TAMPA, FL 33610
MLS# TB8480787Listed by: ANGEL REALTY LLC 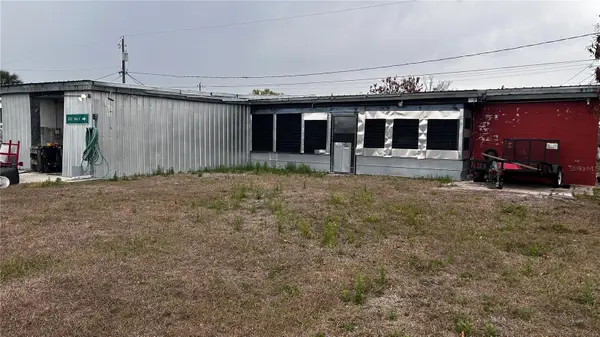 $180,000Pending3 beds 2 baths1,128 sq. ft.
1503 Lancelot Loop, TAMPA, FL 33619
MLS# TB8481006Listed by: MILITARY FIRST REAL ESTATE LLC- New
 $1,850,000Active5 beds 5 baths3,313 sq. ft.
2707 Ridgewood Avenue, TAMPA, FL 33602
MLS# TB8480176Listed by: EXP REALTY LLC - New
 $389,000Active3 beds 2 baths1,387 sq. ft.
3117 W Leroy Street, TAMPA, FL 33607
MLS# TB8479923Listed by: REAL BROKER, LLC  $599,000Pending3 beds 3 baths1,728 sq. ft.
1506 E Knollwood Street, TAMPA, FL 33610
MLS# TB8480466Listed by: RE/MAX COLLECTIVE- New
 $279,900Active2 beds 2 baths957 sq. ft.
1102 E Humphrey Street, TAMPA, FL 33604
MLS# TB8480555Listed by: KASH REALTY - New
 $499,900Active3 beds 2 baths1,810 sq. ft.
4438 Summer Oak Drive, TAMPA, FL 33618
MLS# TB8480617Listed by: COLDWELL BANKER REALTY - New
 $340,000Active3 beds 2 baths1,200 sq. ft.
2114 E Juneau Street, TAMPA, FL 33604
MLS# TB8481269Listed by: ARC REALTY GROUP - New
 $460,000Active5 beds 3 baths1,186 sq. ft.
6005 W Clifton Street, TAMPA, FL 33634
MLS# TB8480999Listed by: JPT REALTY LLC - New
 $495,000Active3 beds 2 baths2,145 sq. ft.
7812 Garrison Street, TAMPA, FL 33617
MLS# TB8481307Listed by: FENIX HOME REALTY LLC - New
 $379,900Active3 beds 2 baths1,436 sq. ft.
3301 N 12th Street, TAMPA, FL 33605
MLS# TB8481102Listed by: COMPASS FLORIDA LLC - New
 $394,500Active3 beds 2 baths1,129 sq. ft.
4412 W Anita Boulevard, TAMPA, FL 33611
MLS# TB8481226Listed by: CARTER COMPANY REALTORS - New
 $590,000Active3 beds 2 baths2,771 sq. ft.
2535 Lake Ellen Drive, TAMPA, FL 33618
MLS# TB8480296Listed by: THE TONI EVERETT COMPANY - New
 $1,150,000Active6 beds 5 baths4,138 sq. ft.
12508 Twin Branch Acres Road, TAMPA, FL 33626
MLS# TB8480361Listed by: COLDWELL BANKER REALTY - New
 $2,499,999Active5 beds 6 baths4,596 sq. ft.
3614 S Belcher Drive, TAMPA, FL 33629
MLS# TB8481039Listed by: MCBRIDE KELLY & ASSOCIATES - New
 $549,900Active5 beds 3 baths3,382 sq. ft.
9609 Royal Fern Court, TAMPA, FL 33647
MLS# TB8473313Listed by: KELLER WILLIAMS RLTY NEW TAMPA - New
 $530,000Active4 beds 2 baths1,941 sq. ft.
13405 Fawn Springs Drive, TAMPA, FL 33626
MLS# O6386382Listed by: BEYCOME OF FLORIDA LLC - New
 $550,000Active4 beds 3 baths2,234 sq. ft.
2526 W Cordelia Street, TAMPA, FL 33607
MLS# TB8480120Listed by: CAPSTAR REAL ESTATE LLC - New
 $320,000Active4 beds 2 baths1,730 sq. ft.
3504 E 24th Avenue, TAMPA, FL 33605
MLS# TB8481076Listed by: SCOTT & FAULK INTERVEST REALTY - New
 $789,000Active4 beds 4 baths2,544 sq. ft.
1709 E Henry Avenue, TAMPA, FL 33610
MLS# TB8481181Listed by: PINEYWOODS REALTY LLC 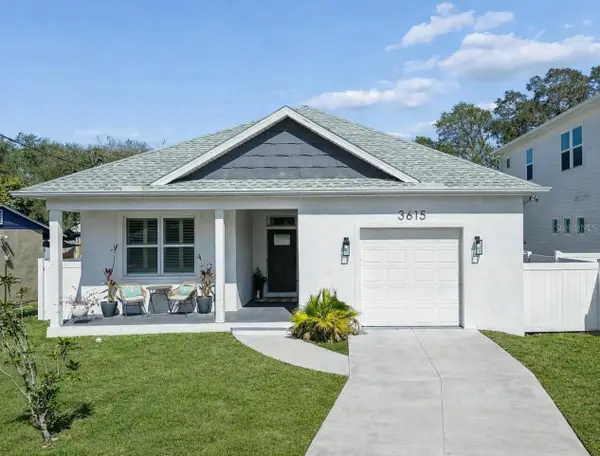 $675,000Pending4 beds 3 baths2,280 sq. ft.
3615 Ohio Avenue, TAMPA, FL 33611
MLS# TB8463631Listed by: TOMLIN, ST CYR & ASSOCIATES LLC- New
 $385,000Active4 beds 2 baths1,200 sq. ft.
3711 N 12th Street, TAMPA, FL 33603
MLS# W7883154Listed by: FLORIDAS A TEAM REALTY - New
 $750,000Active5 beds 3 baths3,316 sq. ft.
19914 Bluff Oak Boulevard, TAMPA, FL 33647
MLS# TB8480539Listed by: SIGNATURE REALTY ASSOCIATES - New
 $147,500Active2 beds 1 baths925 sq. ft.
1712 E River Cove Street, TAMPA, FL 33604
MLS# TB8481202Listed by: BAY VISION REALTY INC - New
 $375,000Active3 beds 2 baths1,344 sq. ft.
13816 Pathfinder Drive, TAMPA, FL 33625
MLS# TB8480127Listed by: QUICKSILVER REAL ESTATE GROUP  $375,000Pending2 beds 2 baths977 sq. ft.
4708 Cypress Ridge Place, TAMPA, FL 33624
MLS# TB8481163Listed by: LPT REALTY LLC $489,900Pending3 beds 2 baths1,146 sq. ft.
202 W Curtis Street, TAMPA, FL 33603
MLS# TB8477283Listed by: SMITH & ASSOCIATES REAL ESTATE- New
 $479,000Active4 beds 2 baths1,687 sq. ft.
14012 Cascade Lane, TAMPA, FL 33618
MLS# TB8479309Listed by: KELLER WILLIAMS REALTY- PALM H  $999,000Pending4 beds 3 baths2,242 sq. ft.
4012 W Bay To Bay Boulevard, TAMPA, FL 33629
MLS# TB8479448Listed by: COMPASS FLORIDA LLC- New
 $1,475,000Active4 beds 4 baths3,159 sq. ft.
3115 W Hawthorne Road, TAMPA, FL 33611
MLS# TB8480309Listed by: STAR BAY REALTY CORP. - New
 $449,999Active3 beds 2 baths1,368 sq. ft.
6002 Town N Country Boulevard, TAMPA, FL 33615
MLS# TB8480952Listed by: MIRIAM HURTADO REAL ESTATE GROUP - New
 $130,000Active2 beds 1 baths768 sq. ft.
2014 Hemlock Street, TAMPA, FL 33605
MLS# O6385145Listed by: COLDWELL BANKER RESIDENTIAL RE - New
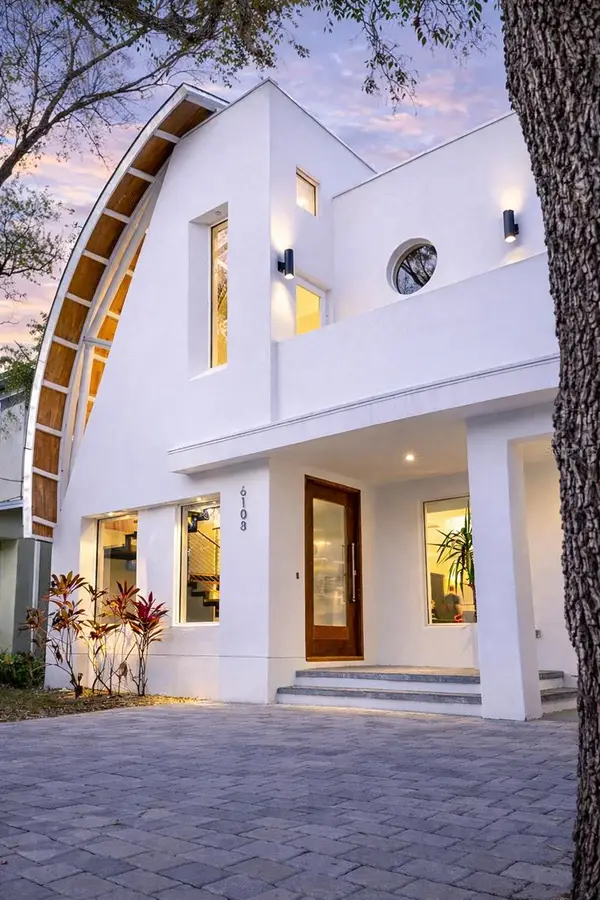 $999,000Active3 beds 3 baths2,372 sq. ft.
6108 S Elkins Avenue, TAMPA, FL 33611
MLS# O6385926Listed by: ORCHARD BROKERAGE, LLC - New
 $2,200,000Active6 beds 5 baths4,241 sq. ft.
4311 W Barcelona Street, TAMPA, FL 33629
MLS# TB8448096Listed by: COMPASS FLORIDA LLC - New
 $444,000Active1 beds 1 baths588 sq. ft.
3400 Waterbridge Drive, TAMPA, FL 33618
MLS# TB8475280Listed by: COMPASS FLORIDA LLC  $579,900Pending3 beds 2 baths1,498 sq. ft.
4304 S Thatcher Avenue, TAMPA, FL 33611
MLS# TB8475353Listed by: COLDWELL BANKER REALTY- New
 $525,000Active3 beds 2 baths1,734 sq. ft.
1607 E Ida Street, TAMPA, FL 33610
MLS# TB8479429Listed by: COMPASS FLORIDA LLC  $419,900Pending3 beds 2 baths1,515 sq. ft.
6509 Sawyer Place, TAMPA, FL 33634
MLS# TB8480892Listed by: DALTON WADE INC- New
 $130,000Active3 beds 2 baths1,125 sq. ft.
10408 Ventura Avenue, Tampa, FL 33619
MLS# 10699542Listed by: Federa - New
 $329,900Active4 beds 2 baths1,476 sq. ft.
7604 35th Avenue S, TAMPA, FL 33619
MLS# TB8480839Listed by: STAR BAY REALTY CORP. - New
 $439,900Active3 beds 2 baths1,500 sq. ft.
13926 Cherry Dale Lane, TAMPA, FL 33618
MLS# TB8480890Listed by: MIHARA & ASSOCIATES INC.  $379,900Pending3 beds 2 baths1,524 sq. ft.
14809 Tulip Drive, TAMPA, FL 33613
MLS# TB8480447Listed by: SOUTHERN LIFE REALTY- New
 $325,000Active2 beds 2 baths1,195 sq. ft.
18509 Putters Place, TAMPA, FL 33647
MLS# TB8480069Listed by: CENTURY 21 CIRCLE - New
 $435,000Active3 beds 2 baths1,400 sq. ft.
12413 Hidden Brook Drive #11, TAMPA, FL 33624
MLS# TB8480645Listed by: VITA LUXURY REALTY LLC - New
 $365,000Active3 beds 2 baths1,576 sq. ft.
20163 Bay Cedar Avenue, TAMPA, FL 33647
MLS# TB8469437Listed by: KELLER WILLIAMS RLTY NEW TAMPA - New
 $459,000Active4 beds 2 baths1,413 sq. ft.
12824 Dunhill Drive, TAMPA, FL 33624
MLS# TB8480462Listed by: COLDWELL BANKER REALTY - New
 $570,000Active3 beds 2 baths1,782 sq. ft.
10730 Drummond Road, TAMPA, FL 33615
MLS# TB8480959Listed by: LPT REALTY, LLC - New
 $714,900Active5 beds 4 baths2,414 sq. ft.
7613 Rustic Dr, TAMPA, FL 33634
MLS# TB8480992Listed by: HOME PRIME REALTY LLC  $749,000Pending3 beds 3 baths1,877 sq. ft.
3305 N Perry Avenue, TAMPA, FL 33603
MLS# TB8481007Listed by: LOMBARDO TEAM REAL ESTATE LLC- New
 $550,000Active4 beds 2 baths2,714 sq. ft.
6807 Dickinson Court, TAMPA, FL 33634
MLS# TB8480711Listed by: ENGEL & VOLKERS TAMPA DOWNTOWN  $587,000Pending4 beds 2 baths2,208 sq. ft.
15830 Glenarn Drive, TAMPA, FL 33618
MLS# TB8478979Listed by: PEOPLE'S CHOICE REALTY SVC LLC- New
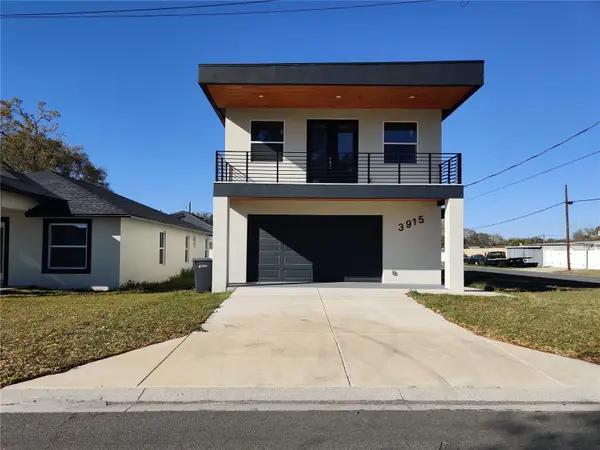 $685,000Active4 beds 3 baths2,276 sq. ft.
3915 W Robson Street W, TAMPA, FL 33614
MLS# TB8480072Listed by: INTERCONTINENTAL REAL EST GRP - New
 $1,599,000Active5 beds 5 baths3,560 sq. ft.
3713 W Leona Street, TAMPA, FL 33629
MLS# TB8476611Listed by: MCBRIDE KELLY & ASSOCIATES - New
 $1,999,900Active5 beds 4 baths2,196 sq. ft.
5104 W San Jose Street, TAMPA, FL 33629
MLS# TB8480215Listed by: GUARDIAN REAL ESTATE SERVICES - New
 $429,000Active4 beds 2 baths1,662 sq. ft.
2341 W Chestnut Street, TAMPA, FL 33607
MLS# TB8479880Listed by: TAMPA BAY REALTY & INVESTMENT GROUP  $579,900Pending4 beds 3 baths2,626 sq. ft.
16154 Monterey Greens Circle, TAMPA, FL 33647
MLS# TB8480109Listed by: PEOPLE'S CHOICE REALTY SVC LLC- New
 $1,617,000Active5 beds 4 baths3,140 sq. ft.
207 S Coolidge Avenue, TAMPA, FL 33609
MLS# TB8480325Listed by: FLORIDA EXECUTIVE REALTY 2 - New
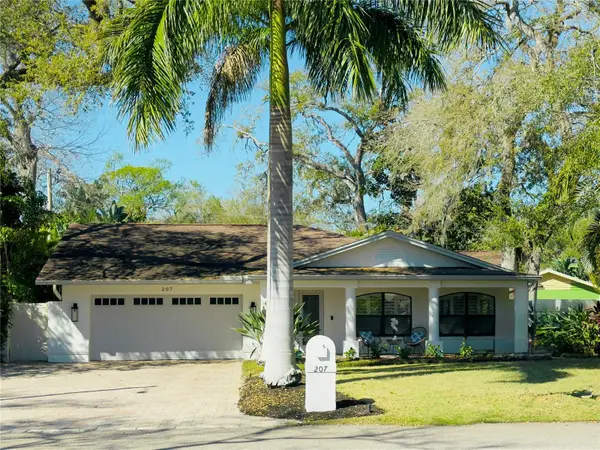
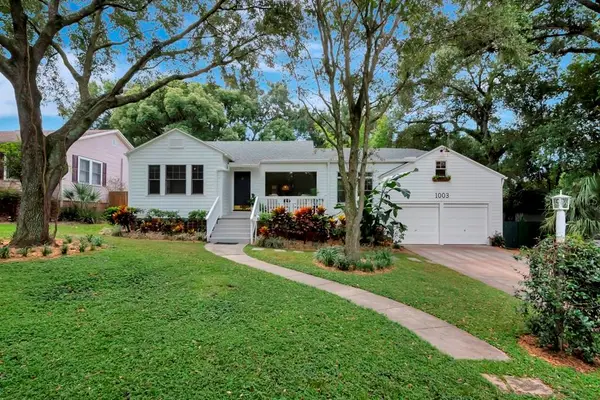 $650,000Active3 beds 2 baths1,754 sq. ft.
1003 E Clifton Street, TAMPA, FL 33604
MLS# TB8480524Listed by: SMITH & ASSOCIATES REAL ESTATE - New
 $315,000Active3 beds 2 baths1,112 sq. ft.
4607 N 36th Street, TAMPA, FL 33610
MLS# TB8480578Listed by: BRANDYWINE HOMES USA  $475,000Pending4 beds 2 baths2,435 sq. ft.
15005 Redcliff Drive, TAMPA, FL 33625
MLS# O6385936Listed by: BEYCOME OF FLORIDA LLC- New
 $2,750,000Active5 beds 4 baths3,871 sq. ft.
2909 W Bay Vista Avenue, TAMPA, FL 33611
MLS# TB8480628Listed by: KELLER WILLIAMS TAMPA CENTRAL - New
 $265,000Active3 beds 2 baths1,260 sq. ft.
3105 N 16th Street, TAMPA, FL 33605
MLS# TB8480751Listed by: MCBRIDE KELLY & ASSOCIATES - Open Sat, 12 to 4pmNew
 $684,500Active3 beds 2 baths1,726 sq. ft.
2714 W 1/2 Tampa Bay Boulevard, TAMPA, FL 33607
MLS# TB8480871Listed by: EXP REALTY LLC - New
 $1,899,000Active4 beds 5 baths3,496 sq. ft.
4117 W Azeele Street, TAMPA, FL 33609
MLS# TB8479797Listed by: SMITH & ASSOCIATES REAL ESTATE - New
 $4,350,000Active5 beds 6 baths5,772 sq. ft.
575 Bosphorous Avenue, TAMPA, FL 33606
MLS# TB8480552Listed by: SMITH & ASSOCIATES REAL ESTATE  $414,900Pending3 beds 2 baths1,396 sq. ft.
9739 Fredericksburg Road, TAMPA, FL 33635
MLS# TB8480060Listed by: GOOD 2 GO PROPERTY, LLC- New
 $619,000Active4 beds 3 baths2,699 sq. ft.
2206 Howard Lane, TAMPA, FL 33612
MLS# TB8480400Listed by: MCPEAK REALTY GROUP INC - New
 $2,595,000Active5 beds 5 baths4,308 sq. ft.
150 Chippewa Avenue, TAMPA, FL 33606
MLS# TB8480739Listed by: COLDWELL BANKER REALTY - New
 $494,999Active4 beds 2 baths1,666 sq. ft.
7607 Winging Way Drive, TAMPA, FL 33615
MLS# TB8463582Listed by: CHARLES RUTENBERG REALTY INC  $410,000Pending3 beds 1 baths1,327 sq. ft.
10224 N Oakleaf Avenue, TAMPA, FL 33612
MLS# TB8478924Listed by: CHARLES RUTENBERG REALTY INC- New
 $2,595,000Active5 beds 4 baths3,906 sq. ft.
3 Formosa Avenue, TAMPA, FL 33606
MLS# TB8479790Listed by: PALERMO REAL ESTATE PROF. INC.  $610,000Pending5 beds 3 baths3,476 sq. ft.
10744 Breaking Rocks Drive, TAMPA, FL 33647
MLS# TB8479872Listed by: LPT REALTY, LLC- New
 $395,000Active3 beds 2 baths1,228 sq. ft.
4107 W Grace Street, TAMPA, FL 33607
MLS# TB8480025Listed by: JEFFREY GOULD REAL ESTATE LLC - New
 $8,250,000Active4 beds 4 baths3,236 sq. ft.
62 Adalia Avenue, TAMPA, FL 33606
MLS# TB8480078Listed by: SOUTH CEDAR REAL ESTATE, INC - New
 $575,000Active3 beds 2 baths1,753 sq. ft.
3108 Lake Ellen Drive, TAMPA, FL 33618
MLS# TB8480098Listed by: SMITH & ASSOCIATES REAL ESTATE - New
 $499,000Active3 beds 2 baths1,695 sq. ft.
8626 Boysenberry Drive, TAMPA, FL 33635
MLS# TB8480335Listed by: RE/MAX ALLIANCE GROUP - New
 $899,900Active4 beds 3 baths3,440 sq. ft.
11403 Quiet Forest Drive, TAMPA, FL 33635
MLS# TB8480409Listed by: RE/MAX ACTION FIRST OF FLORIDA - New
 $1,290,000Active5 beds 4 baths3,314 sq. ft.
3814 W Sevilla Street, TAMPA, FL 33629
MLS# TB8480475Listed by: COMPASS FLORIDA LLC  $425,000Pending3 beds 3 baths1,272 sq. ft.
6005 N Tampa Street, TAMPA, FL 33604
MLS# TB8480646Listed by: REAL BROKER, LLC $400,000Pending4 beds 3 baths1,108 sq. ft.
8907 N Tampa Street, TAMPA, FL 33604
MLS# TB8480650Listed by: JPT REALTY LLC $250,000Pending2 beds 1 baths682 sq. ft.
3203 N 31st Street, TAMPA, FL 33605
MLS# TB8480710Listed by: TAM BAY REALTY LLC $485,000Pending4 beds 3 baths1,735 sq. ft.
4628 Cloverlawn Drive, TAMPA, FL 33624
MLS# TB8480393Listed by: LONDON FOSTER REALTY $538,000Active3 beds 2 baths1,240 sq. ft.
4319 S Cameron Avenue, TAMPA, FL 33611
MLS# TB8480616Listed by: COLDWELL BANKER REALTY $572,900Active4 beds 2 baths1,372 sq. ft.
4418 W Fairview Heights, TAMPA, FL 33616
MLS# TB8480574Listed by: COLDWELL BANKER REALTY $360,000Active4 beds 2 baths1,665 sq. ft.
2301 E Colby Lane, TAMPA, FL 33612
MLS# TB8479362Listed by: IMPACT REALTY TAMPA BAY
Local realty services provided by:CENTURY 21 Alliance Realty Group, CENTURY 21 First Story Real Estate, CENTURY 21 North East, CENTURY 21 Carioti, CENTURY 21 Myers Realty
The information being provided by Stellar Mls is for the consumer's personal, non-commercial use and may not be used for any purpose other than to identify prospective properties consumer may be interested in purchasing. Any information relating to real estate for sale referenced on this web site comes from the Internet Data Exchange (IDX) program of the Stellar Mls. CENTURY 21 Alliance Realty Group is not a Multiple Listing Service (MLS), nor does it offer MLS access. This website is a service of CENTURY 21 Alliance Realty Group, a broker participant of Stellar Mls. This web site may reference real estate listing(s) held by a brokerage firm other than the broker and/or agent who owns this web site.
The accuracy of all information, regardless of source, including but not limited to open house information, square footages and lot sizes, is deemed reliable but not guaranteed and should be personally verified through personal inspection by and/or with the appropriate professionals. The data contained herein is copyrighted by Stellar Mls and is protected by all applicable copyright laws. Any unauthorized dissemination of this information is in violation of copyright laws and is strictly prohibited.
Properties in listings may have been sold or may no longer be available.
Copyright 2026 Stellar Mls. All rights reserved.
2026 Georgia MLS. All rights reserved. Information Deem Reliable But Not Guaranteed March 8, 2026
Information deemed reliable but not guaranteed. Information is provided, in part, by Greater Miami MLS. This information being provided is for consumer's personal, non-commercial use and may not be used for any other purpose other than to identify prospective properties consumers may be interested in purchasing.
Neighborhoods near Tampa, FL
Zip codes near Tampa, FL
- 33602 homes for sale
- 33603 homes for sale
- 33604 homes for sale
- 33605 homes for sale
- 33606 homes for sale
- 33607 homes for sale
- 33609 homes for sale
- 33610 homes for sale
- 33611 homes for sale
- 33612 homes for sale
- 33613 homes for sale
- 33614 homes for sale
- 33615 homes for sale
- 33617 homes for sale
- 33618 homes for sale
- 33619 homes for sale
- 33624 homes for sale
- 33625 homes for sale
- 33629 homes for sale
- 33634 homes for sale
Popular searches near Tampa, FL
- Brandon homes for sale
- Carrollwood homes for sale
- Cheval homes for sale
- Citrus Park homes for sale
- East Lake-Orient Park homes for sale
- Egypt Lake-Leto homes for sale
- Keystone homes for sale
- Keystone-Citrus Park homes for sale
- Lake Magdalene homes for sale
- Lutz homes for sale
- Mango homes for sale
- Northdale homes for sale
- Palm River-Clair Mel homes for sale
- Palm River-Gibsonton homes for sale
- Progress Village homes for sale
- Temple Terrace homes for sale
- Thonotosassa homes for sale
- Town 'n' Country homes for sale
- University homes for sale
- Westchase homes for sale
Protect your home and budget from life's surprises with an Assurant Home Warranty, backed by a partner that supports you through every step of homeownership. Explore Plans.
©2026 Century 21 Real Estate LLC. All rights reserved. CENTURY 21®, the CENTURY 21 Logo and C21® are service marks owned by Century 21 Real Estate LLC. Century 21 Real Estate LLC fully supports the principles of the Fair Housing Act and the Equal Opportunity Act. Each office is independently owned and operated. Listing information is deemed reliable but not guaranteed accurate.