- Birdseye properties for sale
- Bristow properties for sale
- Clark properties for sale
- Columbia properties for sale
- Dubois properties for sale
- Eckerty properties for sale
- English properties for sale
- French Lick properties for sale
- French Lick Township properties for sale
- Greenfield properties for sale
- Jackson properties for sale
- Liberty properties for sale
- Marengo properties for sale
- Paoli properties for sale
- Paoli Township properties for sale
- Patoka properties for sale
- Stampers Creek properties for sale
- Sterling properties for sale
- Taswell properties for sale
- West Baden Springs properties for sale
47175, IN - homes for sale
4 of 4 results displayed
 $94,500Active3 beds 2 baths1,008 sq. ft.
358 N Sycamore Road, Taswell, IN 47175
MLS# 202547882Listed by: KEY ASSOCIATES REAL ESTATE $169,900Active4 beds 2 baths2,080 sq. ft.
17 S Trestle Road, Taswell, IN 47175
MLS# 202539291Listed by: RE/MAX REVOLUTION $163,900Active2 beds 1 baths1,360 sq. ft.
5085 W Jericho Road, Taswell, IN 47175
MLS# 202532605Listed by: GRIFFIN REALTY HOLDINGS LLC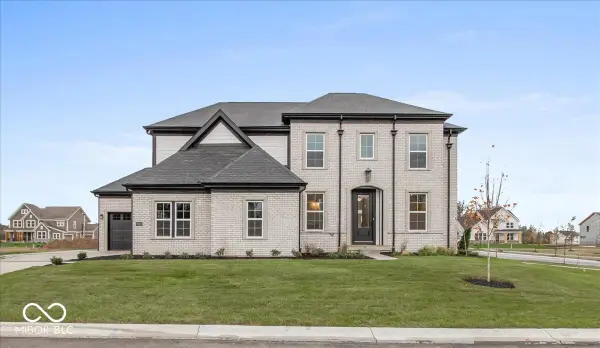 $739,990Pending4 beds 4 baths4,029 sq. ft.
6996 Gibson Lane, McCordsville, IN 46055
MLS# 22055580Listed by: HMS REAL ESTATE, LLC
Local realty services provided by:CENTURY 21 Affiliated, CENTURY 21 Scheetz
IRMLS information is provided exclusively for consumers' personal, non-commercial use and may not be used for any purpose other than to identify prospective properties consumers may be interested in purchasing. IRMLS Data is deemed reliable but is not guaranteed accurate by the MLS. IRMLS information provided by the Indiana Regional MLS. Copyright 2025 Indiana Regional MLS LLC.
Popular searches near 47175
Popular neighborhoods near 47175
- California, Louisville properties for sale
- Chickasaw, Louisville properties for sale
- Christmas Lake Village, Lamar properties for sale
- Clarksville, Clarksville properties for sale
- Cloverleaf, Louisville properties for sale
- Hallmark, Louisville properties for sale
- Heatherfields, Louisville properties for sale
- Jacobs, Louisville properties for sale
- New Albany, New Albany properties for sale
- Park Duvalle, Louisville properties for sale
- Park Hill, Louisville properties for sale
- Parkland, Louisville properties for sale
- Pleasure Ridge Park, Louisville properties for sale
- Portland, Louisville properties for sale
- Riverside Gardens, Louisville properties for sale
- Russell, Louisville properties for sale
- St. Dennis, Louisville properties for sale
- Shawnee, Louisville properties for sale
- Shively, Louisville properties for sale
- Valley Station, Louisville properties for sale
Counties near Taswell, 47175
- Breckinridge County properties for sale
- Clark County properties for sale
- Crawford County properties for sale
- Daviess County properties for sale
- Dubois County properties for sale
- Floyd County properties for sale
- Greene County properties for sale
- Harrison County properties for sale
- Jackson County properties for sale
- Jefferson County properties for sale
- Lawrence County properties for sale
- Martin County properties for sale
- Meade County properties for sale
- Orange County properties for sale
- Perry County properties for sale
- Pike County properties for sale
- Scott County properties for sale
- Spencer County properties for sale
- Warrick County properties for sale
- Washington County properties for sale
©2025 Century 21 Real Estate LLC. All rights reserved. CENTURY 21®, the CENTURY 21 Logo and C21® are service marks owned by Century 21 Real Estate LLC. Century 21 Real Estate LLC fully supports the principles of the Fair Housing Act and the Equal Opportunity Act. Each office is independently owned and operated. Listing information is deemed reliable but not guaranteed accurate.
©2025 Century 21 Real Estate LLC. All rights reserved. CENTURY 21®, the CENTURY 21 Logo and C21® are service marks owned by Century 21 Real Estate LLC. Century 21 Real Estate LLC fully supports the principles of the Fair Housing Act and the Equal Opportunity Act. Each office is independently owned and operated. Listing information is deemed reliable but not guaranteed accurate.