- Bemiss, Spokane properties for sale
- Browne's Addition, Spokane properties for sale
- Chief Garry Park, Spokane properties for sale
- Cliff/Cannon, Spokane properties for sale
- Comstock, Spokane properties for sale
- East Central, Spokane properties for sale
- Emerson, Spokane properties for sale
- Grandview, Spokane properties for sale
- Hillyard, Spokane properties for sale
- Latah Valley, Spokane properties for sale
- Lincoln Heights, Spokane properties for sale
- Logan, Spokane properties for sale
- Manito, Spokane properties for sale
- Minnehaha, Spokane properties for sale
- Riverside, Spokane properties for sale
- Rockwood, Spokane properties for sale
- Southgate, Spokane properties for sale
- Villages at Stonehill, Liberty Lake properties for sale
- West Central, Spokane properties for sale
- West Hills, Spokane properties for sale
Tekoa, WA - homes for sale
16 of 16 results displayed
- New
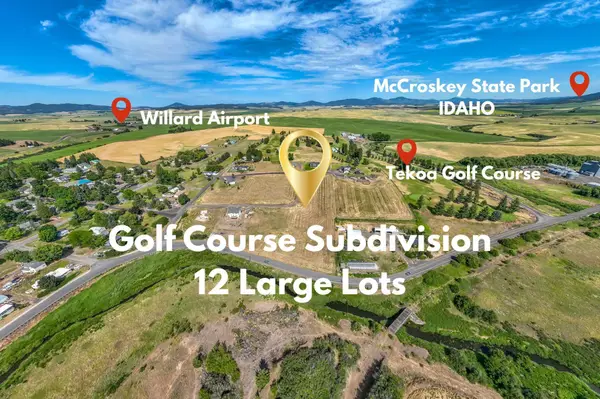 $498,000Active6.34 Acres
435 S Skyline St, Tekoa, WA 99033
MLS# 202527760Listed by: KELLER WILLIAMS SPOKANE - MAIN - New
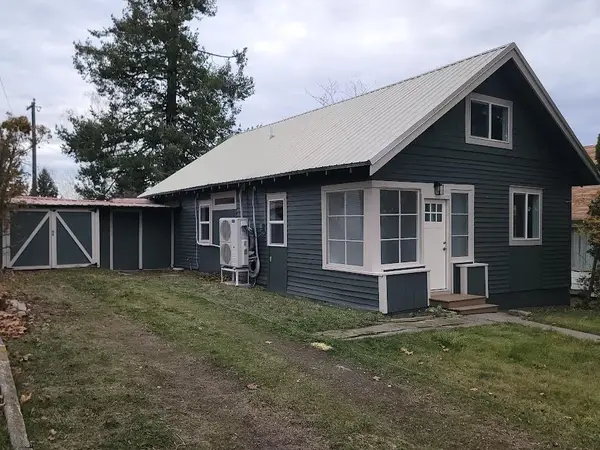 $265,000Active3 beds 1 baths
121 N Lake St, Tekoa, WA 99033
MLS# 202527556Listed by: BEST CHOICE REALTY  $395,000Active4 beds 2 baths3,034 sq. ft.
105 S Howard St, Tekoa, WA 99033
MLS# 288187Listed by: COLDWELL BANKER TOMLINSON ASSOCIATES $330,000Active4 beds 2 baths2,505 sq. ft.
102 S Lake St, Tekoa, WA 99033
MLS# 202525128Listed by: KELLER WILLIAMS SPOKANE - MAIN $239,000Active2 beds 1 baths950 sq. ft.
231 W Poplar St, Tekoa, WA 99033
MLS# 202525126Listed by: KELLER WILLIAMS SPOKANE - MAIN $225,000Active3 beds 1 baths1,648 sq. ft.
228 W Poplar St, Tekoa, WA 99033
MLS# 202525024Listed by: REAL BROKER LLC $275,000Active4 beds 2 baths2,200 sq. ft.
242 S Broadway St, Tekoa, WA 99033
MLS# 202523613Listed by: AMPLIFY REAL ESTATE SERVICES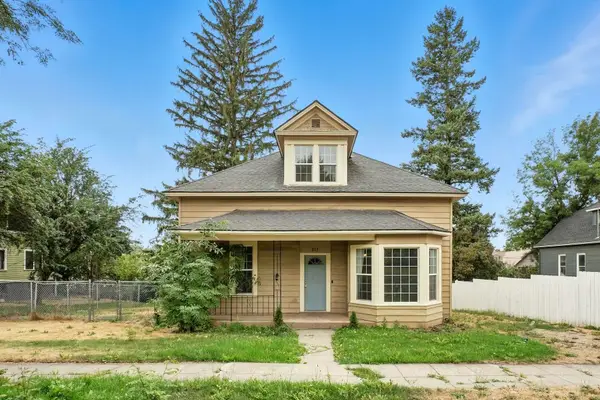 $300,000Active4 beds 2 baths2,225 sq. ft.
217 S Broadway St, Tekoa, WA 99033
MLS# 202523119Listed by: RE/MAX INLAND EMPIRE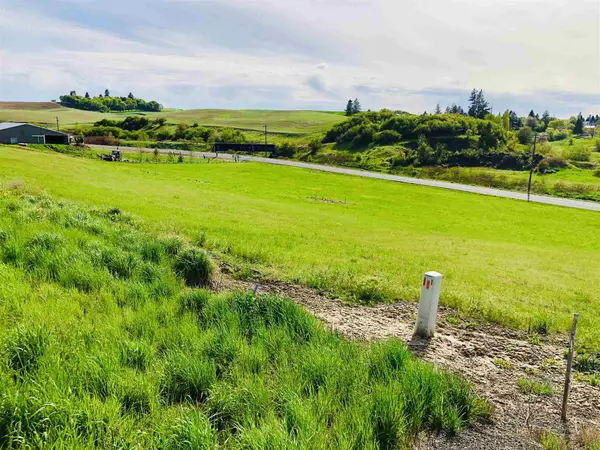 $39,000Active0.47 Acres
438 S College St, Tekoa, WA 99033
MLS# 202526954Listed by: KELLER WILLIAMS SPOKANE - MAIN $399,999Active4 beds 3 baths2,952 sq. ft.
320 S Ramsey St, Tekoa, WA 99033
MLS# 202520651Listed by: PROFESSIONAL REALTY SERVICES $319,500Active4 beds 1 baths2,090 sq. ft.
110 W Connell St, Tekoa, WA 99033
MLS# 202520359Listed by: HOMES 4 YOU, LLC $272,500Active3 beds 2 baths1,296 sq. ft.
128 S College St, Tekoa, WA 99033
MLS# 202520260Listed by: PROFESSIONAL REALTY SERVICES $209,000Active2 beds 2 baths1,109 sq. ft.
521 N Ramsey St, Tekoa, WA 99033
MLS# 202526929Listed by: KELLER WILLIAMS SPOKANE - MAIN- New
 $389,000Active5 beds 3 baths2,810 sq. ft.
147 N Lindsey St, Tekoa, WA 99033
MLS# 202527736Listed by: KELLER WILLIAMS SPOKANE - MAIN  $75,000Active0.25 Acres
XXX Truax St, Tekoa, WA 99033
MLS# 281451Listed by: KELLER WILLIAMS SPOKANE $75,000Active0.25 Acres
XXX Truax St. St, Tekoa, WA 99003
MLS# 202511387Listed by: KELLER WILLIAMS SPOKANE - MAIN
Local realty services provided by:CENTURY 21 Kelly Davis, CENTURY 21 Tri-Cities
Neighborhoods near Tekoa, WA
Popular searches near Tekoa, WA
- Conkling Park properties for sale
- Desmet properties for sale
- Emida properties for sale
- Fairfield properties for sale
- Farmington properties for sale
- Garfield-Oakesdale properties for sale
- Harrison properties for sale
- Malden properties for sale
- Mica properties for sale
- Oakesdale properties for sale
- Palouse properties for sale
- Plummer properties for sale
- Potlatch properties for sale
- Rockford properties for sale
- Rockford Bay properties for sale
- Rosalia properties for sale
- Spangle properties for sale
- Tensed properties for sale
- Valleyford properties for sale
- Worley properties for sale
©2025 Century 21 Real Estate LLC. All rights reserved. CENTURY 21®, the CENTURY 21 Logo and C21® are service marks owned by Century 21 Real Estate LLC. Century 21 Real Estate LLC fully supports the principles of the Fair Housing Act and the Equal Opportunity Act. Each office is independently owned and operated. Listing information is deemed reliable but not guaranteed accurate.
©2025 Century 21 Real Estate LLC. All rights reserved. CENTURY 21®, the CENTURY 21 Logo and C21® are service marks owned by Century 21 Real Estate LLC. Century 21 Real Estate LLC fully supports the principles of the Fair Housing Act and the Equal Opportunity Act. Each office is independently owned and operated. Listing information is deemed reliable but not guaranteed accurate.