- Crandall homes for sale
- Fate homes for sale
- Forney homes for sale
- Heartland homes for sale
- Heath homes for sale
- Kaufman homes for sale
- McLendon-Chisholm homes for sale
- Northeast Rockwall homes for sale
- Oak Ridge homes for sale
- Poetry homes for sale
- Post Oak Bend City homes for sale
- Rockwall homes for sale
- Seagoville homes for sale
- South Rockwall homes for sale
- Sunnyvale homes for sale
- Talty homes for sale
- Terrell homes for sale
- Terrell South homes for sale
- Travis Ranch homes for sale
- Union Valley homes for sale
75160, TX - homes for sale
293 of 293 results displayed
- New
 $259,900Active3 beds 2 baths1,609 sq. ft.
1803 Eastgate Drive, Terrell, TX 75160
MLS# 21190960Listed by: C21 FINE HOMES JUDGE FITE - New
 $594,990Active4 beds 4 baths3,092 sq. ft.
327 Lovers Lane, Terrell, TX 75160
MLS# 21201467Listed by: CARRASCO REAL ESTATE CO. - New
 $585,000Active3 beds 3 baths2,676 sq. ft.
8 Griffith Court, Terrell, TX 75160
MLS# 21194863Listed by: RANDY LOCHHEAD, REALTOR - New
 $340,000Active4 beds 3 baths2,432 sq. ft.
130 Yosemite Lane, Terrell, TX 75160
MLS# 21179619Listed by: MARK SPAIN REAL ESTATE - New
 $199,900Active2 beds 2 baths1,600 sq. ft.
103 W Damon Street, Terrell, TX 75160
MLS# 21196821Listed by: PREMIER LEGACY REAL ESTATE LLC - New
 $2,300,000Active4 beds 4 baths5,587 sq. ft.
9595 County Road 262, Crandall, TX 75114
MLS# 21197073Listed by: TX LAKE & LAND REAL ESTATE - New
 $599,999Active4 beds 4 baths3,221 sq. ft.
702 Griffith, Terrell, TX 75160
MLS# 21196258Listed by: ALL CITY - New
 $300,000Active3 beds 3 baths3,042 sq. ft.
511 N Virginia Street, Terrell, TX 75160
MLS# 21195322Listed by: JPAR DALLAS - New
 $385,000Active3 beds 2 baths2,549 sq. ft.
401 Pacific Avenue, Terrell, TX 75160
MLS# 21194679Listed by: OAKLEY REAL ESTATE, LLC - New
 $465,000Active3.03 Acres
15227 State Highway 205, Terrell, TX 75160
MLS# 21190956Listed by: RE/MAX FOUR CORNERS - New
 $320,500Active3 beds 2 baths1,304 sq. ft.
11827 Fm 1392, Terrell, TX 75160
MLS# 21192329Listed by: CENTURY 21 JUDGE FITE CO. - New
 $388,490Active5 beds 3 baths2,660 sq. ft.
1919 Reveille Way, Terrell, TX 75160
MLS# 21192322Listed by: JEANETTE ANDERSON REAL ESTATE - New
 $373,490Active4 beds 2 baths2,088 sq. ft.
1923 Reveille Way, Terrell, TX 75160
MLS# 21192323Listed by: JEANETTE ANDERSON REAL ESTATE - New
 $225,000Active3 beds 2 baths1,752 sq. ft.
17540 Old George Drive, Terrell, TX 75160
MLS# 21170503Listed by: MONUMENT REALTY - New
 $1,400,000Active8.98 Acres
0 Rose Hill Road, Terrell, TX 75160
MLS# 21190133Listed by: KELLER WILLIAMS REALTY DPR - New
 $129,900Active3 beds 1 baths1,492 sq. ft.
714 S Medora Street, Terrell, TX 75160
MLS# 21191209Listed by: COLDWELL BANKER APEX, REALTORS  $399,950Active3 beds 3 baths2,221 sq. ft.
608 N Catherine Street, Terrell, TX 75160
MLS# 21189717Listed by: EBBY HALLIDAY, REALTORS $565,000Active8.22 Acres
Lot 0000 W End, Terrell, TX 75160
MLS# 21188514Listed by: EBBY HALLIDAY, REALTORS $145,000Active3 beds 2 baths1,500 sq. ft.
904 E College Street, Terrell, TX 75160
MLS# 21187253Listed by: ONLY 1 REALTY GROUP DALLAS $1,275,000Active21.65 Acres
0 W End, Terrell, TX 75160
MLS# 21188494Listed by: EBBY HALLIDAY, REALTORS $325,000Active4 beds 2 baths1,752 sq. ft.
404 W Rochester Street, Terrell, TX 75160
MLS# 21181974Listed by: ELSIE HALBERT REAL ESTATE, LLC $60,000Active0.3 Acres
604 S Ann Street, Terrell, TX 75160
MLS# 21187923Listed by: BK REAL ESTATE $60,000Active0.3 Acres
103 Sparks Street, Terrell, TX 75160
MLS# 21187942Listed by: BK REAL ESTATE $210,000Active3 beds 1 baths1,080 sq. ft.
901 Johnson Street, Terrell, TX 75160
MLS# 21187077Listed by: MONUMENT REALTY $309,900Active4 beds 3 baths1,804 sq. ft.
523 New Hope Street, Terrell, TX 75160
MLS# 21187560Listed by: COLDWELL BANKER APEX, REALTORS $50,000Active0.65 Acres
00 Fm Rd 1392, Terrell, TX 75160
MLS# 21187142Listed by: EPPS REALTY, LLC $269,900Active3 beds 2 baths1,873 sq. ft.
135 Jackson Drive, Terrell, TX 75160
MLS# 21187140Listed by: JEANETTE ANDERSON REAL ESTATE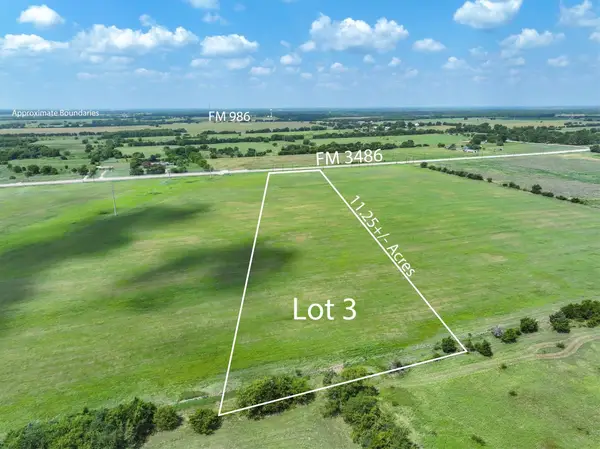 $467,500Active11.28 Acres
TBD Fm 3486 #3, Terrell, TX 75160
MLS# 21186777Listed by: EXIT REALTY PRO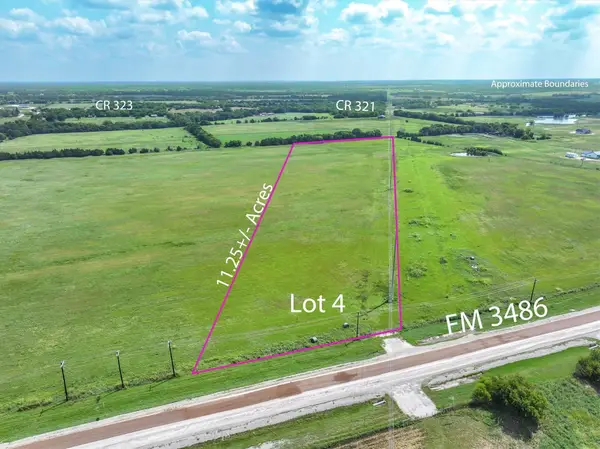 $467,500Active11.28 Acres
TBD Fm 3486 #4, Terrell, TX 75160
MLS# 21186781Listed by: EXIT REALTY PRO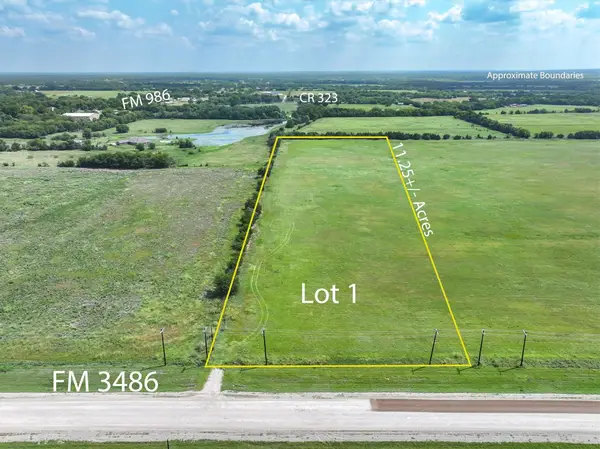 $467,500Active11.28 Acres
TBD Fm 3486 #1, Terrell, TX 75160
MLS# 21186774Listed by: EXIT REALTY PRO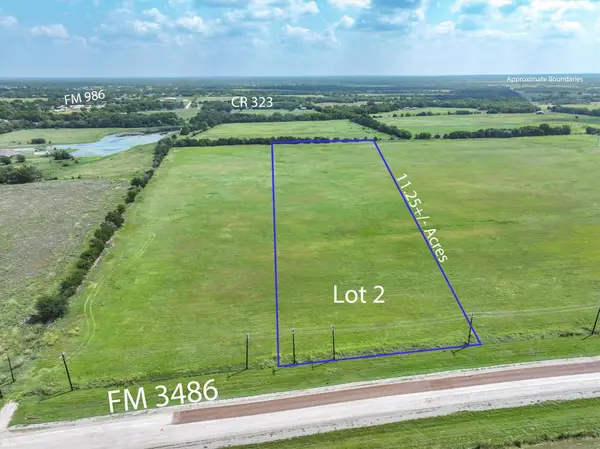 $467,500Active11.28 Acres
TBD Fm 3486 #2, Terrell, TX 75160
MLS# 21186775Listed by: EXIT REALTY PRO $299,900Active3 beds 3 baths1,998 sq. ft.
105 Brooks Street, Terrell, TX 75160
MLS# 21180575Listed by: EBBY HALLIDAY, REALTORS $341,900Active4 Acres
0 Fm Rd 1392, Terrell, TX 75160
MLS# 21185823Listed by: JOSEPH WALTER REALTY, LLC $289,450Active3 beds 2 baths1,876 sq. ft.
217 Melody Lane, Terrell, TX 75160
MLS# 21182734Listed by: MONUMENT REALTY $1,350,000Active6 beds 7 baths4,921 sq. ft.
8890 County Road 215, Terrell, TX 75160
MLS# 21181561Listed by: KELLER WILLIAMS ROCKWALL $339,900Pending5 beds 3 baths2,198 sq. ft.
140 Redwood Lane, Terrell, TX 75160
MLS# 21183865Listed by: OAKLEY REAL ESTATE, LLC $299,900Active3 beds 3 baths2,037 sq. ft.
103 Brooks Drive, Terrell, TX 75160
MLS# 21180295Listed by: EXP REALTY LLC $625,000Active3 beds 2 baths2,116 sq. ft.
1439 Davis Lane, Terrell, TX 75160
MLS# 21180166Listed by: KELLER WILLIAMS ROCKWALL $13,055,000Active186.5 Acres
TBD Fm Rd 429, Terrell, TX 75160
MLS# 21077134Listed by: BERKSHIRE HATHAWAYHS PENFED TX $225,000Active3 beds 1 baths1,350 sq. ft.
1401 N Rockwall Avenue, Terrell, TX 75160
MLS# 21174281Listed by: COMPETITIVE EDGE REALTY LLC $353,490Active4 beds 2 baths2,088 sq. ft.
1903 Reveille Way, Terrell, TX 75160
MLS# 21179216Listed by: JEANETTE ANDERSON REAL ESTATE $399,490Active4 beds 2 baths2,367 sq. ft.
1911 Reveille Way, Terrell, TX 75160
MLS# 21179228Listed by: JEANETTE ANDERSON REAL ESTATE $368,490Active4 beds 2 baths2,188 sq. ft.
1921 Reveille Way, Terrell, TX 75160
MLS# 21179232Listed by: JEANETTE ANDERSON REAL ESTATE $325,000Active3 beds 2 baths1,815 sq. ft.
131 Yosemite Lane, Terrell, TX 75160
MLS# 21177308Listed by: THE GONZALES GROUP, LLC- $265,000Active3 beds 2 baths1,676 sq. ft.
201 Collins Drive, Terrell, TX 75160
MLS# 21178592Listed by: REAL BROKER, LLC  $280,000Active12.53 Acres
8654 County Road 301, Terrell, TX 75160
MLS# 21177108Listed by: COLDWELL BANKER APEX, REALTORS $600,000Active4 beds 5 baths3,842 sq. ft.
1072 West Secretariat Drive, Terrell, TX 75160
MLS# 21175620Listed by: COLDWELL BANKER APEX, REALTORS $229,900Active3.55 Acres
00 Fm 3486, Terrell, TX 75160
MLS# 21176892Listed by: OAKLEY REAL ESTATE, LLC $299,000Active4.14 Acres
TBD Cr 2326, Terrell, TX 75160
MLS# 21175715Listed by: EATON REALTY $254,900Active3 beds 2 baths1,813 sq. ft.
200 Chappell Street, Terrell, TX 75160
MLS# 21174940Listed by: EXALT REALTY $46,000Active0.13 Acres
TBD1 Thomas Street, Terrell, TX 75160
MLS# 21174979Listed by: EXALT REALTY $140,000Active3 beds 2 baths1,073 sq. ft.
1212 S Adelaide Street, Terrell, TX 75160
MLS# 21173161Listed by: UNITED REAL ESTATE FRISCO $320,573Active3 beds 2 baths1,620 sq. ft.
118 Coyote Circle, Terrell, TX 75160
MLS# 21174665Listed by: IMP REALTY $509,000Pending4 beds 3 baths2,550 sq. ft.
15198 Saddle Ridge Circle, Terrell, TX 75160
MLS# 21169668Listed by: MONUMENT REALTY $850,000Active11.59 Acres
TBD Hwy 205, Terrell, TX 75160
MLS# 21171748Listed by: EXIT REALTY PINNACLE GROUP $499,900Active4 beds 3 baths4,633 sq. ft.
203b N Rockwall Avenue, Terrell, TX 75160
MLS# 21170124Listed by: HOTTINGER REAL ESTATE, INC. $68,000Active0.23 Acres
0000 Mineral Wells Street, Terrell, TX 75160
MLS# 21169203Listed by: ELITE REAL ESTATE TEXAS $525,000Active5 beds 4 baths3,252 sq. ft.
1761 County Road 2320, Terrell, TX 75160
MLS# 21168780Listed by: STEPSTONE REALTY LLC $2,200,000Active5 beds 6 baths6,201 sq. ft.
705 Griffith Avenue, Terrell, TX 75160
MLS# 21163730Listed by: BRIGGS FREEMAN SOTHEBY'S INT'L $269,000Active4 beds 3 baths2,468 sq. ft.
124 Westvue Street, Terrell, TX 75160
MLS# 21158908Listed by: ORCHARD BROKERAGE $213,350Active3 beds 2 baths1,653 sq. ft.
1212 S Rockwall Avenue, Terrell, TX 75160
MLS# 21160046Listed by: NE TEXAS REGIONAL REALTY $240,000Pending3 beds 2 baths1,349 sq. ft.
101 Shady Creek Lane, Terrell, TX 75160
MLS# 21166574Listed by: MARK SPAIN REAL ESTATE $299,000Active3 beds 4 baths2,136 sq. ft.
103 Rock Creek Lane, Terrell, TX 75160
MLS# 21161210Listed by: COMPETITIVE EDGE REALTY LLC $400,000Active4 beds 3 baths2,344 sq. ft.
802 S Medora Street, Terrell, TX 75160
MLS# 21166206Listed by: KAREN COLLINS $329,850Active3 beds 2 baths1,934 sq. ft.
1219 S Rockwall Avenue, Terrell, TX 75160
MLS# 21164051Listed by: TEXAS COMMUNITY REALTY $1,250,000Active5 beds 4 baths4,019 sq. ft.
19930 County Road 324, Terrell, TX 75160
MLS# 21163042Listed by: MCDONALD REALTY TEAM $120,000Pending3 beds 2 baths1,450 sq. ft.
509 Bethlehem Street, Terrell, TX 75160
MLS# 21162717Listed by: EXP REALTY LLC $599,900Active3 beds 2 baths2,062 sq. ft.
8429 Karen Lane, Terrell, TX 75160
MLS# 21146161Listed by: REGAL, REALTORS $73,999Active1 beds 1 baths584 sq. ft.
305 W End Street, Terrell, TX 75160
MLS# 54026666Listed by: 1ST TEXAS REALTY SERVICES $200,000Active3 beds 2 baths1,215 sq. ft.
806 E College Street, Terrell, TX 75160
MLS# 21152449Listed by: REDFIN CORPORATION $500,000Active16 Acres
TBD Fm Road 429, Terrell, TX 75160
MLS# 21158070Listed by: MCCOY REALTY $210,000Active3 beds 2 baths1,439 sq. ft.
412 S Park Street, Terrell, TX 75160
MLS# 21156885Listed by: EPIQUE REALTY LLC $430,000Active4 beds 3 baths2,715 sq. ft.
300 Rash Lane, Terrell, TX 75160
MLS# 21156628Listed by: MILLER HOMES GROUP $549,750Active5 beds 3 baths3,464 sq. ft.
508 N Virginia Street, Terrell, TX 75160
MLS# 21152403Listed by: SCOUT RE TEXAS $255,000Pending3 beds 2 baths1,469 sq. ft.
4000 Dee Drive, Terrell, TX 75160
MLS# 21155162Listed by: DECORATIVE REAL ESTATE $625,000Active4 beds 3 baths2,838 sq. ft.
1178 E Remington Park Drive, Talty, TX 75160
MLS# 21154603Listed by: LONE STAR REALTY $529,900Active3 beds 2 baths2,590 sq. ft.
18113 Osage Lane, Terrell, TX 75160
MLS# 21152741Listed by: BUILDERS REALTY- $282,500Active4.62 Acres
917 N Blanche Road, Terrell, TX 75160
MLS# 21154367Listed by: ONDEMAND REALTY  $414,900Pending3 beds 2 baths2,679 sq. ft.
9902 County Road 2434, Terrell, TX 75160
MLS# 21150289Listed by: AMBITIONX REAL ESTATE $589,000Active3 beds 2 baths2,196 sq. ft.
10471 Holly Creek Road, Terrell, TX 75160
MLS# 21137335Listed by: M&D REAL ESTATE $744,900Active5 beds 3 baths2,054 sq. ft.
13025 Shadow Brook Court, Terrell, TX 75160
MLS# 21151289Listed by: REALTY INC. $290,000Active6 beds 4 baths2,882 sq. ft.
507 W Nash Street, Terrell, TX 75160
MLS# 21151671Listed by: PINNACLE REALTY ADVISORS $775,000Active3 beds 2 baths2,133 sq. ft.
10715 County Road 2458, Poetry, TX 75160
MLS# 21150459Listed by: COLDWELL BANKER APEX, REALTORS $247,000Active3 beds 2 baths1,235 sq. ft.
309 Thomas Street, Terrell, TX 75160
MLS# 21150430Listed by: FOXY REAL ESTATE, LLC- New
 $337,900Active4 beds 3 baths1,900 sq. ft.
208 North Island Drive, Terrell, TX 75160
MLS# 21191999Listed by: LGI HOMES  $360,000Active3 beds 2 baths1,802 sq. ft.
1055 Wright Street, Terrell, TX 75160
MLS# 21149511Listed by: ALLIE BETH ALLMAN & ASSOC. $345,999Active5 beds 3 baths2,944 sq. ft.
861 Betty Drive, Terrell, TX 75160
MLS# 21148983Listed by: EBBY HALLIDAY, REALTORS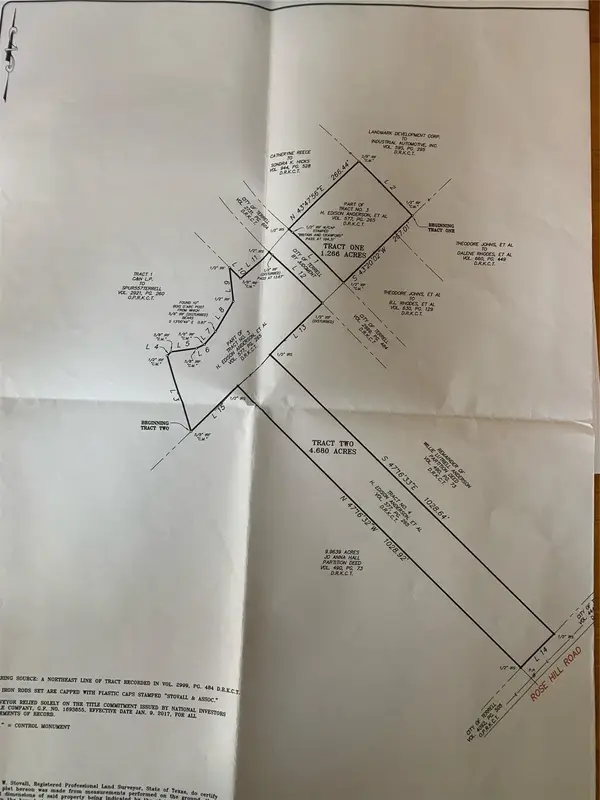 $274,999Active5.95 Acres
01 Rose Hill Road, Terrell, TX 75160
MLS# 21148925Listed by: EXP REALTY LLC $294,900Active3 beds 2 baths1,425 sq. ft.
204 North Island Drive, Terrell, TX 75160
MLS# 21148729Listed by: LGI HOMES $249,999Active3 beds 2 baths1,440 sq. ft.
914 N Catherine Street, Terrell, TX 75160
MLS# 21147832Listed by: AMX REALTY $434,777Active2.9 Acres
15457 State Highway 205, Terrell, TX 75160
MLS# 21144947Listed by: COLDWELL BANKER APEX, REALTORS $360,000Pending3 beds 3 baths2,881 sq. ft.
404 Laurel Trail N, Terrell, TX 75160
MLS# 21145349Listed by: ORCHARD BROKERAGE $379,990Active3 beds 2 baths1,440 sq. ft.
906 Griffith Avenue, Terrell, TX 75160
MLS# 21148093Listed by: DECORATIVE REAL ESTATE $199,000Pending3 beds 2 baths1,100 sq. ft.
307 E Mccoulskey Street, Terrell, TX 75160
MLS# 21144011Listed by: COLDWELL BANKER APEX, REALTORS $1,850,000Active13.06 Acres
2578 Fm-2578 Road, Terrell, TX 75160
MLS# 21146394Listed by: H&O INVESTMENTS, INC $247,000Active3 beds 2 baths1,353 sq. ft.
246 Willow Creek Lane, Terrell, TX 75160
MLS# 21137326Listed by: MARK SPAIN REAL ESTATE $299,900Active3 beds 2 baths1,615 sq. ft.
2412 Colquitt Road, Terrell, TX 75160
MLS# 21144096Listed by: JPAR - ROCKWALL $69,500Active1 Acres
23 County Rd 316c, Terrell, TX 75161
MLS# 21135741Listed by: LEAKE BRADFORD REALTY $749,999Active21.34 Acres
5627 Fm 987, Terrell, TX 75160
MLS# 21141717Listed by: PREMIER LEGACY REAL ESTATE LLC $315,000Active4 beds 3 baths2,181 sq. ft.
714 Bethlehem Street, Terrell, TX 75160
MLS# 21141583Listed by: KELLER WILLIAMS REALTY-FM $48,900Active3 beds 2 baths1,056 sq. ft.
2390 W Moore Avenue #L14, Terrell, TX 75160
MLS# 21141306Listed by: LONE STAR REALTY $319,900Pending2 beds 2 baths1,457 sq. ft.
218 Elm Drive, Terrell, TX 75160
MLS# 21139553Listed by: OAKLEY REAL ESTATE, LLC- $100,000Active0.28 Acres
TBD 0 6th Street, Terrell, TX 75160
MLS# 21136825Listed by: COLDWELL BANKER APEX, REALTORS  $212,000Active3 beds 2 baths1,152 sq. ft.
1018 S Frances Street, Terrell, TX 75160
MLS# 21136497Listed by: TDREALTY $324,999Pending3 beds 2 baths1,770 sq. ft.
116 Coyote Circle, Terrell, TX 75160
MLS# 21138321Listed by: IMP REALTY $69,900Active0.53 Acres
401 Greenwood Street, Terrell, TX 75160
MLS# 21136479Listed by: COMPASS RE TEXAS, LLC. $1,099,999Active4 beds 4 baths3,087 sq. ft.
14346 Quail Lane, Terrell, TX 75160
MLS# 21135696Listed by: COMPASS RE TEXAS, LLC $549,000Active3 beds 2 baths2,312 sq. ft.
10825 County Road 2458, Poetry, TX 75160
MLS# 21124561Listed by: RE/MAX LANDMARK $287,999Active3 beds 2 baths1,772 sq. ft.
305 Westvue Street, Terrell, TX 75160
MLS# 21134957Listed by: ALL CITY $304,900Active2.07 Acres
TBD Austin Circle, Rockwall, TX 75032
MLS# 21135012Listed by: CALL IT CLOSED REALTY $299,000Active3 beds 2 baths2,128 sq. ft.
10051 Private Road 2429, Terrell, TX 75160
MLS# 21109040Listed by: TEXAN TEAM $150,000Active3 Acres
TBD County Road 131b, Terrell, TX 75160
MLS# 21128043Listed by: BERKSHIRE HATHAWAY HOME SERVICES A ACTION REALTORS $238,900Active3 beds 2 baths1,403 sq. ft.
107 Kennedy Drive, Terrell, TX 75160
MLS# 21127718Listed by: DALTON WADE, INC. $350,000Active11 Acres
TBD Cr-301, Terrell, TX 75160
MLS# 21126834Listed by: ULTIMA REAL ESTATE $659,900Active5 beds 4 baths2,373 sq. ft.
1246 Meadow Way, Terrell, TX 75160
MLS# 21124316Listed by: BLUEMARK, LLC $529,000Active2 beds 1 baths980 sq. ft.
9046 Private Road 2329, Terrell, TX 75160
MLS# 21126571Listed by: MERSAES REAL ESTATE, INC. $259,000Active3 beds 2 baths1,580 sq. ft.
215 Willow Creek Lane, Terrell, TX 75160
MLS# 21125080Listed by: EXP REALTY $89,900Active1.17 Acres
14776 County Road 234, Terrell, TX 75160
MLS# 21124531Listed by: ELITE LIVING REALTY $492,000Active4 beds 3 baths2,332 sq. ft.
1415 W Oaklawn Drive, Talty, TX 75160
MLS# 21124128Listed by: MY CASTLE REALTY $799,900Active4 beds 2 baths3,100 sq. ft.
9875 Old Bridge Road, Terrell, TX 75160
MLS# 21119111Listed by: CENTURY 21 FIRST GROUP $151,999Active3 beds 2 baths1,600 sq. ft.
414 Thomas Street, Terrell, TX 75160
MLS# 21119800Listed by: M&D REAL ESTATE $135,000Active0.52 Acres
201 W Myers Street, Terrell, TX 75160
MLS# 21122239Listed by: ULTRA REAL ESTATE SERVICES $45,000Active0.17 Acres
1001 S Medora Street, Terrell, TX 75160
MLS# 21122221Listed by: ULTRA REAL ESTATE SERVICES $295,000Active5 Acres
6165 Cr-253, Terrell, TX 75160
MLS# 21120626Listed by: LEGACY & CO. REAL ESTATE LLC $399,999Active3 beds 2 baths1,840 sq. ft.
817 N Virginia Street, Terrell, TX 75160
MLS# 21120199Listed by: MONUMENT REALTY $373,400Active4 beds 3 baths2,229 sq. ft.
500 Mineral Wells Street, Terrell, TX 75160
MLS# 21116982Listed by: JONES-PAPADOPOULOS & CO $219,300Pending3 beds 2 baths1,617 sq. ft.
207 E Mccoulskey Street, Terrell, TX 75160
MLS# 21120235Listed by: NE TEXAS REGIONAL REALTY $254,990Pending3 beds 2 baths1,276 sq. ft.
12204 Douglas Fir Cir, Mustang Ridge, TX 78610
MLS# 7663398Listed by: D.R. HORTON, AMERICA'S BUILDER $354,990Active3 beds 3 baths2,069 sq. ft.
9617 Dahlia Boulevard, Mesquite, TX 75126
MLS# 21118662Listed by: REALTY OF AMERICA, LLC $45,000Active0.15 Acres
0000 Pinkston, Terrell, TX 75160
MLS# 21120455Listed by: MONUMENT REALTY $589,900Active4 beds 3 baths2,323 sq. ft.
1844 County Road 2320, Terrell, TX 75160
MLS# 21093313Listed by: AT HOME TEXAS REAL ESTATE $589,900Active4 beds 3 baths2,326 sq. ft.
1838 County Road 2320, Terrell, TX 75160
MLS# 21093333Listed by: AT HOME TEXAS REAL ESTATE $475,000Active16.24 Acres
Lot 4 Cr-245, Terrell, TX 75160
MLS# 21116278Listed by: RE/MAX LANDMARK ROSE $253,999Active3 beds 2 baths1,435 sq. ft.
314 Greenwood Street, Terrell, TX 75160
MLS# 21115344Listed by: ALL CITY $1,000,000Active3 beds 3 baths4,128 sq. ft.
10461 County Road 2460, Poetry, TX 75160
MLS# 21093299Listed by: RE/MAX LANDMARK ROSE $323,490Pending4 beds 2 baths1,791 sq. ft.
1915 Reveille Way, Terrell, TX 75160
MLS# 21116787Listed by: JEANETTE ANDERSON REAL ESTATE $372,490Active4 beds 2 baths2,188 sq. ft.
1907 Reveille Way, Terrell, TX 75160
MLS# 21116800Listed by: JEANETTE ANDERSON REAL ESTATE $375,490Active4 beds 2 baths2,364 sq. ft.
1917 Reveille Way, Terrell, TX 75160
MLS# 21116808Listed by: JEANETTE ANDERSON REAL ESTATE $384,490Active5 beds 3 baths2,660 sq. ft.
1909 Reveille Way, Terrell, TX 75160
MLS# 21116820Listed by: JEANETTE ANDERSON REAL ESTATE $349,490Active4 beds 2 baths2,088 sq. ft.
1913 Reveille Way, Terrell, TX 75160
MLS# 21116768Listed by: JEANETTE ANDERSON REAL ESTATE $359,490Active4 beds 2 baths2,141 sq. ft.
1905 Reveille Way, Terrell, TX 75160
MLS# 21116313Listed by: JEANETTE ANDERSON REAL ESTATE $139,999Active2 beds 1 baths784 sq. ft.
809 S Frances Street, Terrell, TX 75160
MLS# 21115532Listed by: REGAL, REALTORS $353,900Pending4 beds 3 baths2,054 sq. ft.
209 Southgate Drive, Terrell, TX 75160
MLS# 21138386Listed by: LGI HOMES- New
 $323,900Active4 beds 2 baths1,752 sq. ft.
207 North Island Drive, Terrell, TX 75160
MLS# 21191979Listed by: LGI HOMES  $239,000Active3 beds 2 baths1,482 sq. ft.
104 Elm Drive, Terrell, TX 75160
MLS# 21112031Listed by: LION DRIVE REALTY $799,000Active3 beds 3 baths2,460 sq. ft.
13426 County Road 2728, Terrell, TX 75161
MLS# 21110582Listed by: EXIT REALTY PRO $90,900Active0.95 Acres
n/a Fm-2578, Terrell, TX 75160
MLS# 21110417Listed by: B-21 REALTY COMPANY $254,900Active3 beds 2 baths1,659 sq. ft.
115 Pebble Creek Lane, Terrell, TX 75160
MLS# 21102599Listed by: EBBY HALLIDAY, REALTORS $245,000Active4 beds 2 baths1,393 sq. ft.
1826 Trailview Drive, Terrell, TX 75160
MLS# 21107319Listed by: MOVING TEXAS REALTY $335,000Active3 beds 2 baths1,918 sq. ft.
1221 S Rockwall Avenue, Terrell, TX 75160
MLS# 21104892Listed by: COLDWELL BANKER REALTY $183,000Active4 beds 4 baths1,792 sq. ft.
713 E College Street, Terrell, TX 75160
MLS# 21106854Listed by: DHS REALTY- $235,000Active3 beds 2 baths1,278 sq. ft.
101 Jackson Drive, Terrell, TX 75160
MLS# 21106412Listed by: REAL BROKER, LLC  $199,000Pending3 beds 2 baths1,216 sq. ft.
8450 N Fm 148, Terrell, TX 75160
MLS# 21103791Listed by: ULTIMA REAL ESTATE $55,000Pending0.16 Acres
TBD Thomas Street, Terrell, TX 75160
MLS# 21104105Listed by: RE/MAX LANDMARK ROSE $625,000Active3 beds 2 baths3,070 sq. ft.
502 Griffith Avenue, Terrell, TX 75160
MLS# 21102525Listed by: PINNACLE REALTY ADVISORS $465,900Active4 beds 4 baths2,713 sq. ft.
1157 Zajic Drive, Terrell, TX 75160
MLS# 21090711Listed by: PREMIER LEGACY REAL ESTATE LLC $475,000Active3 beds 2 baths2,631 sq. ft.
1377 Lone Star Boulevard, Talty, TX 75160
MLS# 21100482Listed by: KELLER WILLIAMS ROCKWALL $259,900Active3 beds 1 baths1,522 sq. ft.
119 Davidson Drive, Terrell, TX 75160
MLS# 21101120Listed by: OAKLEY REAL ESTATE, LLC $515,000Active4 beds 3 baths3,047 sq. ft.
1271 Lone Star Boulevard, Talty, TX 75160
MLS# 21100548Listed by: CENTURY 21 JUDGE FITE CO. $629,500Active3 beds 3 baths2,263 sq. ft.
8009 Wood Lane, Terrell, TX 75160
MLS# 21098330Listed by: EBBY HALLIDAY, REALTORS $290,000Active3 Acres
TBD 6251 Colquitt Road, Terrell, TX 75160
MLS# 21099867Listed by: DHS REALTY $194,150Active2 beds 2 baths1,120 sq. ft.
9123 Rodeo Drive, Terrell, TX 75160
MLS# 21099057Listed by: RAD REALTY GROUP LLC $415,000Active3 beds 2 baths1,920 sq. ft.
9972 County Road 2434, Terrell, TX 75160
MLS# 21097127Listed by: REGAL, REALTORS $790,000Active5.88 Acres
500 E Grove Street, Terrell, TX 75160
MLS# 21095592Listed by: KELLER WILLIAMS LONESTAR DFW $197,999Active3 beds 2 baths1,140 sq. ft.
904 N Virginia Street, Terrell, TX 75160
MLS# 21094228Listed by: DIVINE REALTY GROUP $49,900Active0.18 Acres
0 Hawkins, Terrell, TX 75160
MLS# 21090679Listed by: PRO-STAR REALTY LLC $265,000Pending3 beds 2 baths1,704 sq. ft.
105 Davidson Drive, Terrell, TX 75160
MLS# 21091378Listed by: OAKLEY REAL ESTATE, LLC $395,000Active3 beds 4 baths2,209 sq. ft.
101 Burnett Street, Terrell, TX 75160
MLS# 21086170Listed by: REGAL, REALTORS $576,500Active5 beds 2 baths2,882 sq. ft.
7719 County Road 272, Terrell, TX 75160
MLS# 21093734Listed by: UNITED REAL ESTATE DFW $314,500Active3 beds 2 baths1,705 sq. ft.
158 Poinsetta Circle, Terrell, TX 75160
MLS# 21090660Listed by: MILLER HOMES GROUP $495,000Active4 beds 4 baths2,927 sq. ft.
1001 W Remington Park Drive, Terrell, TX 75160
MLS# 21046609Listed by: MARK SPAIN REAL ESTATE $665,000Active5 beds 4 baths4,579 sq. ft.
893 Blue Heron Drive, Forney, TX 75126
MLS# 21090377Listed by: LOCAL REALTY AGENCY $650,000Pending3 beds 2 baths1,548 sq. ft.
10724 County Road 2458, Terrell, TX 75160
MLS# 21081895Listed by: EXIT REALTY PRO $288,800Active3 beds 2 baths1,520 sq. ft.
204 Tower Circle, Terrell, TX 75160
MLS# 21072064Listed by: EBBY HALLIDAY, REALTORS $324,900Active5 beds 3 baths2,432 sq. ft.
121 Redwood, Terrell, TX 75160
MLS# 21079651Listed by: KELLER WILLIAMS CENTRAL $330,000Active4 beds 2 baths2,300 sq. ft.
1107 Griffith Avenue, Terrell, TX 75160
MLS# 21057334Listed by: EXP REALTY $550,000Active3 beds 3 baths1,906 sq. ft.
7754 County Road 275, Terrell, TX 75160
MLS# 21072762Listed by: ENGEL & VOLKERS FRISCO $295,000Pending3 beds 2 baths1,626 sq. ft.
155 Lexington Drive, Terrell, TX 75160
MLS# 21081863Listed by: CENTURY 21 JUDGE FITE CO. $99,000Active2 beds 1 baths832 sq. ft.
926 S Frances Street, Terrell, TX 75160
MLS# 21066273Listed by: MALONE AND ASSOCIATES RE $174,000Active0.93 Acres
1008 S Virginia Avenue, Terrell, TX 75160
MLS# 21073074Listed by: ELITE TOWNSHIP PROPERTIES $499,990Active3 beds 2 baths1,772 sq. ft.
1307 Brent Avenue, Terrell, TX 75160
MLS# 21076228Listed by: COLDWELL BANKER APEX, REALTORS $2,332,000Active113.68 Acres
tbd N Fm-429 Road, Terrell, TX 75160
MLS# 21077242Listed by: RE/MAX LANDMARK $301,900Pending3 beds 2 baths1,425 sq. ft.
200 North Island Drive, Terrell, TX 75160
MLS# 21172191Listed by: LGI HOMES $302,900Active3 beds 2 baths1,603 sq. ft.
213 North Island Drive, Terrell, TX 75160
MLS# 21173110Listed by: LGI HOMES $569,999Active4 beds 3 baths2,620 sq. ft.
2921 W Alamosa Drive, Terrell, TX 75160
MLS# 21073233Listed by: CENTURY 21 JUDGE FITE CO.- New
 $323,900Active4 beds 2 baths1,752 sq. ft.
205 Southgate Drive, Terrell, TX 75160
MLS# 21191958Listed by: LGI HOMES  $210,000Active3 beds 1 baths1,128 sq. ft.
824 N Virginia Street, Terrell, TX 75160
MLS# 21072764Listed by: FOXY REAL ESTATE, LLC $75,000Active0.27 Acres
0 S Frances Street, Terrell, TX 75160
MLS# 21071986Listed by: ELITE TOWNSHIP PROPERTIES $254,900Active2 beds 2 baths1,526 sq. ft.
303 N Delphine Street, Terrell, TX 75160
MLS# 21062401Listed by: KELLER WILLIAMS ROCKWALL $353,500Active10.1 Acres
0000 County Road 2326, Terrell, TX 75160
MLS# 21067379Listed by: SCOTT KNOWLES COMPANY $530,600Active15.15 Acres
10236 County Road 2326, Terrell, TX 75160
MLS# 21067310Listed by: SCOTT KNOWLES COMPANY $349,000Active3 beds 2 baths1,732 sq. ft.
16806 Fm 3486, Terrell, TX 75160
MLS# 21061248Listed by: DIAMOND CUT REAL ESTATE $70,000Active0.22 Acres
119 Hackberry Street, Terrell, TX 75160
MLS# 21062512Listed by: WILLIAM DAVIS REALTY $50,000Pending0.14 Acres
305 Campbell Street, Terrell, TX 75160
MLS# 21062694Listed by: TEXAS PREMIER REALTY $340,000Active3.74 Acres
TBD Colquitt Road, Terrell, TX 75160
MLS# 21026779Listed by: PINNACLE REALTY ADVISORS $538,000Active4 beds 5 baths2,640 sq. ft.
16150 County Road 245, Terrell, TX 75160
MLS# 21046912Listed by: TEXAS PREMIER REALTY $145,000Active3 beds 1 baths1,196 sq. ft.
609 Bethlehem Street, Terrell, TX 75160
MLS# 21058090Listed by: AVRES REAL ESTATE $70,000Active0.16 Acres
1103 S Frances Street, Terrell, TX 75160
MLS# 21058653Listed by: WILLIAM DAVIS REALTY $2,500,000Active104.94 Acres
TBD Fm 3486, Terrell, TX 75160
MLS# 21034775Listed by: KELLER WILLIAMS ROCKWALL $80,000Active0.39 Acres
TBD Lot 3 West End Street, Terrell, TX 75160
MLS# 21055510Listed by: TEAM FORD REALTORS $80,000Active0.39 Acres
TBD Lot 4 West End Street, Terrell, TX 75160
MLS# 21055785Listed by: TEAM FORD REALTORS $265,000Active3 beds 2 baths1,617 sq. ft.
202 Campbell Street, Terrell, TX 75160
MLS# 21055269Listed by: CITIWIDE ALLIANCE REALTY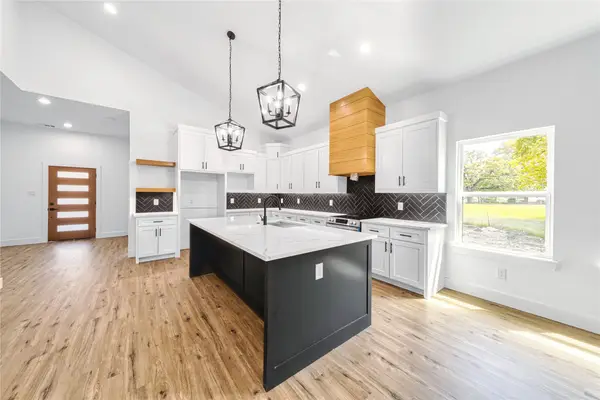 $343,995Pending4 beds 2 baths1,890 sq. ft.
607 W End, Terrell, TX 75160
MLS# 21048318Listed by: MONUMENT REALTY $250,000Pending3 beds 2 baths1,204 sq. ft.
13932 County Road 236, Terrell, TX 75160
MLS# 21041630Listed by: BLVD GROUP $292,900Active3 beds 2 baths1,316 sq. ft.
206 North Island Drive, Terrell, TX 75160
MLS# 21172232Listed by: LGI HOMES $294,900Active3 beds 2 baths1,425 sq. ft.
211 North Island Drive, Terrell, TX 75160
MLS# 21172240Listed by: LGI HOMES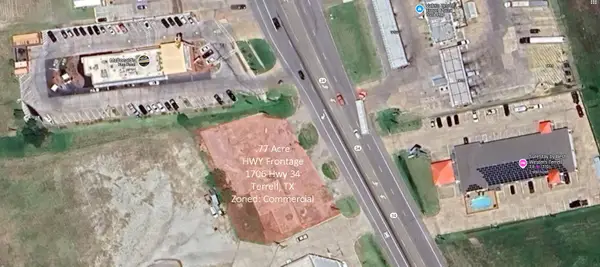 $175,000Pending0.77 Acres
1706 State Highway 34 S, Terrell, TX 75160
MLS# 21043832Listed by: MICHAEL CRANE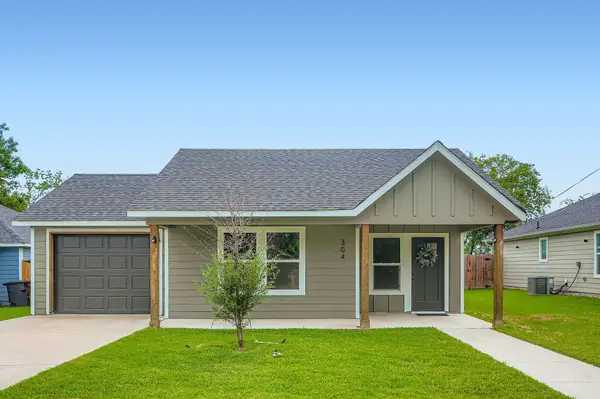 $229,900Active3 beds 2 baths1,609 sq. ft.
304 Thomas Street, Terrell, TX 75160
MLS# 21040033Listed by: MONUMENT REALTY $294,900Active3 beds 2 baths1,425 sq. ft.
205 North Island Drive, Terrell, TX 75160
MLS# 21172250Listed by: LGI HOMES $265,000Active4 beds 2 baths1,865 sq. ft.
149 Brushy Creek Lane, Terrell, TX 75160
MLS# 21037788Listed by: CENTURY 21 JUDGE FITE CO. $175,000Active4 Acres
0000 Fm Rd 1392, Terrell, TX 75160
MLS# 21039635Listed by: KELLER WILLIAMS ROCKWALL $1,182,600Active6.79 Acres
TBD Fm 2578 Road, Terrell, TX 75160
MLS# 21037005Listed by: RE/MAX LANDMARK $2,100,000Active54.87 Acres
2000 Colquitt Road, Terrell, TX 75160
MLS# 21029073Listed by: EXIT REALTY PRO $285,000Active8.5 Acres
TBD Colquitt Road, Terrell, TX 75160
MLS# 21026728Listed by: PINNACLE REALTY ADVISORS $225,000Active3 beds 2 baths1,486 sq. ft.
337 Town North Drive, Terrell, TX 75160
MLS# 21026640Listed by: LPT REALTY, LLC $260,000Pending5 beds 3 baths1,950 sq. ft.
314 Frank Street, Terrell, TX 75160
MLS# 21024892Listed by: HOMESMART $295,000Active3 beds 2 baths1,656 sq. ft.
108 Rock Creek Lane, Terrell, TX 75160
MLS# 21023819Listed by: COMPETITIVE EDGE REALTY LLC $399,990Active3.4 Acres
1180 Rose Hill Road, Terrell, TX 75160
MLS# 21023702Listed by: CLAYTON E. BENNETT $247,000Active3 beds 2 baths1,589 sq. ft.
413 Bethlehem Street, Terrell, TX 75160
MLS# 21134397Listed by: FIN REALTY $314,900Pending3 beds 2 baths1,814 sq. ft.
512 Frazier Street, Terrell, TX 75160
MLS# 21019350Listed by: JONES-PAPADOPOULOS & CO $173,900Active6.96 Acres
00 I 20, Terrell, TX 75160
MLS# 21017750Listed by: EXP REALTY LLC $424,000Active4 beds 3 baths2,835 sq. ft.
1200 E Remington Park Drive, Talty, TX 75160
MLS# 21015608Listed by: MINDI JACK PROPERTIES, LLC $62,999Active0.31 Acres
603 W Newton Street, Terrell, TX 75160
MLS# 21142347Listed by: RENDON REALTY, LLC $80,750Active0.39 Acres
1127 W End Street, Terrell, TX 75160
MLS# 21012868Listed by: EBBY HALLIDAY, REALTORS $479,990Active4 beds 4 baths2,813 sq. ft.
9713 Dahlia Boulevard, Mesquite, TX 75126
MLS# 21012729Listed by: DAVID M. WEEKLEY $825,000Active19.73 Acres
6479 County Road 276, Kaufman, TX 75142
MLS# 21154292Listed by: ELSIE HALBERT REAL ESTATE, LLC $795,000Active3 beds 3 baths2,517 sq. ft.
10206 County Road 2450, Terrell, TX 75160
MLS# 20978596Listed by: EXIT REALTY PINNACLE GROUP $373,900Pending5 beds 3 baths2,502 sq. ft.
102 Southgate Drive, Terrell, TX 75160
MLS# 21156758Listed by: LGI HOMES $2,950,000Active48.31 Acres
16914 Fm-429 Road, Terrell, TX 75160
MLS# 21146391Listed by: H&O INVESTMENTS, INC- $1,190,000Pending187 Acres
7100 Cr-301, Terrell, TX 75160
MLS# 20851577Listed by: ONE SOURCE REALTY  $205,000Active2 beds 1 baths992 sq. ft.
415 Maple Drive, Terrell, TX 75160
MLS# 20995147Listed by: RE/MAX LANDMARK $499,000Pending3 beds 2 baths2,723 sq. ft.
10747 County Road 2326, Terrell, TX 75160
MLS# 20998693Listed by: M&D REAL ESTATE $79,900Active0.26 Acres
420 Campbell Street, Terrell, TX 75160
MLS# 20993953Listed by: ULTIMA REAL ESTATE $1,000,000Active40 Acres
0 Fm 2578, Terrell, TX 75160
MLS# 20988825Listed by: DHS REALTY $320,000Active4 beds 3 baths1,917 sq. ft.
702 W Rochester Street, Terrell, TX 75160
MLS# 20989825Listed by: MONUMENT REALTY $287,900Pending3 beds 2 baths1,316 sq. ft.
109 Southgate Drive, Terrell, TX 75160
MLS# 21136284Listed by: LGI HOMES $287,900Active3 beds 2 baths1,316 sq. ft.
203 North Island Drive, Terrell, TX 75160
MLS# 21172224Listed by: LGI HOMES $53,500Active0.18 Acres
0 Hawkins Street, Terrell, TX 75160
MLS# 20976853Listed by: PRO-STAR REALTY LLC $125,000Active2 beds 1 baths1,014 sq. ft.
1000 E Brin Street, Terrell, TX 75160
MLS# 20980720Listed by: KELLER WILLIAMS ROCKWALL $145,000Active3 beds 1 baths1,044 sq. ft.
909 E High Street, Terrell, TX 75160
MLS# 20980675Listed by: KELLER WILLIAMS ROCKWALL $3,060,000Active12.23 Acres
00 Tanger Drive, Terrell, TX 75160
MLS# 20966887Listed by: RE/MAX LANDMARK $35,000Active0.11 Acres
207 S Ann Street, Terrell, TX 75160
MLS# 20977905Listed by: DECORATIVE REAL ESTATE $3,103,440Active51.72 Acres
10350 County Road 305, Terrell, TX 75160
MLS# 20977820Listed by: BERKSHIRE HATHAWAYHS PENFED TX $5,750,000Active220 Acres
5030 N Fm Rd 148, Crandall, TX 75114
MLS# 20976299Listed by: COMPASS RE TEXAS, LLC. $185,000Active3 beds 1 baths1,040 sq. ft.
109 Lydia Street, Terrell, TX 75160
MLS# 20973923Listed by: INC REALTY, LLC $55,000Active0.14 Acres
0 Boone Street, Terrell, TX 75160
MLS# 20973190Listed by: HOPKINS REALTY & ASSOC. LLC $60,000Active0.14 Acres
0 W Sparks Street, Terrell, TX 75160
MLS# 20973168Listed by: HOPKINS REALTY & ASSOC. LLC $500,000Active1.78 Acres
TBD Tanger Drive, Terrell, TX 75160
MLS# 20966840Listed by: RE/MAX LANDMARK $150,000Active2 beds 1 baths776 sq. ft.
605 S Ann Street, Terrell, TX 75160
MLS# 20968656Listed by: PROMISED LAND GROUP, LLC $599,700Active4 beds 3 baths2,753 sq. ft.
19335 Fm 1565, Terrell, TX 75160
MLS# 21144180Listed by: CROSS POWER REAL ESTATE, LLC $143,000Active1.04 Acres
540 Austin Circle #A, Rockwall, TX 75032
MLS# 20964998Listed by: COLDWELL BANKER APEX, REALTORS $143,000Active1.04 Acres
540 Austin Circle #B, Rockwall, TX 75032
MLS# 20965027Listed by: COLDWELL BANKER APEX, REALTORS $690,000Active4 beds 4 baths3,565 sq. ft.
1022 Foolish Pleasure Drive, Terrell, TX 75160
MLS# 20958277Listed by: FATHOM REALTY LLC $500,000Active12.24 Acres
TBD Colquitt Road, Terrell, TX 75160
MLS# 20956761Listed by: PINNACLE REALTY ADVISORS $299,400Pending2 beds 2 baths1,568 sq. ft.
15091 County Road 234, Terrell, TX 75160
MLS# 20953488Listed by: RTM REALTY $55,000Active0.19 Acres
108 Williams Street, Terrell, TX 75160
MLS# 21139590Listed by: JEANETTE ANDERSON REAL ESTATE $375,000Active10 Acres
TBD Quail Ln, Terrell, TX 75160
MLS# 20955771Listed by: EXALT REALTY $629,900Pending4 beds 3 baths3,215 sq. ft.
18227 Dakota Drive, Terrell, TX 75160
MLS# 20942182Listed by: BUILDERS REALTY $9,300,000Active30.5 Acres
0000 I-20, Terrell, TX 75126
MLS# 20938104Listed by: SPHERE REALTY, LLC $639,900Active4 beds 3 baths3,204 sq. ft.
18145 Osage Lane, Terrell, TX 75160
MLS# 20933334Listed by: BUILDERS REALTY $72,000Active0.28 Acres
0 Adelaide & Newton, Terrell, TX 75160
MLS# 20924422Listed by: NEXTHOME INTEGRITY GROUP- Open Fri, 11am to 5pm
 $559,990Active4 beds 5 baths3,841 sq. ft.
9721 Dahlia Boulevard, Mesquite, TX 75126
MLS# 20841355Listed by: HOMESUSA.COM  $709,999Active6 beds 5 baths4,522 sq. ft.
2412 W Alamosa Drive, Terrell, TX 75160
MLS# 21083234Listed by: COLDWELL BANKER APEX, REALTORS $340,000Active3 beds 2 baths1,908 sq. ft.
504 Stallings Street, Terrell, TX 75160
MLS# 21144742Listed by: SU KAZA REALTY, LLC- Open Fri, 12 to 5pm
 $499,998Active5 beds 5 baths3,077 sq. ft.
9801 Dahlia Boulevard, Mesquite, TX 75126
MLS# 20915747Listed by: CHESMAR HOMES - New
 $349,900Active4 beds 1 baths1,510 sq. ft.
14357 Fm 1392, Terrell, TX 75160
MLS# 21193571Listed by: DHS REALTY  $125,000Active2.28 Acres
46A-2 Pam Lane, Terrell, TX 75160
MLS# 20907672Listed by: EXP REALTY LLC $399,000Active4 beds 2 baths2,111 sq. ft.
16573 Cr 248, Terrell, TX 75160
MLS# 21027170Listed by: COMPETITIVE EDGE REALTY LLC
 $1,150,000Active4 beds 5 baths3,537 sq. ft.
8300 Willow Circle, Terrell, TX 75160
MLS# 20900613Listed by: CENTURY 21 JUDGE FITE CO. $640,000Active20.1 Acres
00 Fm-429, Terrell, TX 75160
MLS# 20896003Listed by: SPHERE REALTY $323,900Pending4 beds 2 baths1,752 sq. ft.
213 Southgate Drive, Terrell, TX 75160
MLS# 21173147Listed by: LGI HOMES- New
 $330,900Active4 beds 2 baths1,752 sq. ft.
200 Southgate Drive, Terrell, TX 75160
MLS# 21191972Listed by: LGI HOMES  $247,000Active2.08 Acres
540 Austin Circle, Rockwall, TX 75032
MLS# 21083169Listed by: COLDWELL BANKER APEX, REALTORS $149,500Pending2.75 Acres
8680 County Road 301 Road, Terrell, TX 75160
MLS# 20869202Listed by: CENTURY 21 MIKE BOWMAN, INC. $57,400Active0.17 Acres
610 Myers Street, Terrell, TX 75160
MLS# 21117559Listed by: LASHANDA JOHNSON $672,000Active3 beds 2 baths2,446 sq. ft.
1165 Brent Avenue, Terrell, TX 75160
MLS# 21090915Listed by: COMPASS RE TEXAS, LLC. $149,900Active3 beds 1 baths888 sq. ft.
1115 S Frances Street, Terrell, TX 75160
MLS# 20819368Listed by: ANDREW ARROYO REAL ESTATE INC. $40,000Active0.1 Acres
299 Crenshaw Street, Terrell, TX 75160
MLS# 20812699Listed by: FOXY REAL ESTATE, LLC $75,000Active0.14 Acres
104 Boone Street, Terrell, TX 75160
MLS# 20812671Listed by: FOXY REAL ESTATE, LLC $55,000Active0.17 Acres
405 College Md Road, Terrell, TX 75160
MLS# 20812713Listed by: FOXY REAL ESTATE, LLC $51,500Active0.18 Acres
TBD Mineral Wells Street, Terrell, TX 75160
MLS# 20801369Listed by: PRO-STAR REALTY LLC $245,000Active3 beds 2 baths1,477 sq. ft.
1802 Westgate Drive, Terrell, TX 75160
MLS# 20784311Listed by: FOXY REAL ESTATE, LLC $270,000Active6.06 Acres
0 Cr-283, Terrell, TX 75160
MLS# 21119367Listed by: THE GONZALES GROUP, LLC- New
 $600,000Active4 beds 3 baths2,649 sq. ft.
7710 Fall Creek Road, Terrell, TX 75160
MLS# 21187648Listed by: EPIQUE REALTY  $90,000Pending2.17 Acres
TBD Lot 21 Frank Street, Terrell, TX 75160
MLS# 20745529Listed by: FOXY REAL ESTATE, LLC $2,300,000Active12.66 Acres
10325 County Road 304, Terrell, TX 75160
MLS# 20739570Listed by: EBBY HALLIDAY REALTORS $629,900Active4 beds 3 baths2,740 sq. ft.
1166 Whirlaway, Terrell, TX 75160
MLS# 20740293Listed by: EXP REALTY $270,000Active6.12 Acres
0 Cr-237a, Terrell, TX 75160
MLS# 20738400Listed by: FOXY REAL ESTATE, LLC $145,000Active5 beds 2 baths2,944 sq. ft.
902 N Frances Street, Terrell, TX 75160
MLS# 20702696Listed by: EBBY HALLIDAY, REALTORS $335,000Active4 beds 3 baths2,034 sq. ft.
201 Dellis Street, Terrell, TX 75160
MLS# 21107349Listed by: COLDWELL BANKER REALTY $340,000Active5 beds 2 baths1,736 sq. ft.
8055 County Road #301, Terrell, TX 75160
MLS# 21133350Listed by: DHS REALTY $250,000Pending3 beds 2 baths1,254 sq. ft.
1412 S Medora Street, Terrell, TX 75160
MLS# 21135224Listed by: ULTRA REAL ESTATE SERVICES $510,000Pending30 Acres
8000 County Road 301, Terrell, TX 75160
MLS# 20019736Listed by: FATHOM REALTY LLC
Local realty services provided by:CENTURY 21 Judge Fite Company, CENTURY 21 Lucky Money Real Estate, CENTURY 21 North East
Information provided, in part, by North Texas Real Estate Information Systems, Inc. Last Updated March 9, 2026 Listings with the NTREIS logo are listed by brokerages other than CENTURY 21 Judge Fite Company.
Copyright 2026, Houston Realtors Information Service, Inc. All information provided is deemed reliable but is not guaranteed and should be independently verified. IDX information is provided exclusively for consumers' personal, non-commercial use, it may not be used for any purpose other than to identify prospective properties consumers may be interested in purchasing, and the data is deemed reliable but is not guaranteed accurate by the MLS.
Popular searches near 75160
Popular neighborhoods near 75160
- Buffalo Creek, Rockwall homes for sale
- Chandlers Landing, Rockwall homes for sale
- Creek Crossing Estates, Mesquite homes for sale
- Falcons Lair, Mesquite homes for sale
- Hickory Ridge, Rockwall homes for sale
- Lago Vista, Rockwall homes for sale
- Lake Ray Hubbard Estates, Rockwall homes for sale
- Lakeside Village, Rockwall homes for sale
- Lofland Farms, Rockwall homes for sale
- Meadowcreek Estates, Rockwall homes for sale
- Pecan Creek, Mesquite homes for sale
- Ridge Road Village, Rockwall homes for sale
- Rockwall Lake, Rockwall homes for sale
- Southside, Rockwall homes for sale
- Sunnyvale, Sunnyvale homes for sale
- Timber Creek Estates, Rockwall homes for sale
- Turtle Cove, Rockwall homes for sale
- Windmill Farms, Forney homes for sale
- Windmill Ridge Estates, Rockwall homes for sale
- Woodcreek, Rockwall homes for sale
Counties near Terrell, 75160
- Collin County homes for sale
- Dallas County homes for sale
- Delta County homes for sale
- Denton County homes for sale
- Ellis County homes for sale
- Fannin County homes for sale
- Franklin County homes for sale
- Grayson County homes for sale
- Henderson County homes for sale
- Hopkins County homes for sale
- Hunt County homes for sale
- Johnson County homes for sale
- Kaufman County homes for sale
- Navarro County homes for sale
- Rains County homes for sale
- Rockwall County homes for sale
- Smith County homes for sale
- Tarrant County homes for sale
- Van Zandt County homes for sale
- Wood County homes for sale
Protect your home and budget from life's surprises with an Assurant Home Warranty, backed by a partner that supports you through every step of homeownership. Explore Plans.
©2026 Century 21 Real Estate LLC. All rights reserved. CENTURY 21®, the CENTURY 21 Logo and C21® are service marks owned by Century 21 Real Estate LLC. Century 21 Real Estate LLC fully supports the principles of the Fair Housing Act and the Equal Opportunity Act. Each office is independently owned and operated. Listing information is deemed reliable but not guaranteed accurate.