Thayer, MO - homes for sale
31 of 31 results displayed
- New
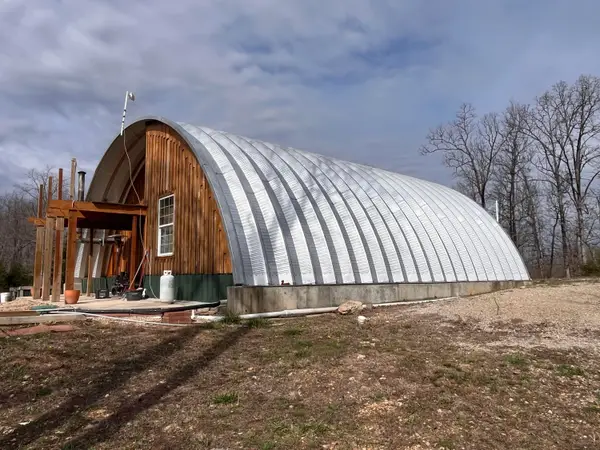 $169,900Active1 beds 1 baths1,008 sq. ft.
1170 County Road 255, Thayer, MO 65791
MLS# 60318888Listed by: MONARK REALTY 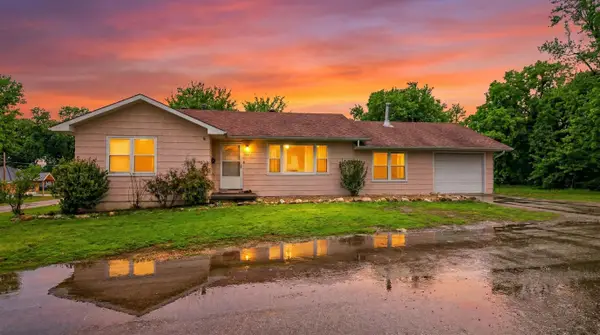 $155,000Active3 beds 2 baths1,422 sq. ft.
322 N 9th Street, Thayer, MO 65791
MLS# 60318197Listed by: UNITED COUNTRY-COZORT REALTY, INC.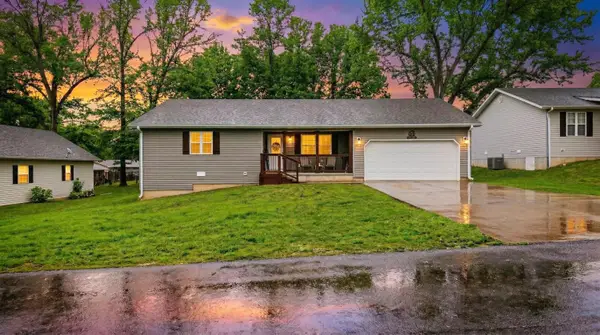 $225,000Pending3 beds 2 baths1,461 sq. ft.
443 Regina Avenue, Thayer, MO 65791
MLS# 60318193Listed by: UNITED COUNTRY-COZORT REALTY, INC. $197,000Active3 beds 2 baths1,400 sq. ft.
508 Monroe Street, Thayer, MO 65791
MLS# 26014871Listed by: PREFERRED REALTY
 $155,000Active3 beds 3 baths1,740 sq. ft.
903 Vine Street, Thayer, MO 65791
MLS# 60317939Listed by: CENTURY 21 COMBS & ASSOCIATES $125,000Active3 beds 2 baths1,177 sq. ft.
100 E Adams Street, Thayer, MO 65791
MLS# 60317248Listed by: UNITED COUNTRY-COZORT REALTY, INC.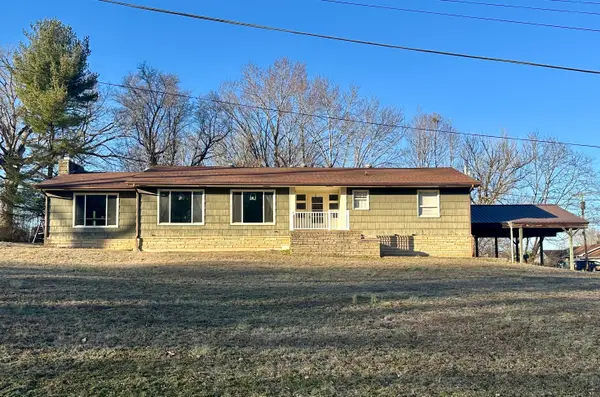 $214,900Active2 beds 2 baths1,969 sq. ft.
904 Race Street, Thayer, MO 65791
MLS# 60315676Listed by: WESTGATE REALTY INC $415,000Active3 beds 2 baths2,520 sq. ft.
312 Earl Street, Thayer, MO 65791
MLS# 60314338Listed by: UNITED COUNTRY-COZORT REALTY, INC.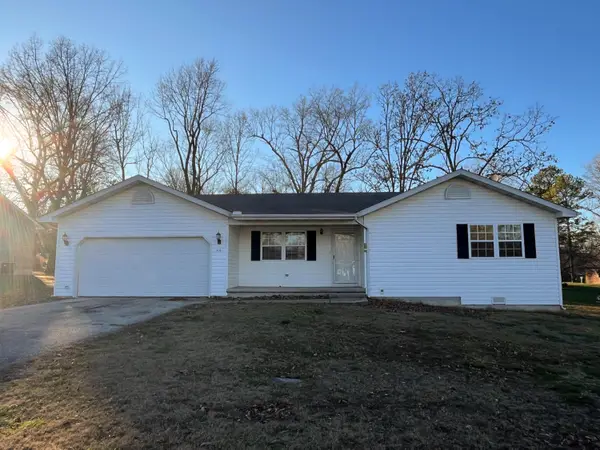 $215,000Active3 beds 2 baths1,656 sq. ft.
414 Regina Avenue, Thayer, MO 65791
MLS# 60314310Listed by: CENTURY 21 COMBS & ASSOCIATES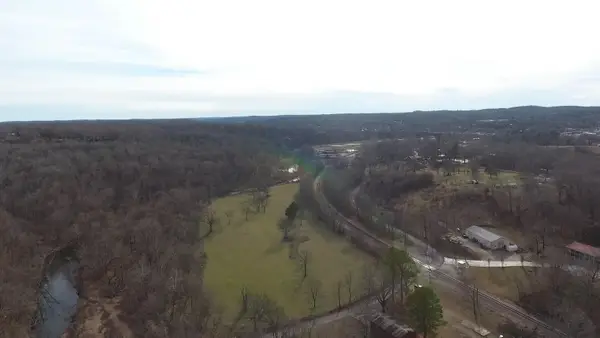 $230,000Active17.4 Acres
000 County Road 268, Thayer, MO 65791
MLS# 60313045Listed by: CENTURY 21 COMBS & ASSOCIATES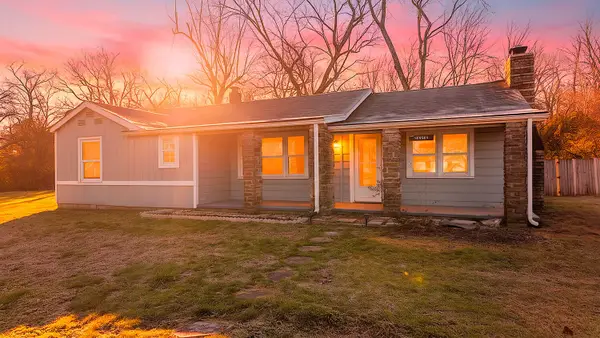 $120,000Pending3 beds 2 baths1,345 sq. ft.
703 Sunset Drive, Thayer, MO 65791
MLS# 60312764Listed by: UNITED COUNTRY-COZORT REALTY, INC.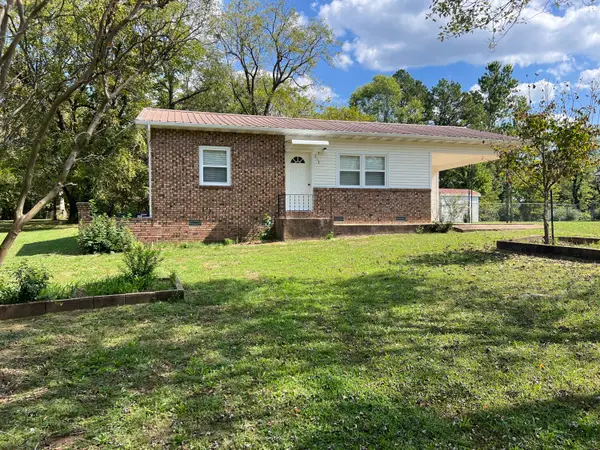 $124,900Active2 beds 1 baths852 sq. ft.
431 Leah, Thayer, MO 65791
MLS# 60311886Listed by: UNITED COUNTRY-COZORT REALTY, INC. $769,900Active4 beds 3 baths3,128 sq. ft.
710 County Road 328, Thayer, MO 65791
MLS# 60311820Listed by: PRIME REAL ESTATE GROUP $275,000Active4 beds 2 baths1,831 sq. ft.
667 County Road 364, Thayer, MO 65791
MLS# 60311400Listed by: UNITED COUNTRY-COZORT REALTY, INC. $1,490,000Active2 beds 2 baths1,930 sq. ft.
3156 County Road 219, Thayer, MO 65791
MLS# 60313583Listed by: KELLER WILLIAMS LOCAL $35,000Active0.68 Acres
000 N 9th Street, Thayer, MO 65791
MLS# 60310329Listed by: UNITED COUNTRY-COZORT REALTY, INC. $96,000Pending1 beds 1 baths732 sq. ft.
211 S 6th Street, Thayer, MO 65791
MLS# 60309290Listed by: UNITED COUNTRY-COZORT REALTY, INC. $7,500Active0.12 Acres
Tbd Gracey Avenue, Thayer, MO 65791
MLS# 60308956Listed by: UNITED COUNTRY-COZORT REALTY, INC.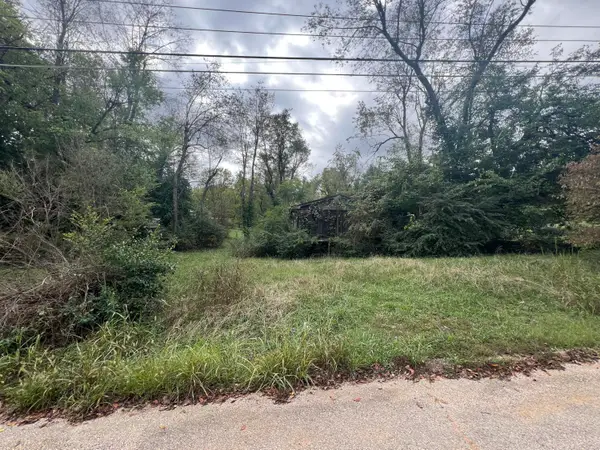 $10,000Active0.38 Acres
619 Poplar Street, Thayer, MO 65791
MLS# 60306649Listed by: MONARK REALTY $135,000Active3 beds 2 baths1,457 sq. ft.
445 Monroe Street, Thayer, MO 65791
MLS# 60299123Listed by: CENTURY 21 COMBS & ASSOCIATES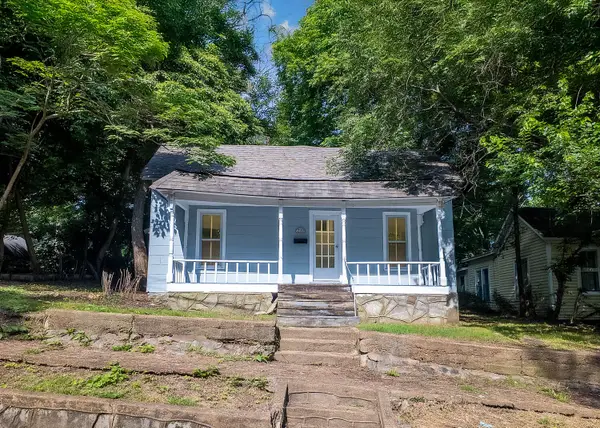 $65,000Pending2 beds 1 baths1,032 sq. ft.
220 South 3rd Street, Thayer, MO 65791
MLS# 60297254Listed by: UNITED COUNTRY-COZORT REALTY, INC. $18,900Active0.25 Acres
214 Sherman Street, Thayer, MO 65791
MLS# 60296901Listed by: CENTURY 21 OZARK HILLS REALTY, INC.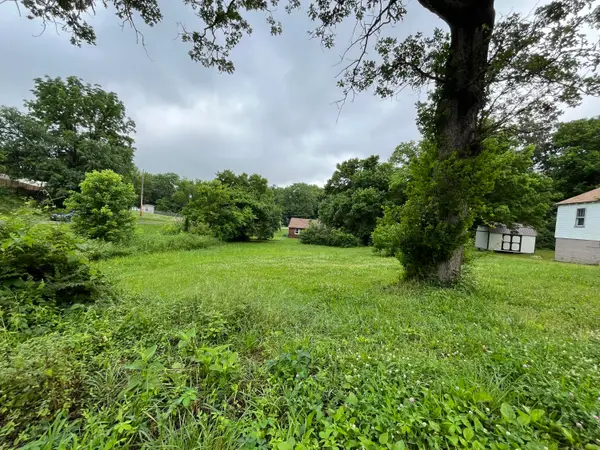 $10,000Active0.49 Acres
Tbd North 5th Street, Thayer, MO 65791
MLS# 60296647Listed by: UNITED COUNTRY-COZORT REALTY, INC. $99,000Active2 beds 1 baths862 sq. ft.
222 Poplar Street, Thayer, MO 65791
MLS# 60295199Listed by: UNITED COUNTRY-COZORT REALTY, INC. $185,000Active3 beds 1 baths1,232 sq. ft.
920 Oak Street, Thayer, MO 65791
MLS# 60312681Listed by: UNITED COUNTRY-COZORT REALTY, INC.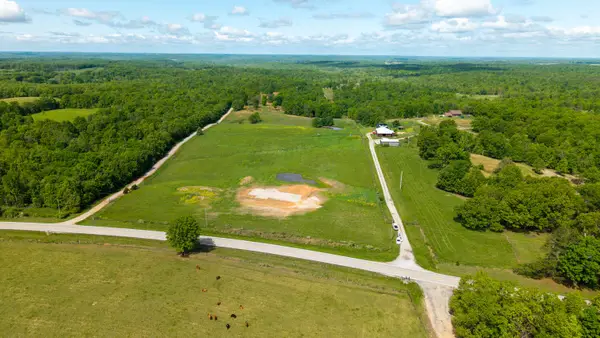 $75,000Active7.84 Acres
Tbd Mo-19, Thayer, MO 65791
MLS# 60293938Listed by: UNITED COUNTRY-COZORT REALTY, INC. $549,900Active4 beds 4 baths2,804 sq. ft.
101 Cave Creek Road, Thayer, MO 65791
MLS# 60292712Listed by: RE/MAX REAL ESTATE EXCHANGE $199,900Active3 beds 2 baths1,900 sq. ft.
848 Chestnut Street, Thayer, MO 65791
MLS# 60292455Listed by: MONARK REALTY $82,500Pending2 beds 1 baths928 sq. ft.
512 N 9th Street, Thayer, MO 65791
MLS# 60263110Listed by: UNITED COUNTRY-COZORT REALTY, INC. $15,900Pending1 beds 1 baths396 sq. ft.
407 Alton Road, Thayer, MO 65791
MLS# 60254338Listed by: USREALTY.COM, LLP $175,000Pending4 beds 3 baths2,464 sq. ft.
906 Vine Street, Thayer, MO 65791
MLS# 60252625Listed by: UNITED COUNTRY-COZORT REALTY, INC.
Local realty services provided by:CENTURY 21 Combs & Associates Real Estate, CENTURY 21 Bailey & Co.
Copyright 2026 Southern Missouri MLS. All rights reserved. Listings courtesy of Southern Missouri MLS as distributed by MLS GRID <Last Updated November 22, 2023. Southern Missouri MLS provides content displayed here (“provided content”) on an “as is” basis and makes no representations or warranties regarding the provided content, including, but not limited to those of non-infringement, timeliness, accuracy, or completeness. Individuals and companies using information presented are responsible for verification and validation of information they utilize and present to their customers and clients. Southern Missouri MLS will not be liable for any damage or loss resulting from use of the provided content or the products available through Portals, IDX, VOW, and/or Syndication. Recipients of this information shall not resell, redistribute, reproduce, modify, or otherwise copy any portion thereof without the expressed written consent of Southern Missouri MLS
Copyright 2026 Mid-America Regional Information Systems. All rights reserved. Listings courtesy of Mid-America Regional Information Systems as distributed by MLS GRID <Last Updated March 27, 2026. Mid-America Regional Information Systems provides content displayed here (“provided content”) on an “as is” basis and makes no representations or warranties regarding the provided content, including, but not limited to those of non-infringement, timeliness, accuracy, or completeness. Individuals and companies using information presented are responsible for verification and validation of information they utilize and present to their customers and clients. Mid-America Regional Information Systems will not be liable for any damage or loss resulting from use of the provided content or the products available through Portals, IDX, VOW, and/or Syndication. Recipients of this information shall not resell, redistribute, reproduce, modify, or otherwise copy any portion thereof without the expressed written consent of Mid-America Regional Information Systems.
Neighborhoods near Thayer, MO
Zip codes near Thayer, MO
- 63942 homes for sale
- 65606 homes for sale
- 65692 homes for sale
- 65775 homes for sale
- 65778 homes for sale
- 65788 homes for sale
- 65791 homes for sale
- 72459 homes for sale
- 72460 homes for sale
- 72478 homes for sale
- 72482 homes for sale
- 72512 homes for sale
- 72513 homes for sale
- 72520 homes for sale
- 72529 homes for sale
- 72539 homes for sale
- 72542 homes for sale
- 72554 homes for sale
- 72576 homes for sale
- 72583 homes for sale
Popular searches near Thayer, MO
- Afton homes for sale
- Alton homes for sale
- Big Apple homes for sale
- Camp homes for sale
- Cherokee homes for sale
- Cherokee Village homes for sale
- Couch homes for sale
- Hardy homes for sale
- Jeff homes for sale
- Koshkonong homes for sale
- Mammoth Spring homes for sale
- Mammoth Spring Township homes for sale
- Myatt homes for sale
- Myatt homes for sale
- Myrtle homes for sale
- Piney homes for sale
- Pleasant Ridge homes for sale
- South Fork homes for sale
- Thayer Township homes for sale
- Upper North homes for sale
Protect your home and budget from life's surprises with an Assurant Home Warranty, backed by a partner that supports you through every step of homeownership. Explore Plans.
©2026 Century 21 Real Estate LLC. All rights reserved. CENTURY 21®, the CENTURY 21 Logo and C21® are service marks owned by Century 21 Real Estate LLC. Century 21 Real Estate LLC fully supports the principles of the Fair Housing Act and the Equal Opportunity Act. Each office is independently owned and operated. Listing information is deemed reliable but not guaranteed accurate.