- Boyle Heights, Los Angeles homes for sale
- Bunker Hill, Los Angeles homes for sale
- Chinatown, Los Angeles homes for sale
- City Terrace, Los Angeles homes for sale
- Cypress Park, Los Angeles homes for sale
- Downtown, Los Angeles homes for sale
- El Sereno, Los Angeles homes for sale
- Elysian Park, Los Angeles homes for sale
- Gallery Row, Los Angeles homes for sale
- Granada Park, Alhambra homes for sale
- Little Toyko, Los Angeles homes for sale
- Maravilla, Los Angeles homes for sale
- Montecito Heights, Los Angeles homes for sale
- Skid Row, Los Angeles homes for sale
- The Arts District, Los Angeles homes for sale
- The Broadway Theater District, Los Angeles homes for sale
- The Fashion District, Los Angeles homes for sale
- The Financial District, Los Angeles homes for sale
- The Historic Core, Los Angeles homes for sale
- West Shorb, Alhambra homes for sale
The Eastside, Los Angeles, CA - homes for sale
300 of 576 results displayed
- Coming Soon
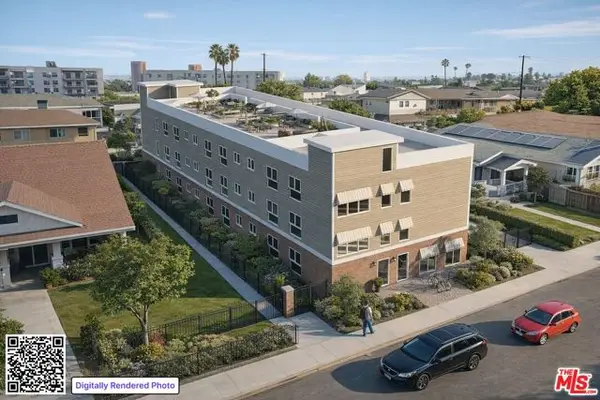
 $777,777Coming Soon2 beds 1 baths
705 Bradshawe, Los Angeles, CA 90022
MLS# OC26066435Listed by: REAL BROKER - New
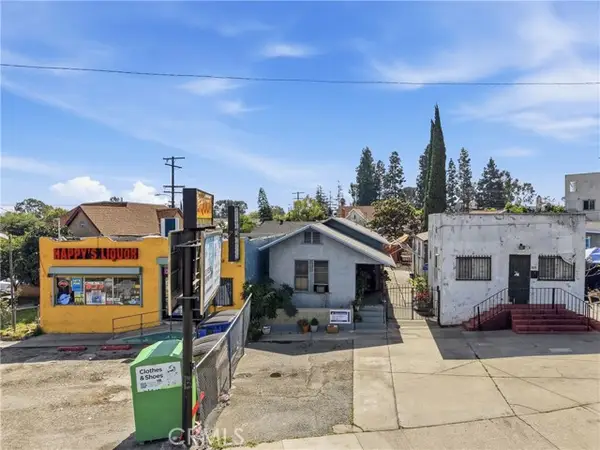
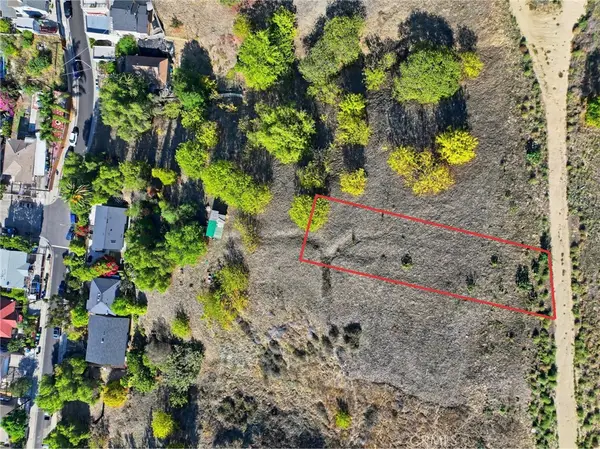
 $385,000Active0.17 Acres
3855 Randolph, Los Angeles, CA 90032
MLS# CV26068971Listed by: TREVINO PROPERTIES, INC. - New
 $799,000Active5 beds 3 baths2,177 sq. ft.
156 N Hicks, Los Angeles, CA 90063
MLS# DW26066894Listed by: KELLER WILLIAMS SELA - New
 $699,900Active5 beds -- baths1,432 sq. ft.
1153 S Record Avenue, Los Angeles, CA 90023
MLS# CRCV26052854Listed by: REALTY MASTERS & ASSOCIATES - New
 $699,900Active-- beds -- baths1,432 sq. ft.
1153 S Record Avenue, Los Angeles, CA 90023
MLS# CV26052854Listed by: REALTY MASTERS & ASSOCIATES - New
 $1,300,000Active4 beds 4 baths2,330 sq. ft.
654 S Soto St, Los Angeles, CA 90023
MLS# WS26068452Listed by: ELPIS REALTY INC - New
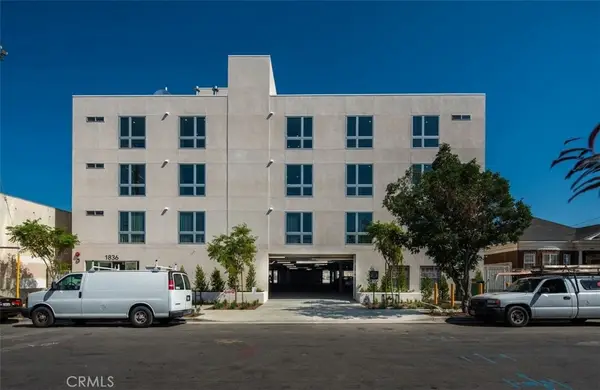 $14,990,000Active-- beds -- baths35,511 sq. ft.
1836 Sichel #27, Los Angeles, CA 90031
MLS# AR26068285Listed by: PINNACLE REAL ESTATE GROUP - New
 $445,000Active0.11 Acres
4905 E Seldner, Los Angeles, CA 90032
MLS# GD26067961Listed by: ENGEL & VOLKERS LA CANADA - Open Sat, 11am to 2pmNew
 $600,000Active3 beds 2 baths1,020 sq. ft.
2823 E 6th, Los Angeles, CA 90023
MLS# CV26065147Listed by: KALEO REAL ESTATE COMPANY - New
 $670,000Active6 beds 3 baths1,794 sq. ft.
214 N Alma Avenue, Los Angeles, CA 90063
MLS# 26671313Listed by: CIRCLE REAL ESTATE - New
 $385,000Active0.13 Acres
3636 Harriman Avenue, Los Angeles, CA 90032
MLS# CL26670815Listed by: REAL ESTATE EBROKER INC. - New
 $1,200,000Active-- beds -- baths1,920 sq. ft.
801 N Marianna, East Los Angeles, CA 90063
MLS# TR26066607Listed by: NEW CENTURY HOMES - New
 $609,900Active2 beds 1 baths864 sq. ft.
3970 Strang Street, Los Angeles, CA 90063
MLS# CRIV26066265Listed by: THE MORTGAGE PROS FUNDING, INC - New
 $675,000Active4 beds -- baths1,680 sq. ft.
4173 Hubbard Street, Los Angeles, CA 90023
MLS# CRMB26066472Listed by: UNITED BROKERS REALTY - New
 $169,000Active0.25 Acres
3232 Marengo, City Terrace, CA 90063
MLS# MB26066690Listed by: CENTURY 21 REALTY MASTERS - New
 $550,000Active5 beds 2 baths1,540 sq. ft.
4636 E 2nd St, Los Angeles, CA 90022
MLS# 260007235Listed by: KAM FINANCIAL REALTY - New
 $939,000Active3 beds 3 baths
811 S Gage Avenue, Los Angeles, CA 90023
MLS# DW26065187Listed by: KELLER WILLIAMS SELA - New
 $38,000Active0.14 Acres
2625 Forest Park Drive, Los Angeles, CA 90032
MLS# CL26669723Listed by: KELLER WILLIAMS BEVERLY HILLS - New
 $1,225,000Active0.21 Acres
3548 Sabina Street, Los Angeles, CA 90023
MLS# CL26670061Listed by: MARCUS & MILLICHAP - New
 $410,000Active2 beds 1 baths846 sq. ft.
3878 E 1st, Los Angeles, CA 90063
MLS# CRMB26066042Listed by: REALTY WORLD CALIFORNIA AGENTS - New
 $829,000Active4 beds -- baths1,992 sq. ft.
3817 Drysdale, Los Angeles, CA 90032
MLS# CRSR26065631Listed by: SKYLER REALTY - Open Sat, 2 to 4pmNew
 $695,000Active-- beds 1 baths691 sq. ft.
3682 Harriman Avenue #1, El Sereno, CA 90032
MLS# AR26065856Listed by: KELLER WILLIAMS REALTY - New
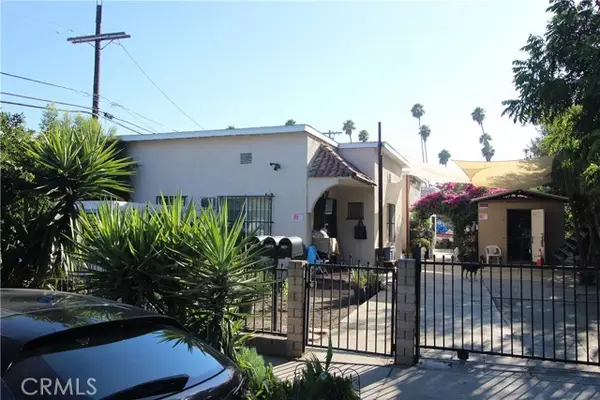
 $650,000Active2 beds -- baths1,396 sq. ft.
830 N Humphreys Avenue, East Los Angeles, CA 90022
MLS# CRP1-26442Listed by: NORM HALEY REAL ESTATE - New
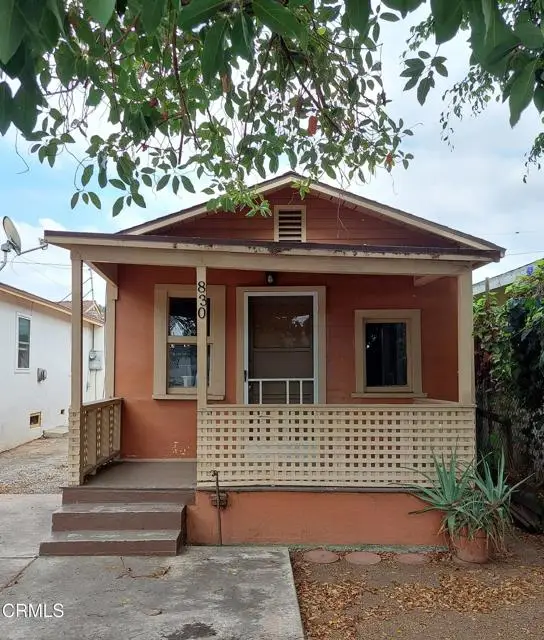
 $739,900Active4 beds 2 baths2,150 sq. ft.
462 Camulos Street, Los Angeles, CA 90033
MLS# PW26064347Listed by: WEDGEWOOD HOMES REALTY - Open Sat, 2 to 4pmNew
 $1,450,000Active3 beds 4 baths1,653 sq. ft.
3682 Harriman Avenue #2, El Sereno, CA 90032
MLS# AR26065181Listed by: KELLER WILLIAMS REALTY - Open Sat, 2 to 4pmNew
 $1,245,000Active2 beds 3 baths1,578 sq. ft.
3682 Harriman Avenue #3, El Sereno, CA 90032
MLS# AR26065730Listed by: KELLER WILLIAMS REALTY - New
 $795,000Active3 beds 2 baths1,421 sq. ft.
4915 Gambier Street, Los Angeles, CA 90032
MLS# 26669663Listed by: KELLER WILLIAMS BEVERLY HILLS - Open Sat, 11am to 2pmNew
 $600,000Active3 beds 2 baths1,020 sq. ft.
2823 E 6th, Los Angeles, CA 90023
MLS# CV26065147Listed by: KALEO REAL ESTATE COMPANY - New
 $775,900Active3 beds 2 baths1,480 sq. ft.
2626 Commodore, Los Angeles, CA 90032
MLS# DW26060728Listed by: STONEWOOD REALTY GROUP INC. - New
 $828,000Active4 beds 4 baths
3559 E 4th, Los Angeles, CA 90063
MLS# PW26060880Listed by: T.N.G. REAL ESTATE CONSULTANTS - New
 $399,999Active0.19 Acres
1623 E 1st Street, Los Angeles, CA 90033
MLS# SR26062876Listed by: LANDON REALTY GROUP - New
 $69,999Active0.21 Acres
2921 Thomas Street, Los Angeles, CA 90034
MLS# SR26062882Listed by: LANDON REALTY GROUP - New
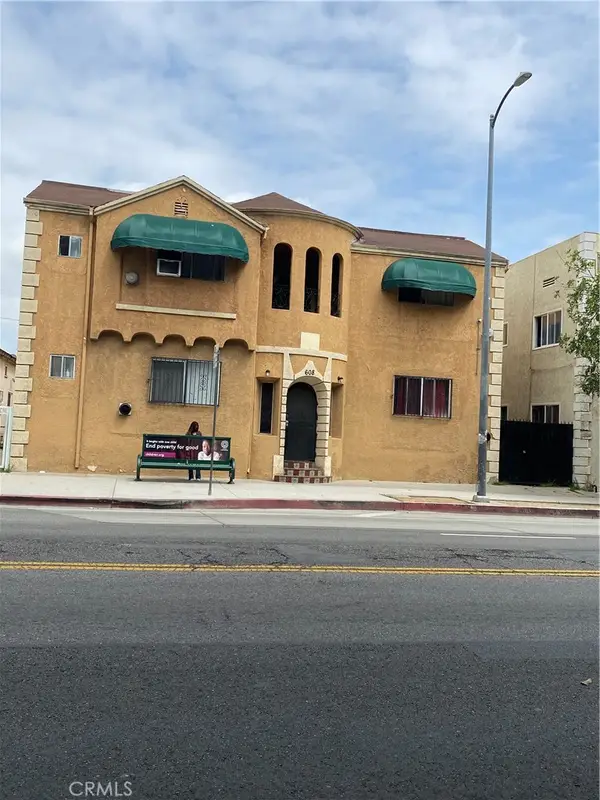 $2,495,000Active-- beds -- baths10,431 sq. ft.
608 N Soto, Los Angeles, CA 90033
MLS# WS26064948Listed by: CALIFORNIA HOUSES - New
 $850,000Active5 beds -- baths1,683 sq. ft.
1091 N Gage Avenue, Los Angeles, CA 90063
MLS# CL26669263Listed by: COMPASS - New
 $1,000,000Active4 beds 4 baths
5116 Huntington South, Los Angeles, CA 90032
MLS# WS26060939Listed by: GRANADA KNOLL REALTY - New
 $385,000Active0.12 Acres
2849 Adkins Avenue, Los Angeles, CA 90032
MLS# CV26064298Listed by: HERMAN LEE, BROKER - New
 $899,000Active3 beds 2 baths1,060 sq. ft.
5245 Coney Road, Los Angeles, CA 90032
MLS# CRP1-26396Listed by: AVIDA & ASSOCIATES - New
 $699,000Active2 beds 1 baths857 sq. ft.
4612 E 2nd, East Los Angeles, CA 90022
MLS# CRCV26063202Listed by: REMAX FOOTHILLS - New
 $999,900Active-- beds -- baths1,676 sq. ft.
2500 E Fairmount, Los Angeles, CA 90033
MLS# DW26063579Listed by: CENTURY 21 ALLSTARS - New
 $32,900Active0.18 Acres
0 Near Paradise Dr, Los Angeles, CA 90063
MLS# CRSR26062164Listed by: PINNACLE ESTATE PROPERTIES, INC. - New
 $32,900Active0 Acres
0 Near Paradise Dr, El Sereno, CA 90063
MLS# SR26062164Listed by: PINNACLE ESTATE PROPERTIES, INC. - New
 $699,888Active5 beds 3 baths
3016 Inez, Los Angeles, CA 90023
MLS# CV26060403Listed by: NEST REAL ESTATE - New
 $625,000Active2 beds 2 baths900 sq. ft.
2517 Eastlake Avenue, Los Angeles, CA 90031
MLS# CL26667273Listed by: COMPASS - New
 $250,000Active0.15 Acres
3341 Floral Drive, Los Angeles, CA 90063
MLS# CL26667593Listed by: GLOBAL PLATINUM PROPERTIES, INC. - New
 $1,035,000Active2 beds 3 baths1,165 sq. ft.
3682 Harriman Avenue #4, Los Angeles, CA 90032
MLS# CRAR26059199Listed by: KELLER WILLIAMS REALTY - New
 $200,000Active0.13 Acres
3611 Meisner Street, Los Angeles, CA 90063
MLS# CRP1-26357Listed by: KELLER WILLIAMS REALTY - New
 $350,000Active0.13 Acres
1031 N Rowan Avenue, Los Angeles, CA 90063
MLS# CRP1-26358Listed by: KELLER WILLIAMS REALTY  $1,100,000Active2 beds -- baths2,256 sq. ft.
601 S Record Avenue, Los Angeles, CA 90023
MLS# CRPW26061188Listed by: REAL BROKERAGE TECHNOLOGIES $1,599,900Active8 beds -- baths4,796 sq. ft.
318 Cornwell, Los Angeles, CA 90033
MLS# CRSR26060822Listed by: RE/MAX ONE $725,000Active0.15 Acres
2807 N Thomas, Los Angeles, CA 90031
MLS# CROC26058088Listed by: EXP REALTY OF CALIFORNIA INC $619,950Active3 beds 2 baths952 sq. ft.
3043 Winter Street, Los Angeles, CA 90063
MLS# CL26666043Listed by: COMPASS $1,125,000Active3 beds -- baths4,307 sq. ft.
434 E Avenue 28, Los Angeles, CA 90031
MLS# CRBB26060288Listed by: EMPOWER REAL ESTATE $1,200,000Active-- beds -- baths3,332 sq. ft.
409 S Savannah, Los Angeles, CA 90033
MLS# MB26053077Listed by: CENTURY 21 REALTY MASTERS $1,095,000Active4 beds -- baths2,836 sq. ft.
2236 Griffin Avenue, Los Angeles, CA 90031
MLS# CL26666763Listed by: REAL BROKER $799,000Active2 beds 1 baths1,367 sq. ft.
116 W Avenue 31, Los Angeles, CA 90031
MLS# CL26666759Listed by: COMPASS $779,000Active5 beds 3 baths1,692 sq. ft.
3259 E 2nd Street, Los Angeles, CA 90063
MLS# 26665555Listed by: EXP REALTY OF CALIFORNIA INC $999,000Active3 beds 2 baths1,010 sq. ft.
2645 Onyx Drive, Los Angeles, CA 90032
MLS# CL26665991Listed by: SOTHEBY'S INTERNATIONAL REALTY $899,000Active2 beds 2 baths1,170 sq. ft.
3319 Minto Court, Los Angeles, CA 90032
MLS# CL26666785Listed by: ACME REAL ESTATE $482,000Active1 beds 1 baths490 sq. ft.
2340 THOMAS STREET, Los Angeles, CA 90031
MLS# 202602946Listed by: MISSION REAL ESTATE $950,000Active6 beds -- baths2,162 sq. ft.
565 Margaret Avenue, Los Angeles, CA 90022
MLS# CRAR26058814Listed by: KEYSTAR REALTY- Open Sat, 1 to 4pm
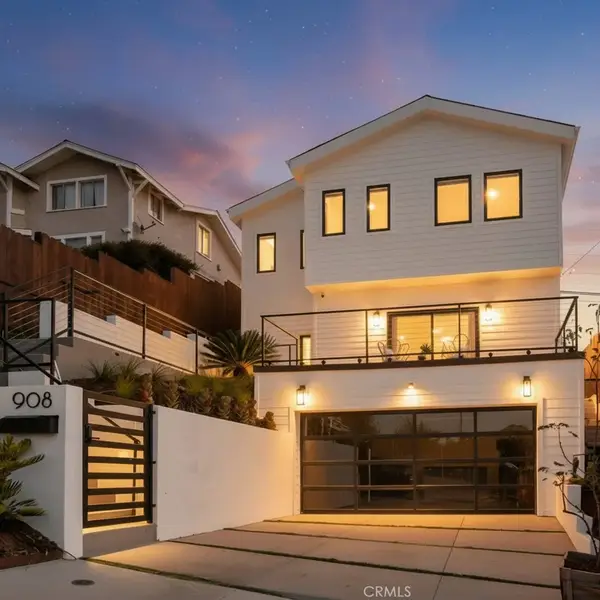 $999,999Active3 beds 3 baths1,665 sq. ft.
908 N Gage Avenue, Los Angeles, CA 90063
MLS# CV26059697Listed by: STRIVE REAL ESTATE  $2,300,000Active8 beds 14 baths7,607 sq. ft.
1909 N Broadway, Los Angeles, CA 90031
MLS# 26666077Listed by: MARCUS & MILLICHAP $899,950Active3 beds 2 baths970 sq. ft.
5013 O Sullivan, Los Angeles, CA 90032
MLS# DW26059400Listed by: CENTURY 21 REALTY MASTERS $550,000Active2 beds 1 baths696 sq. ft.
1270 S Indiana, East Los Angeles, CA 90023
MLS# MB26059312Listed by: CENTURY 21 REALTY MASTERS- New
 $1,449,000Active4 beds 5 baths2,418 sq. ft.
3803 S Verona Court, Los Angeles, CA 90066
MLS# CL26669987Listed by: LPT REALTY, INC 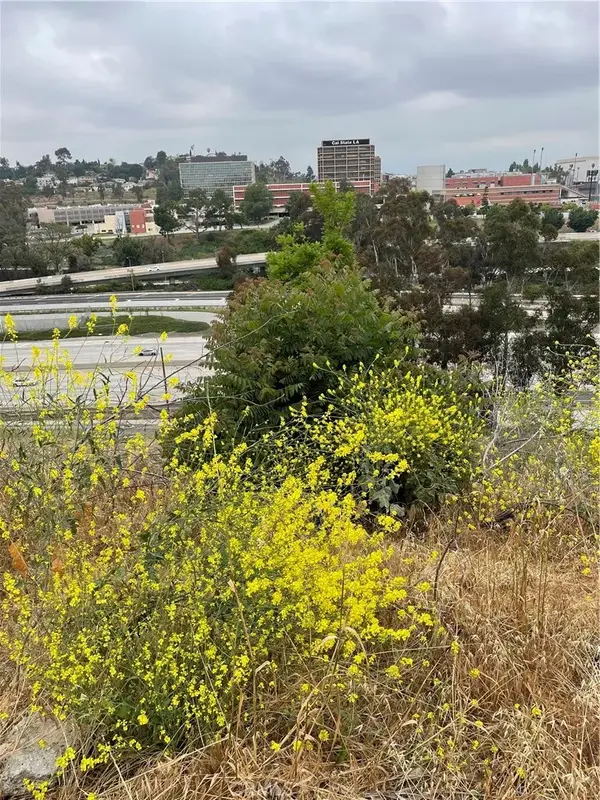 $75,000Active0 Acres
4433 Hayes, Los Angeles, CA 90063
MLS# DW26055251Listed by: RESOLUTION BROKERS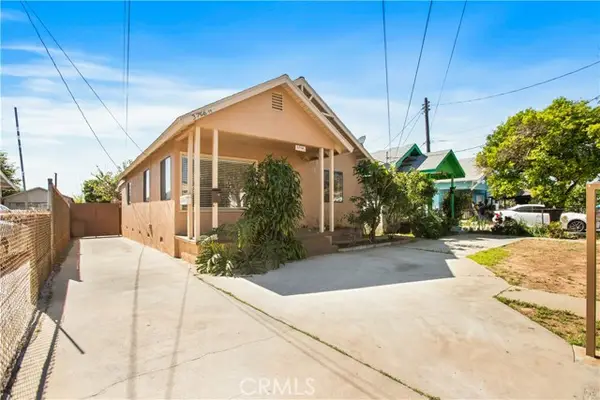 $850,000Pending7 beds -- baths2,624 sq. ft.
3752 E 6th, Los Angeles, CA 90023
MLS# CRTR26049176Listed by: MONARCH REAL ESTATE SERVICES $100,000Active0.36 Acres
2750 Paradise, Los Angeles, CA 90032
MLS# CRHD26058263Listed by: BANCORP ONE, INC. $639,900Active3 beds 1 baths898 sq. ft.
453 S Bernal Avenue, Los Angeles, CA 90063
MLS# DW26053563Listed by: UNITED REAL ESTATE PACIFIC STATES $935,888Active3 beds 2 baths1,575 sq. ft.
2810 Beryl, Los Angeles, CA 90032
MLS# OC26051989Listed by: PACIFIC SOTHEBY'S INT'L REALTY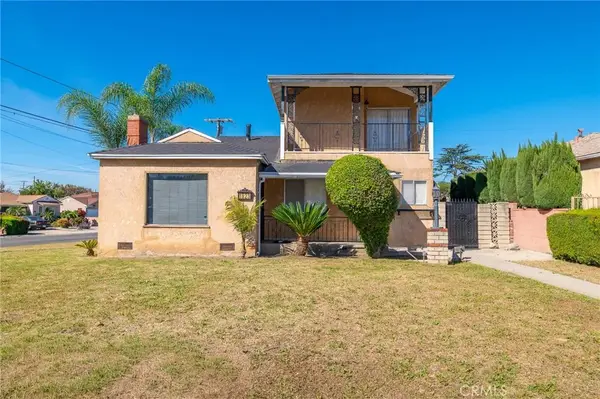 $848,999Active3 beds 2 baths1,306 sq. ft.
1823 N Rowan, Los Angeles, CA 90032
MLS# PW26057321Listed by: NEXTGEN PROPERTIES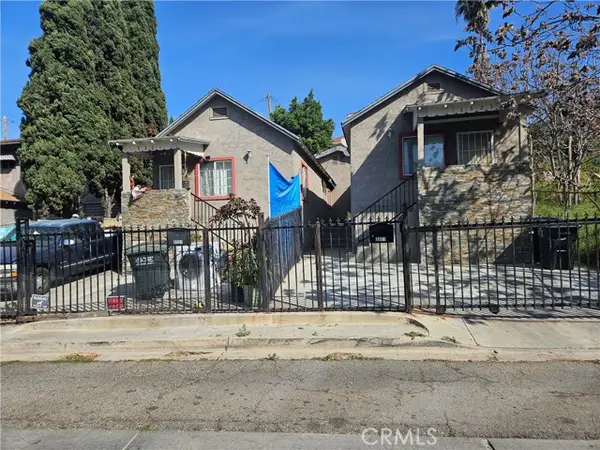 $779,000Pending4 beds -- baths1,932 sq. ft.
3321 Malabar, East Los Angeles, CA 90063
MLS# CRSB26057248Listed by: NEW STAR REALTY & INVESTMENT $1,220,000Active6 beds 3 baths2,744 sq. ft.
133 S Mathews, Los Angeles, CA 90033
MLS# CRDW26056654Listed by: ODYSSEY REALTY GROUP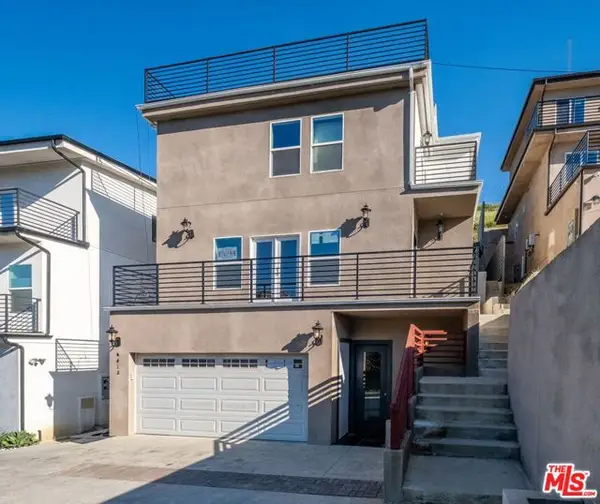 $1,269,900Active6 beds 6 baths2,750 sq. ft.
4418 Bowman Boulevard, Los Angeles, CA 90032
MLS# CL26661435Listed by: COLDWELL BANKER REALTY- Open Fri, 5 to 7pm
 $799,000Active2 beds 2 baths948 sq. ft.
1920 Del Paso, Los Angeles, CA 90032
MLS# PF26055584Listed by: BOT REAL ESTATE 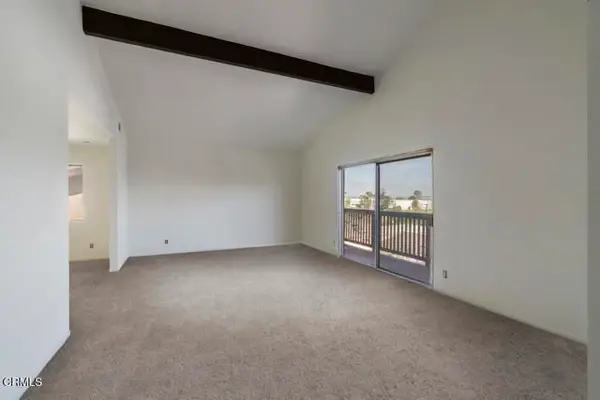 $699,000Pending3 beds 2 baths1,596 sq. ft.
2353 Bullard Avenue, Los Angeles, CA 90032
MLS# CRP1-26202Listed by: COMPASS $499,900Active2 beds 1 baths732 sq. ft.
810 S Indiana, Los Angeles, CA 90023
MLS# CRTR26053771Listed by: RE/MAX TOP PRODUCERS $1,400,000Active8 beds 4 baths
919 Stone, Los Angeles, CA 90063
MLS# SB26051756Listed by: W&D REAL ESTATE INVESTMENTS $535,000Active1 beds 1 baths624 sq. ft.
3124 Darwin, Los Angeles, CA 90031
MLS# DW26052549Listed by: CENTURY 21 ALLSTARS $2,100,000Active14 beds 16 baths11,034 sq. ft.
600 N Soto Street, Los Angeles, CA 90033
MLS# 26663887Listed by: TONY AZZI $799,000Active2 beds 1 baths899 sq. ft.
4303 Stillwell Avenue, Los Angeles, CA 90032
MLS# CL26655877Listed by: COLDWELL BANKER REALTY $750,000Active4 beds 2 baths1,835 sq. ft.
1259 Velasco Street, Los Angeles, CA 90023
MLS# CV26035957Listed by: CENTURY 21 MASTERS $985,000Active0.21 Acres
1779 Albion, Los Angeles, CA 90031
MLS# CRMB26046014Listed by: GEORGE MICHAEL REALTY $750,000Active4 beds 2 baths1,835 sq. ft.
1259 Velasco Street, Los Angeles, CA 90023
MLS# CV26035957Listed by: CENTURY 21 MASTERS $750,000Active-- beds -- baths1,835 sq. ft.
1259 Velasco Street, Los Angeles, CA 90023
MLS# CV26054041Listed by: CENTURY 21 MASTERS $550,000Active3 beds 1 baths1,232 sq. ft.
4316 Dozier Street, Los Angeles, CA 90022
MLS# CRAR26050967Listed by: RE/MAX PREMIER PROPERTIES $790,000Active3 beds 4 baths980 sq. ft.
2371 Belleglade Avenue, Los Angeles, CA 90032
MLS# CRIG26051804Listed by: PONCE & PONCE REALTY, INC $500,000Pending3 beds -- baths1,629 sq. ft.
826 N Rowan Avenue, Los Angeles, CA 90063
MLS# CROC26050943Listed by: SEVEN GABLES REAL ESTATE $950,000Active1 beds 1 baths
4552 Catalpa Street, Los Angeles, CA 90032
MLS# V1-35130Listed by: EXP REALTY OF CALIFORNIA INC $750,000Active5 beds -- baths4,096 sq. ft.
3248 Eastern Avenue, Los Angeles, CA 90032
MLS# CRGD26054047Listed by: LAS CASAS REALTY, INC. $899,000Active4 beds 2 baths1,578 sq. ft.
2649 Round Drive, Los Angeles, CA 90032
MLS# CRP1-26209Listed by: BERKSHIRE HATHAWAY HOME SERVIC $1,126,000Active8 beds 4 baths
669 N Boyle Ave, Los Angeles, CA 90033
MLS# DW26052296Listed by: FIRST FAMILY HOMES $879,000Active7 beds -- baths2,706 sq. ft.
1917 New Jersey Street, Los Angeles, CA 90033
MLS# CL26659123Listed by: MILLER & DESATNIK REALTY CO.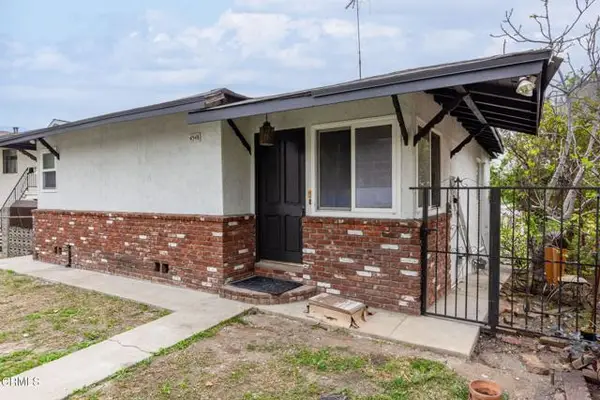 $825,000Active2 beds 1 baths1,084 sq. ft.
4548 Catalpa Street, Los Angeles, CA 90032
MLS# CRV1-35114Listed by: EXP REALTY OF CALIFORNIA INC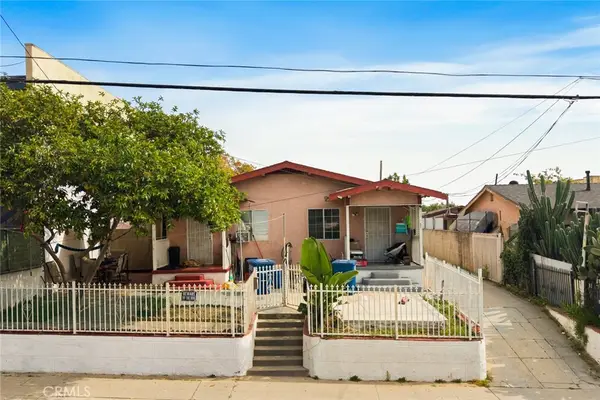 $775,000Active-- beds -- baths2,035 sq. ft.
650 S Indiana St, Los Angeles, CA 90023
MLS# DW26020297Listed by: CENTURY 21 ALLSTARS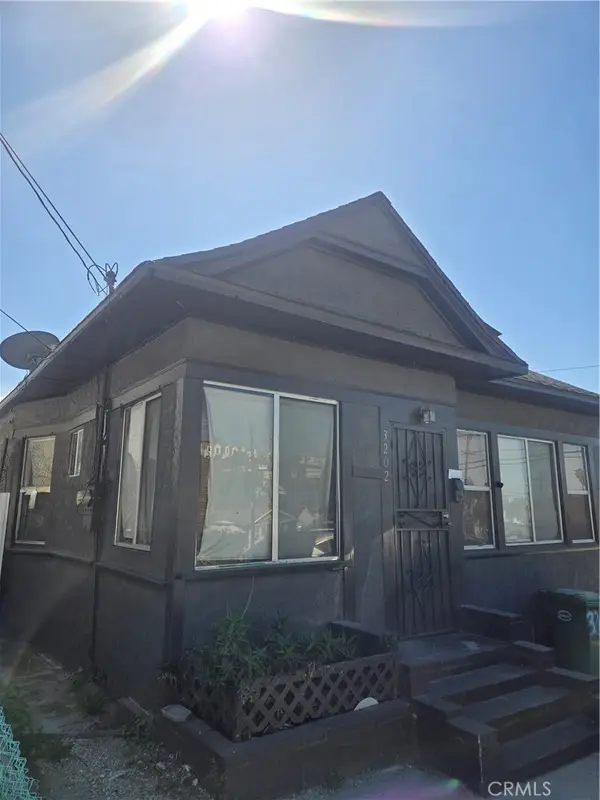 $798,000Active4 beds 3 baths1,578 sq. ft.
3202 Ganahl, Los Angeles, CA 90063
MLS# DW26053096Listed by: CENTURY 21 REALTY MASTERS $365,000Pending1 beds 1 baths504 sq. ft.
3667 E 5th, Los Angeles, CA 90063
MLS# DW26050915Listed by: CENTURY 21 LOTUS $1,299,000Active10 beds -- baths2,256 sq. ft.
3737 Whiteside, Los Angeles, CA 90063
MLS# CRSR26052470Listed by: REAL BROKERAGE TECHNOLOGIES, INC. $624,800Active3 beds 2 baths
3446 E Hunter Street, Los Angeles, CA 90023
MLS# DW26036306Listed by: KELLER WILLIAMS SELA $1,180,000Active-- beds -- baths4,861 sq. ft.
1072 Leonard Avenue, Los Angeles, CA 90022
MLS# SB26051757Listed by: LYON STAHL INVESTMENT REAL ESTATE, INC. $1,189,000Active5 beds 4 baths2,225 sq. ft.
1616 Pennsylvania Avenue, Los Angeles, CA 90033
MLS# 26662317Listed by: DREAM REALTY & INVESTMENTS INC $424,900Active5 beds -- baths1,522 sq. ft.
3134 Fairmount, Los Angeles, CA 90063
MLS# CRPW26051354Listed by: GROW DETOVI, INC- Open Sat, 11am to 2pm
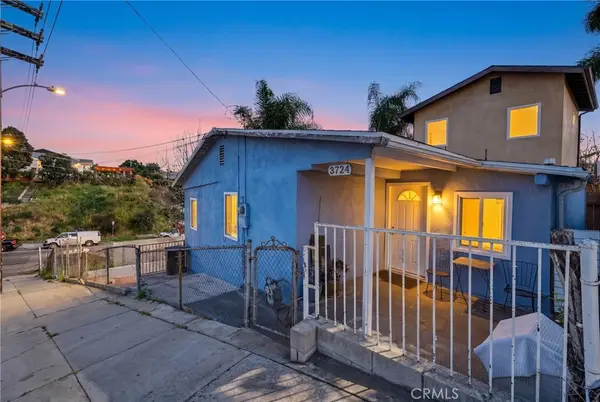 $660,000Active3 beds 2 baths1,200 sq. ft.
3724 Folsom St, Los Angeles, CA 90063
MLS# GD26051421Listed by: LAS CASAS REALTY, INC.  $760,000Active7 beds 2 baths1,890 sq. ft.
1228 S Ditman, Los Angeles, CA 90023
MLS# DW26049094Listed by: ODYSSEY REALTY GROUP $999,900Active4 beds 3 baths
1254 S Mcbride, Los Angeles, CA 90022
MLS# DW26051010Listed by: EXCELLENCE RE REAL ESTATE, INC. $569,000Active2 beds 1 baths608 sq. ft.
3868 E 1st, Los Angeles, CA 90063
MLS# RS26045993Listed by: BERKSHIRE HATHAWAY HOMESERVICE $1,030,000Active9 beds 5 baths
666 Hoefner, East Los Angeles, CA 90022
MLS# SB26049396Listed by: FRED DIBERNARDO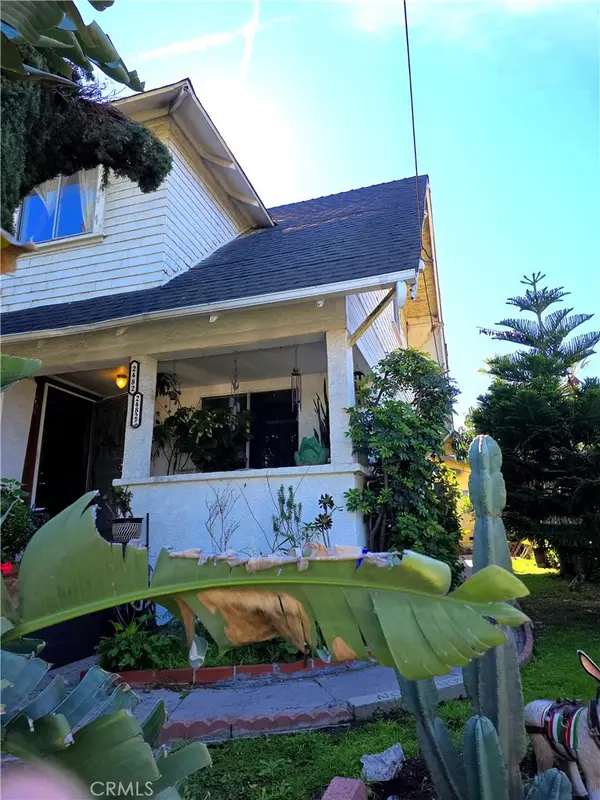 $750,000Active4 beds 1 baths1,848 sq. ft.
2482 Pomeroy Ave, Los Angeles, CA 90033
MLS# SR26044859Listed by: REAL BROKERAGE TECHNOLOGIES, INC. $849,000Pending3 beds 2 baths1,347 sq. ft.
2459 N Ditman, Los Angeles, CA 90032
MLS# PW26048618Listed by: COLDWELL BANKER BEST REALTY- Open Sat, 12 to 2pm
 $498,888Active2 beds 1 baths800 sq. ft.
3424 Pueblo Avenue #8, Los Angeles, CA 90032
MLS# 26657417Listed by: LEMARK REALTY  $649,000Pending5 beds -- baths1,680 sq. ft.
1052 S Herbert, East Los Angeles, CA 90023
MLS# CRDW26048749Listed by: FIRST TEAM REAL ESTATE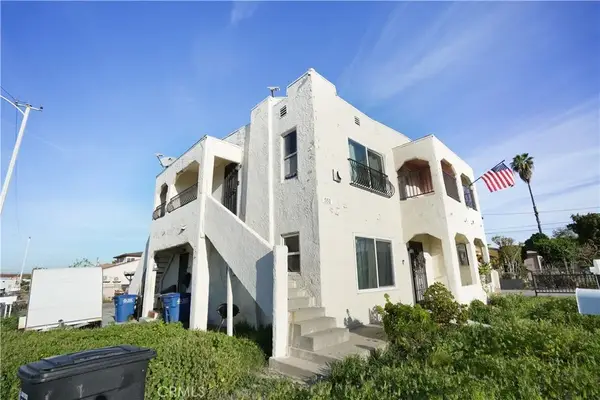 $1,175,000Active4 beds 4 baths
545 Eastmont Avenue, Los Angeles, CA 90022
MLS# PW26048383Listed by: JUSTIN WHITE $699,000Pending2 beds 1 baths1,327 sq. ft.
3916 Collis Avenue, Los Angeles, CA 90032
MLS# CL26659431Listed by: TRULINE REALTY $759,000Active5 beds 2 baths1,515 sq. ft.
4252 Blanchard, Los Angeles, CA 90063
MLS# CRMB26045723Listed by: CENTURY 21 ALLSTARS $600,000Active3 beds 2 baths1,290 sq. ft.
360 W Avenue 26 #215, Los Angeles, CA 90031
MLS# CRTR26047525Listed by: FIRST TEAM REAL ESTATE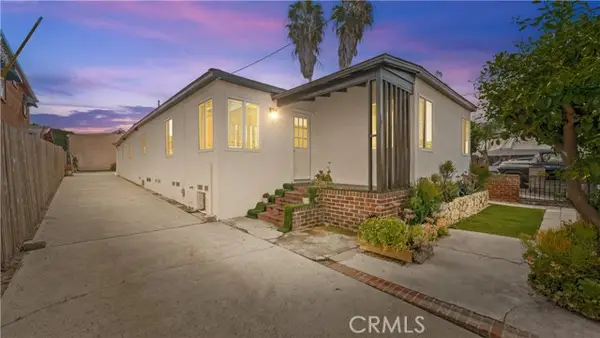 $855,000Active5 beds 3 baths1,668 sq. ft.
1012 Lord Street, Los Angeles, CA 90033
MLS# CRCV26041503Listed by: EXP REALTY OF GREATER LOS ANGELES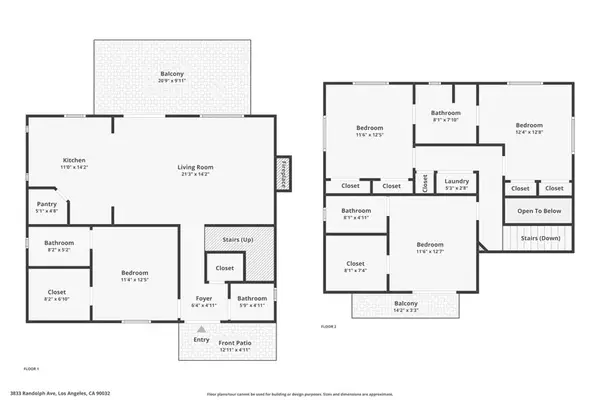 $1,469,000Active7 beds 5 baths2,767 sq. ft.
3833 Randolph, Los Angeles, CA 90032
MLS# CV26047391Listed by: TREVINO PROPERTIES, INC.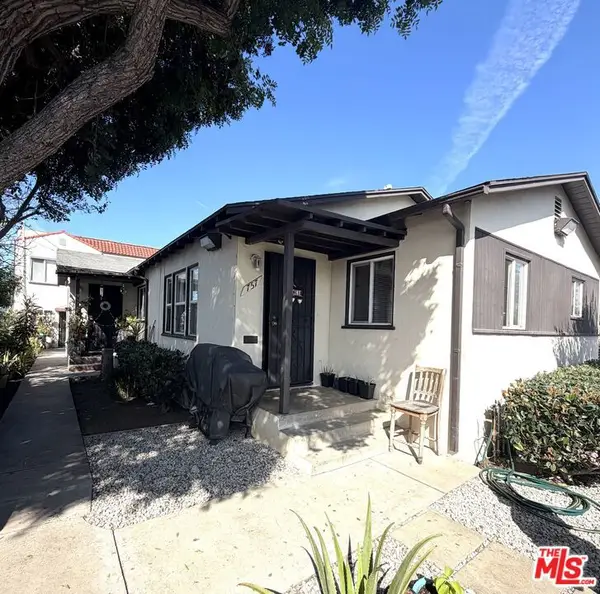 $935,000Active7 beds 5 baths3,264 sq. ft.
757 Leonard Avenue, Los Angeles, CA 90022
MLS# 26659789Listed by: KELLER WILLIAMS BEVERLY HILLS $1,349,000Active-- beds 8 baths3,600 sq. ft.
357 Cornwell, Los Angeles, CA 90033
MLS# SR26047857Listed by: TRUE NORTH REALTY $1,469,000Active7 beds 5 baths2,767 sq. ft.
3833 Randolph, Los Angeles, CA 90032
MLS# CV26047391Listed by: TREVINO PROPERTIES, INC. $899,000Active5 beds -- baths1,618 sq. ft.
143 S Gless, Los Angeles, CA 90033
MLS# CRDW26046656Listed by: 24 HOUR REAL ESTATE $700,000Active2 beds 1 baths1,040 sq. ft.
3981 Rogers Street, Los Angeles, CA 90063
MLS# CRP1-26080Listed by: VIMVI CALIFORNIA $1,799,000Active5 beds 5 baths3,990 sq. ft.
4124 Barrett, Los Angeles, CA 90032
MLS# GD26044782Listed by: REMAX OPTIMA $898,000Active3 beds 1 baths1,203 sq. ft.
4253 Guardia Avenue, Los Angeles, CA 90032
MLS# CL26659107Listed by: COMPASS $699,900Pending2 beds 1 baths865 sq. ft.
6503 Ferguson, Los Angeles, CA 90022
MLS# IG26044916Listed by: KW THE LAKES $1,790,000Active0.18 Acres
3700 E Cesar E Chavez Avenue, Los Angeles, CA 90063
MLS# CL26657973Listed by: EXP REALTY OF GREATER LOS ANGELES $745,000Pending2 beds -- baths1,344 sq. ft.
2822 Johnston Street, Los Angeles, CA 90031
MLS# CL26655883Listed by: COLDWELL BANKER REALTY $799,000Active8 beds 4 baths2,824 sq. ft.
1146 Euclid Avenue, Los Angeles, CA 90023
MLS# 26658263Listed by: COMPASS $649,000Active3 beds 3 baths1,360 sq. ft.
4755 Templeton Street #2210, Los Angeles, CA 90032
MLS# PF26044600Listed by: COMPASS $499,900Active1 beds 1 baths585 sq. ft.
223 S Kern, Los Angeles, CA 90022
MLS# CRRS26044567Listed by: AMBERWOOD REAL ESTATE $1,175,000Active6 beds -- baths2,739 sq. ft.
3319 Darwin, Los Angeles, CA 90031
MLS# CRDW26044733Listed by: CYRIL FINANCIAL GROUP $524,900Active3 beds 1 baths776 sq. ft.
225 S Kern, Los Angeles, CA 90022
MLS# CRRS26044544Listed by: AMBERWOOD REAL ESTATE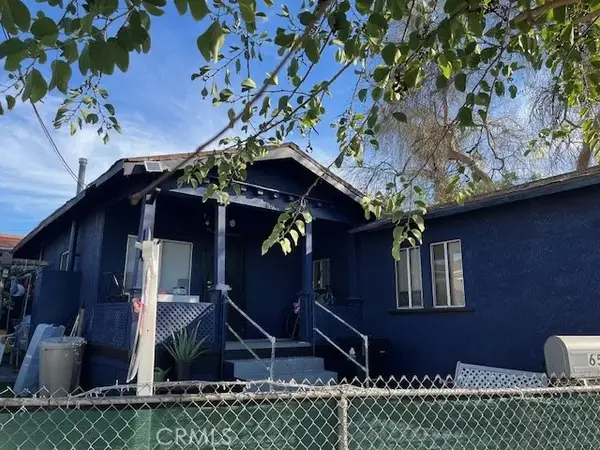 $900,000Active4 beds 3 baths
656 S Mott, Los Angeles, CA 90023
MLS# WS26044226Listed by: KW COVINA $1,049,989Active5 beds -- baths1,877 sq. ft.
4926 Templeton Street, Los Angeles, CA 90032
MLS# CRMB26044282Listed by: CENTURY 21 REALTY MASTERS $1,299,000Active2 beds -- baths2,800 sq. ft.
2740 Fairmount, Los Angeles, CA 90033
MLS# CRCV26043972Listed by: COMPLETE HOME REALTY $828,000Active4 beds 2 baths1,427 sq. ft.
1362 South Downey Road, Los Angeles, CA 90023
MLS# CRPW26034473Listed by: THE BROKEREDGE $1,250,000Active8 beds -- baths
2501 Workman St., Los Angeles, CA 90031
MLS# SR26043486Listed by: LPT REALTY, INC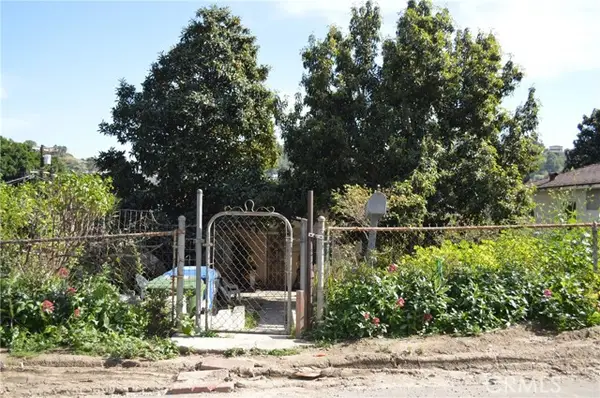 $575,000Active3 beds 1 baths656 sq. ft.
5090 Ithaca, Los Angeles, CA 90032
MLS# CRDW26043003Listed by: BRICK & CO REAL ESTATE $4,000,000Active1 beds 2 baths
323 N Soto Street, Los Angeles, CA 90033
MLS# SR26043369Listed by: ALTMAN APARTMENTS LLC $1,050,000Active8 beds -- baths2,436 sq. ft.
1836 Lansdowne Avenue, Los Angeles, CA 90032
MLS# CL26657053Listed by: COMPASS $479,000Active2 beds 2 baths753 sq. ft.
459 S Lorena Street, Los Angeles, CA 90063
MLS# CL26657395Listed by: COMPASS $2,100,000Active0 Acres
0 Randolph, Los Angeles, CA 90032
MLS# AR26042770Listed by: CENTURY 21 LUDECKE INC.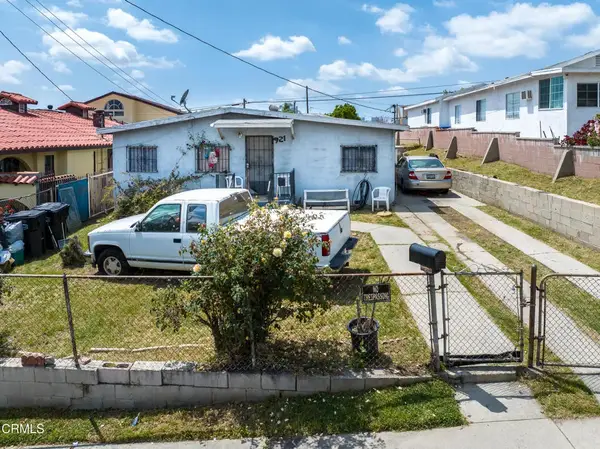 $660,000Active3 beds 1 baths
923 N Alma Avenue, Los Angeles, CA 90023
MLS# P1-26010Listed by: BERKSHIRE HATHAWAY HOME SERVIC $1,248,000Active3 beds -- baths3,092 sq. ft.
945 N Ditman Avenue, Los Angeles, CA 90063
MLS# CL26656413Listed by: HIGH EQUITY REAL ESTATE SERVICE, INC. $998,000Active8 beds -- baths3,314 sq. ft.
127 N Savannah Street, Los Angeles, CA 90033
MLS# CL26656423Listed by: HIGH EQUITY REAL ESTATE SERVICE, INC. $839,000Active3 beds 3 baths1,369 sq. ft.
1301 Stone Street, Los Angeles, CA 90063
MLS# CRPW26040074Listed by: REDFIN CORPORATION $929,000Active3 beds -- baths1,648 sq. ft.
710 Bradshawe, East Los Angeles, CA 90022
MLS# CRDW26041992Listed by: IET REAL ESTATE $424,999Active2 beds 2 baths
372 N Chicago, Los Angeles, CA 90033
MLS# SR26035312Listed by: RBS REALTY $339,000Active0.23 Acres
2701 N Thomas Street, Los Angeles, CA 90031
MLS# CRPF26039575Listed by: REDFIN CORPORATION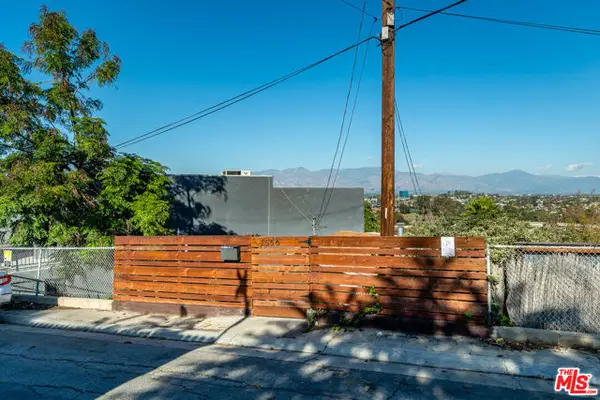 $749,900Active3 beds -- baths1,322 sq. ft.
1556 Rollins Drive, Los Angeles, CA 90063
MLS# CL26656085Listed by: COMPASS $675,000Active3 beds 1 baths880 sq. ft.
946 S Vancouver Avenue, East Los Angeles, CA 90022
MLS# SR26037012Listed by: BERKSHIRE HATHAWAY HOMESERVICES CALIFORNIA PROPERTIES $599,000Active2 beds -- baths808 sq. ft.
2426 Medford, Los Angeles, CA 90033
MLS# CRWS26040475Listed by: PINNACLE REAL ESTATE GROUP $599,000Active2 beds 2 baths808 sq. ft.
2426 Medford, Los Angeles, CA 90033
MLS# WS26040475Listed by: PINNACLE REAL ESTATE GROUP $60,000Active0.17 Acres
4232 Locke, El Sereno, CA 90032
MLS# WS25215135Listed by: JPAN REALTY $795,000Active3 beds -- baths1,388 sq. ft.
1911 Griffin Avenue, Los Angeles, CA 90031
MLS# CL26655417Listed by: ASPIRE LOS ANGELES $249,000Active0 Acres
4132 Turquoise, Los Angeles, CA 90032
MLS# CV26028440Listed by: EXP REALTY OF CALIFORNIA INC $1,450,000Active-- beds -- baths3,040 sq. ft.
5110 Whittier, Los Angeles, CA 90022
MLS# DW26040136Listed by: CENTURY 21 ALLSTARS $50,000Active0.15 Acres
0 Forest Park Drive, Los Angeles, CA 90032
MLS# CRP1-25959Listed by: NORM HALEY REAL ESTATE $1,235,000Active4 beds 2 baths
1335 S Woods, Los Angeles, CA 90022
MLS# RS26039270Listed by: TOWNE CENTER REALTORS, INC. $234,000Active0.09 Acres
1202 N Hicks Avenue, City Terrace, CA 90063
MLS# MB26035681Listed by: CENTURY 21 REALTY MASTERS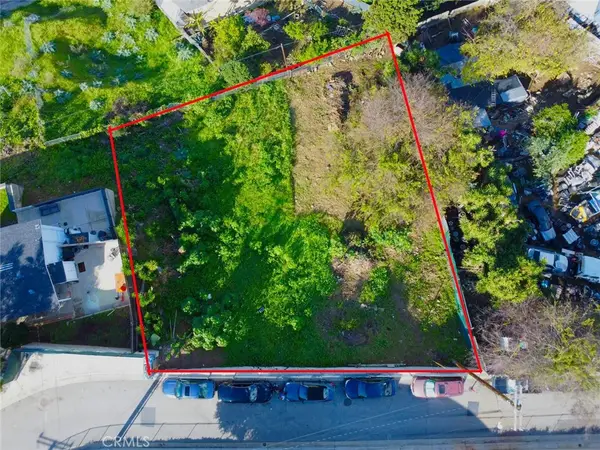 $225,000Active0.15 Acres
3621 Meisner Street, City Terrace, CA 90063
MLS# MB26035704Listed by: CENTURY 21 REALTY MASTERS $825,000Active2 beds 2 baths1,252 sq. ft.
4206 Lowell, Los Angeles, CA 90032
MLS# CRAR26038581Listed by: SEVEN GABLES REAL ESTATE $698,888Pending4 beds 4 baths
657 S Mathews, Los Angeles, CA 90023
MLS# AR26035759Listed by: HAAS REALTY & PROP. MANAGEMENT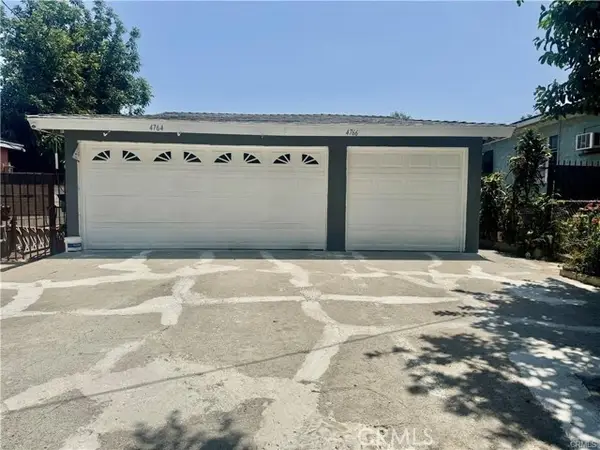 $819,999Active4 beds -- baths1,904 sq. ft.
4766 Hammel, Los Angeles, CA 90022
MLS# CRCV26038007Listed by: H4S REALTY $2,100,000Active-- beds -- baths5,512 sq. ft.
3823 Stockbridge, Los Angeles, CA 90032
MLS# CV26036874Listed by: EXP REALTY OF SOUTHERN CALIFORNIA INC $518,000Active0.1 Acres
4210 N Montecito Dr, Los Angeles, CA 90031
MLS# CL26650149Listed by: CB RICHARD ELLIS, INC. $518,000Active0.12 Acres
4219 N Montecito Dr, Los Angeles, CA 90031
MLS# CL26653785Listed by: CB RICHARD ELLIS, INC. $518,000Active0.11 Acres
4227 N Montecito Dr, Los Angeles, CA 90031
MLS# CL26653859Listed by: CB RICHARD ELLIS, INC. $518,000Active0.12 Acres
4215 N Montecito Dr, Los Angeles, CA 90031
MLS# CL26653767Listed by: CB RICHARD ELLIS, INC. $325,000Active0.2 Acres
4719 Catalpa, Los Angeles, CA 90032
MLS# CRDW26036268Listed by: MIAMAR REALTY $325,000Active0.18 Acres
4723 Catalpa, Los Angeles, CA 90032
MLS# CRDW26036280Listed by: MIAMAR REALTY $799,000Active3 beds 1 baths1,303 sq. ft.
1516 Kurtz, Los Angeles, CA 90063
MLS# DW26036258Listed by: CENTURY 21 LEADERS $675,888Active4 beds 2 baths
215 N Evergreen, Los Angeles, CA 90033
MLS# CV26032828Listed by: CORNERSTONE REALTY GROUP $518,000Active2 beds 2 baths1,160 sq. ft.
360 W Avenue 26 #234, Los Angeles, CA 90031
MLS# 26651261Listed by: COLDWELL BANKER REALTY $825,000Active7 beds -- baths1,927 sq. ft.
727 S Eastmont Avenue, Los Angeles, CA 90022
MLS# CRTR26035377Listed by: HOMESMART, EVERGREEN REALTY $799,999Active3 beds 2 baths1,280 sq. ft.
646 S Record Avenue, Los Angeles, CA 90023
MLS# DW26027021Listed by: CENTURY 21 REALTY MASTERS $929,900Active-- beds -- baths1,624 sq. ft.
2553 Verde Street, Los Angeles, CA 90033
MLS# DW26034736Listed by: CENTURY 21 ALLSTARS $799,000Active3 beds 2 baths1,450 sq. ft.
1823 Jones Avenue, Los Angeles, CA 90032
MLS# P1-25878Listed by: COLDWELL BANKER REALTY $399,998Active-- beds 1 baths900 sq. ft.
200 N San Fernando #202, Los Angeles, CA 90031
MLS# PW26034632Listed by: T.N.G. REAL ESTATE CONSULTANTS $798,500Active3 beds -- baths2 sq. ft.
5253 N Huntington Dr. Drive, Los Angeles, CA 90032
MLS# CRDW26032395Listed by: REALTY WORLD 5 STAR BROKERS $1,175,000Active6 beds 5 baths3,024 sq. ft.
3412 E 3rd Street, Los Angeles, CA 90063
MLS# 26651555Listed by: COMPASS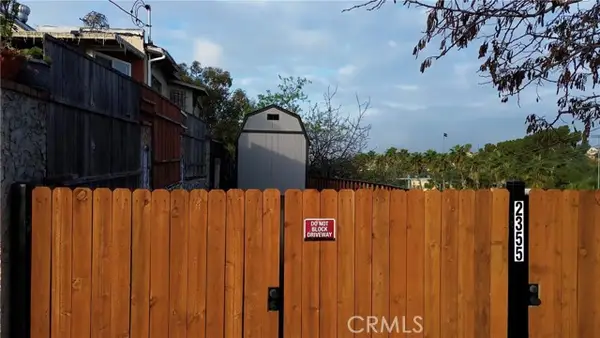 $99,999Active0.1 Acres
2355 Coral, Los Angeles, CA 90031
MLS# CRDW26028814Listed by: K & K REALTY GROUP, INC.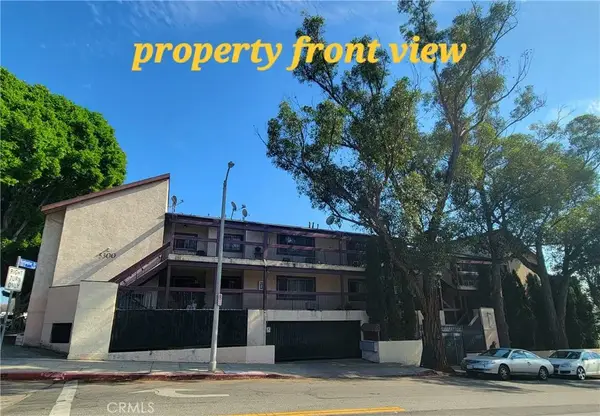 $2,350,000Active7 beds 4 baths
5300 Huntington South, Los Angeles, CA 90032
MLS# WS26033522Listed by: PINNACLE REAL ESTATE GROUP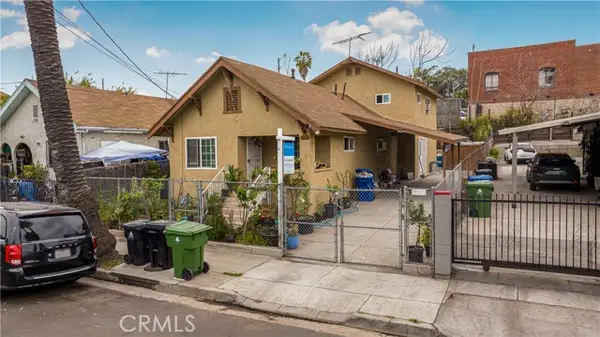 $769,900Pending5 beds 2 baths1,768 sq. ft.
953 Hollins, Los Angeles, CA 90023
MLS# CRCV26032381Listed by: EQUITY SMART REAL ESTATE SERVICES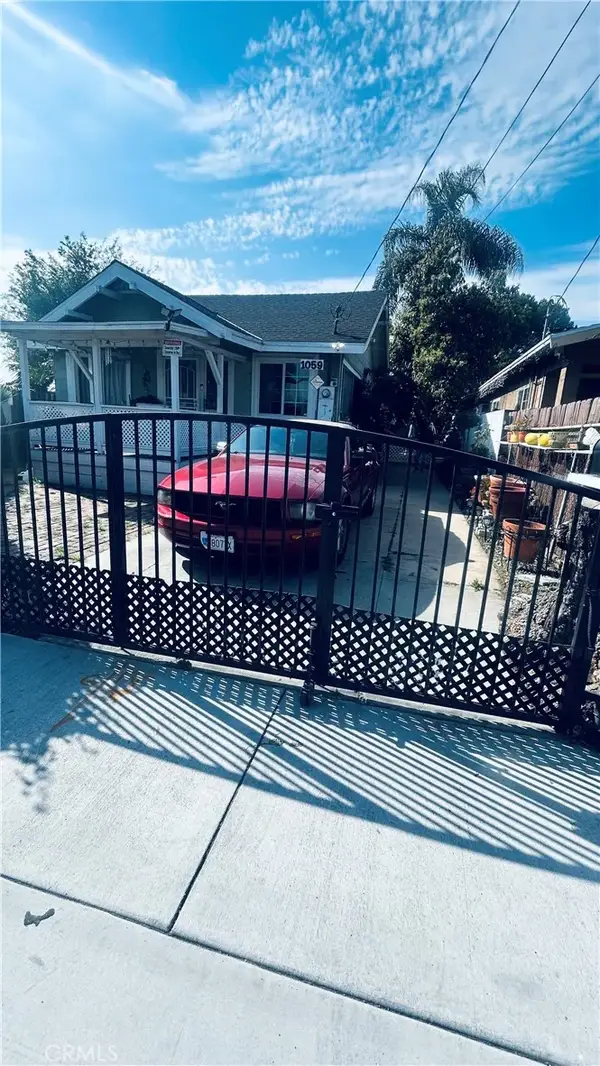 $699,900Active4 beds 2 baths1,746 sq. ft.
1059 Record Avenue, Los Angeles, CA 90023
MLS# PW26033875Listed by: EXCELLENCE RE REAL ESTATE $699,900Active4 beds 2 baths1,746 sq. ft.
1059 Record Avenue, Los Angeles, CA 90023
MLS# PW26033875Listed by: EXCELLENCE RE REAL ESTATE $1,010,000Active-- beds -- baths1,538 sq. ft.
5371 Alhambra Avenue, Los Angeles, CA 90032
MLS# 26652013Listed by: ASPIRE LOS ANGELES $569,900Active3 beds 2 baths
415 Euclid Avenue, Los Angeles, CA 90063
MLS# OC26033103Listed by: COMPASS REAL ESTATE $2,100,000Active17 beds 5 baths4,704 sq. ft.
5243 Huntington Drive, Los Angeles, CA 90032
MLS# 26651405Listed by: MARCUS & MILLICHAP $1,150,000Active4 beds 3 baths1,227 sq. ft.
3800 Locke Avenue, Los Angeles, CA 90032
MLS# TR26031378Listed by: KW COLLEGE PARK $595,000Pending2 beds 1 baths702 sq. ft.
4759 Topaz Street, Los Angeles, CA 90032
MLS# CL25631581Listed by: COMPASS $1,698,000Active7 beds 5 baths
2607 Pennsylvania Avenue, Los Angeles, CA 90033
MLS# P1-25832Listed by: METRO DISTRICT REALTY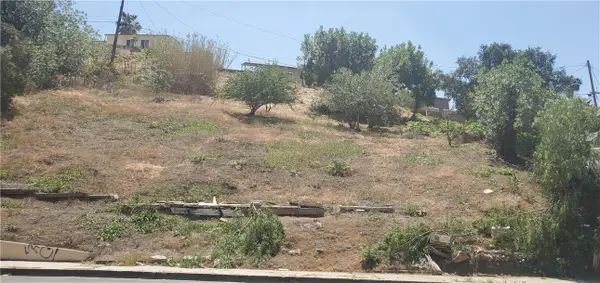 $350,000Active0.76 Acres
0 Marengo, Los Angeles, CA 90063
MLS# CRDW26031976Listed by: POPULAR FUNDING & REAL ESTATE $745,000Active4 beds -- baths1,901 sq. ft.
2103 Michigan Ave, Los Angeles, CA 90033
MLS# CRCV26031444Listed by: REALTY MASTERS & ASSOCIATES- Open Sat, 2 to 4pm
 $535,000Active2 beds 1 baths682 sq. ft.
2602 Onyx Drive, Los Angeles, CA 90032
MLS# WS26029204Listed by: COLDWELL BANKER NEW CENTURY  $525,000Active2 beds 2 baths1,160 sq. ft.
360 W Avenue 26 #133, Los Angeles, CA 90031
MLS# PF26029987Listed by: WILLOWMAR REAL ESTATE $518,000Active0.1 Acres
4206 N Montecito Drive, Los Angeles, CA 90031
MLS# CL26650081Listed by: CB RICHARD ELLIS, INC. $769,000Active3 beds 2 baths1,515 sq. ft.
404 S Woods Avenue, East Los Angeles, CA 90022
MLS# MB26030962Listed by: CENTURY 21 REALTY MASTERS $1,700,000Active19 beds 10 baths5,360 sq. ft.
121 S Gless Street, Los Angeles, CA 90033
MLS# 26650115Listed by: LYON STAHL INVESTMENT REAL ESTATE, INC. $1,299,000Active5 beds 9 baths4,508 sq. ft.
3108 E 4th Street, Los Angeles, CA 90063
MLS# 26645131Listed by: CLINT LUKENS REALTY $710,000Active3 beds 2 baths1,430 sq. ft.
543 S Ditman, Los Angeles, CA 90063
MLS# CRCV26015117Listed by: COLDWELL BANKER LEADERS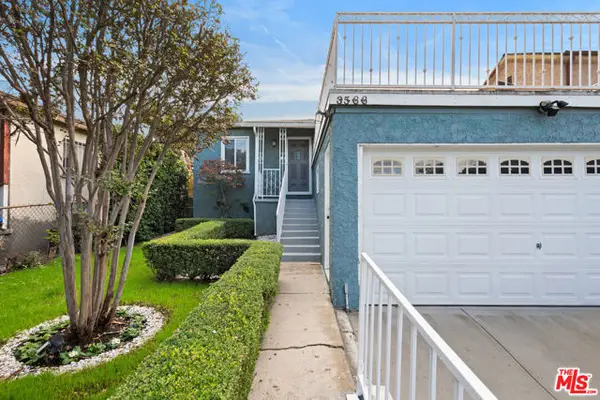 $799,000Active3 beds 2 baths1,064 sq. ft.
3566 City Terrace Drive, Los Angeles, CA 90063
MLS# CL26648899Listed by: COLDWELL BANKER REALTY $530,000Active3 beds 2 baths1,350 sq. ft.
4750 Templeton Street #1104, Los Angeles, CA 90032
MLS# CL26649477Listed by: COMPASS $1,000,000Active0.16 Acres
335 N Soto Street, Los Angeles, CA 90033
MLS# CL26649651Listed by: DATASHARE CR DEFAULT OFFICE DON'T DELETE $139,000Active0 Acres
2600 N Adkins, El Sereno, CA 90032
MLS# WS26028340Listed by: PINA REALTY $139,000Active0 Acres
2671 N Adkins, El Sereno, CA 90032
MLS# WS26028396Listed by: PINA REALTY- $139,000Active0.13 Acres
2600 N Adkins Avenue, Los Angeles, CA 90032
MLS# CRWS26028340Listed by: PINA REALTY - $139,000Active0.15 Acres
2661 N Adkins Avenue, Los Angeles, CA 90032
MLS# CRWS26028374Listed by: PINA REALTY - $139,000Active0.15 Acres
2671 N Adkins Avenue, Los Angeles, CA 90032
MLS# CRWS26028396Listed by: PINA REALTY  $139,000Active0 Acres
2661 N Adkins, El Sereno, CA 90032
MLS# WS26028374Listed by: PINA REALTY $650,000Pending4 beds 2 baths1,316 sq. ft.
5709 E Beverly Boulevard, Los Angeles, CA 90022
MLS# CRSR26027966Listed by: LUXURY COLLECTIVE $750,000Active7 beds -- baths2,436 sq. ft.
127 S Evergreen Avenue, Los Angeles, CA 90033
MLS# CL26647515Listed by: COMPASS $774,999Active3 beds 2 baths1,298 sq. ft.
4121 Canto, Los Angeles, CA 90032
MLS# OC26027621Listed by: VIDA REALTY $600,000Pending4 beds 3 baths
1123 S Kern, Los Angeles, CA 90022
MLS# SR26025957Listed by: EXP REALTY OF GREATER LOS ANGELES, INC.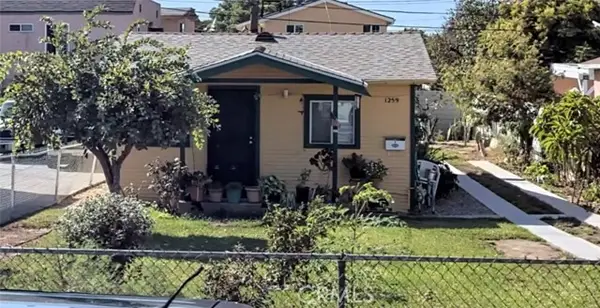 $499,000Active2 beds 1 baths620 sq. ft.
1259 S Alma, Los Angeles, CA 90023
MLS# CRCV26025271Listed by: LA CASA BELLA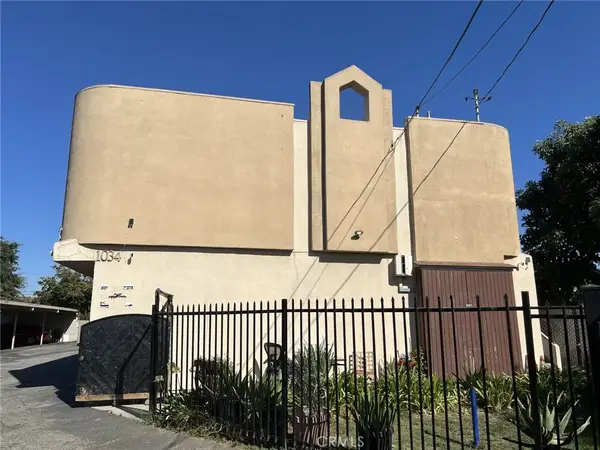 $2,210,000Active8 beds 7 baths
1034 S Herbert, Los Angeles, CA 90023
MLS# AR26026771Listed by: 1000 REALTY CORPORATION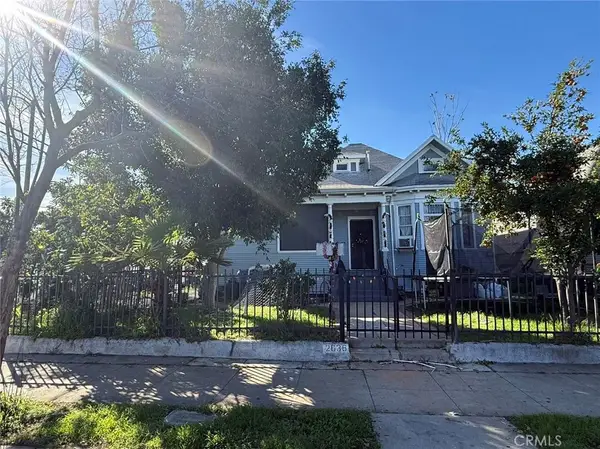 $1,058,888Active5 beds 4 baths
305 S Mott, Los Angeles, CA 90033
MLS# TR26020936Listed by: WETRUST REALTY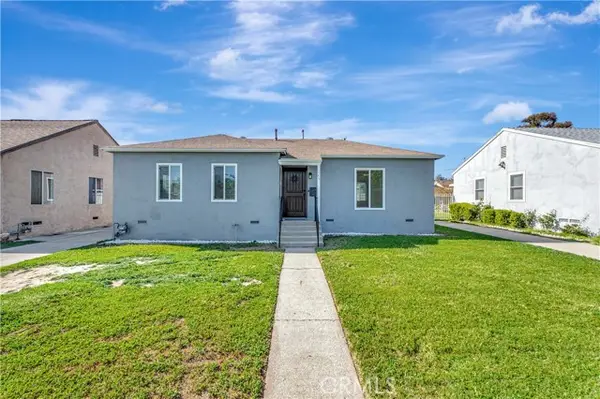 $799,000Active3 beds 1 baths996 sq. ft.
145 S Woods, Los Angeles, CA 90022
MLS# CRCV26025746Listed by: CENTERPOINTE REALTY $1,298,880Active9 beds 6 baths3,828 sq. ft.
4962 Gambier Street, Los Angeles, CA 90032
MLS# TR26026548Listed by: CENTURY 21 MASTERS $649,000Pending2 beds 1 baths1,140 sq. ft.
6110 Dennison Street, Los Angeles, CA 90022
MLS# CRMB26018621Listed by: CENTURY 21 MASTERS $1,200,000Active5 beds 5 baths
2636 Workman, Los Angeles, CA 90031
MLS# CV26025942Listed by: RE/MAX MASTERS REALTY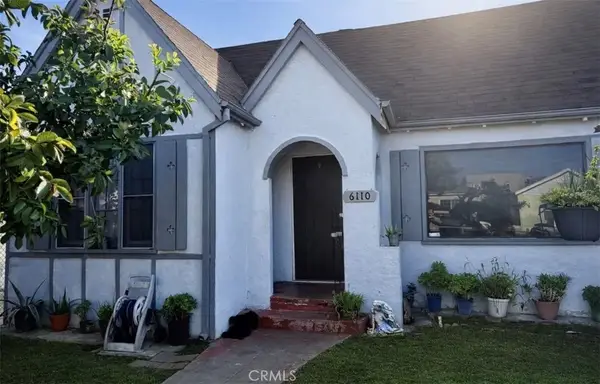 $649,000Pending2 beds 1 baths1,140 sq. ft.
6110 Dennison Street, Los Angeles, CA 90022
MLS# MB26018621Listed by: CENTURY 21 MASTERS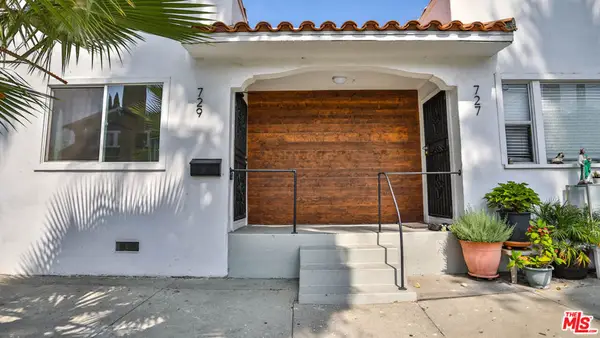 $875,000Active3 beds 3 baths2,060 sq. ft.
727 S St Louis Street, Los Angeles, CA 90023
MLS# 26645115Listed by: COMPASS $575,000Pending-- beds -- baths2,719 sq. ft.
451 S Lorena, Los Angeles, CA 90063
MLS# IV26024374Listed by: REAL BROKER $729,900Active2 beds 2 baths
4620 Twining Street, El Sereno, CA 90032
MLS# MB26024613Listed by: GEORGE MICHAEL REALTY $520,000Active2 beds 2 baths813 sq. ft.
2324 Lillyvale Avenue #143, Los Angeles, CA 90032
MLS# WS25268857Listed by: COLDWELL BANKER NEW CENTURY $895,000Pending7 beds 4 baths
322 N Ditman, Los Angeles, CA 90063
MLS# CV26005015Listed by: INTERNATIONAL REAL ESTATE SVCS $725,000Pending2 beds 1 baths868 sq. ft.
4748 Dozier Street, East Los Angeles, CA 90022
MLS# CV26024525Listed by: COLDWELL BANKER LEADERS $1,050,000Active5 beds 5 baths3,150 sq. ft.
3873 Dwiggins Street, Los Angeles, CA 90063
MLS# CV26016759Listed by: CENTURY 21 MASTERS $795,000Active8 beds 3 baths
529 S Breed Street, Los Angeles, CA 90033
MLS# DW26022136Listed by: RE/MAX TOP PRODUCERS $3,400,000Active5 beds 7 baths
354 N Breed, Los Angeles, CA 90033
MLS# PW26019990Listed by: EXP REALTY OF GREATER LOS ANGELES $5,000,000Active7 beds 7 baths
351 S State, Los Angeles, CA 90033
MLS# PW26019991Listed by: EXP REALTY OF GREATER LOS ANGELES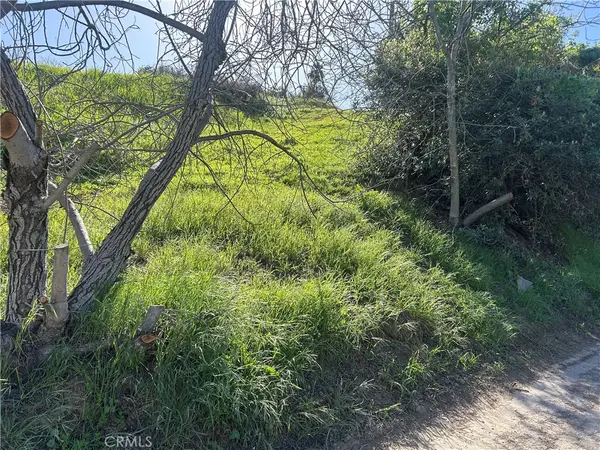 $65,000Active0.17 Acres
4042 Harriman, El Sereno, CA 90032
MLS# DW26022960Listed by: CENTURY 21 ALLSTARS $935,000Active5 beds -- baths1,528 sq. ft.
339 N Mcdonnell, Los Angeles, CA 90022
MLS# CRPW26022561Listed by: LYON STAHL INVESTMENT REAL EST $850,000Active4 beds -- baths2,234 sq. ft.
206 S Soto, Los Angeles, CA 90033
MLS# CRSR26022151Listed by: KOENIG PROPERTIES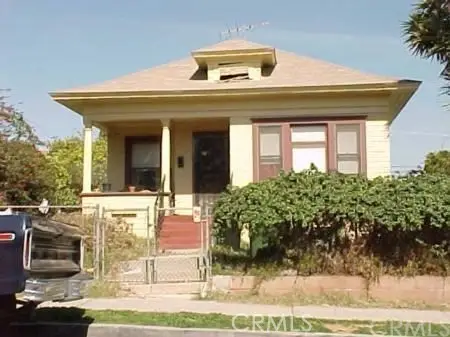 $1,150,000Active-- beds -- baths11,934 sq. ft.
2427 Houston, Los Angeles, CA 90033
MLS# DW26022494Listed by: CENTURY 21 A BETTER SERVICE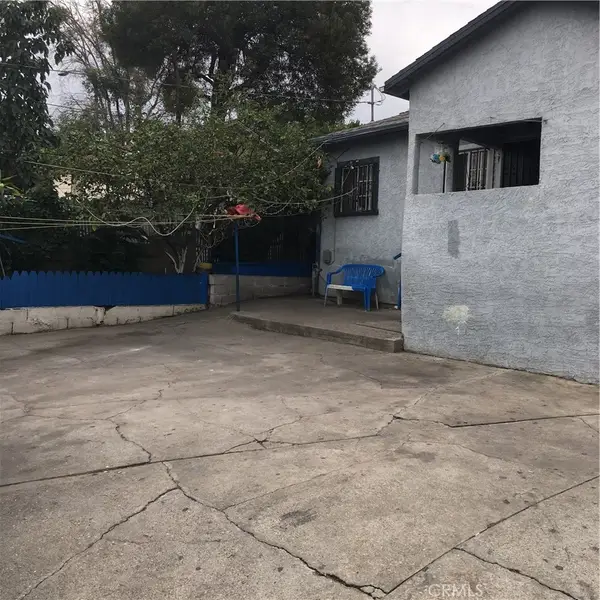 $1,200,000Active-- beds -- baths4,274 sq. ft.
1611 Murchison, Los Angeles, CA 90033
MLS# DW26022504Listed by: EL CAMINO REAL ESTATE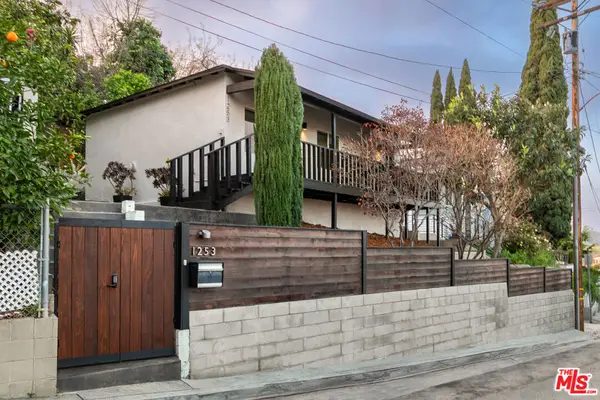 $575,000Active2 beds 1 baths572 sq. ft.
1253 N Ditman Avenue, Los Angeles, CA 90063
MLS# 26645333Listed by: BERKSHIRE HATHAWAY HOMESERVICES CALIFORNIA PROPERTIES $730,000Active4 beds -- baths1,610 sq. ft.
946 S Ferris, East Los Angeles, CA 90022
MLS# CRPW26021850Listed by: EXP REALTY OF SOUTHERN CA, INC $550,000Active3 beds 2 baths1,147 sq. ft.
1153 Euclid, Los Angeles, CA 90023
MLS# IV26021602Listed by: ESTATES & RATES INC. $769,999Active3 beds 2 baths
1258 N Ditman, Los Angeles, CA 90063
MLS# PW26021893Listed by: T.N.G. REAL ESTATE CONSULTANTS $599,000Active3 beds 1 baths1,234 sq. ft.
2600 E 2nd, Los Angeles, CA 90033
MLS# CRDW26013286Listed by: REALTY WORLD 5 STAR BROKERS $3,880,000Active1 beds 1 baths
2614 Griffin Avenue, Los Angeles, CA 90031
MLS# WS26018859Listed by: DENGO INVESTMENT INC. $975,000Pending9 beds -- baths3,626 sq. ft.
2710 New Jersey Street, Los Angeles, CA 90033
MLS# CL26644343Listed by: LYON STAHL INVESTMENT REAL ESTATE, INC. $575,000Pending4 beds -- baths1,664 sq. ft.
2714 New Jersey Street, Los Angeles, CA 90033
MLS# CL26644371Listed by: LYON STAHL INVESTMENT REAL ESTATE, INC.- $2,448,000Active3 beds 3 baths
5005 Axtell, Los Angeles, CA 90032
MLS# AR26020705Listed by: KELLER WILLIAMS - EAGLE ROCK  $495,000Active-- beds 1 baths1,060 sq. ft.
200 N San Fernando #315, Los Angeles, CA 90031
MLS# CRPW26019542Listed by: CIRCA PROPERTIES, INC. $450,000Pending2 beds 2 baths1,014 sq. ft.
1183 N Bonnie Beach, East Los Angeles, CA 90063
MLS# CRSR26020311Listed by: FLANS & WEINER, INC. $1,600,000Active4 beds 4 baths2,668 sq. ft.
4050 Jennings Drive, Los Angeles, CA 90032
MLS# PW26015744Listed by: CIRCA PROPERTIES, INC. $899,000Pending5 beds -- baths2,578 sq. ft.
1613 Pennsylvania Avenue, Los Angeles, CA 90033
MLS# CL26643689Listed by: DREAM REALTY & INVESTMENTS INC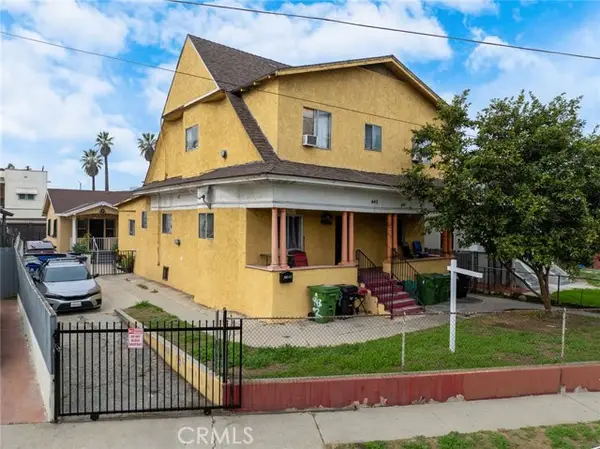 $924,990Active5 beds -- baths2,665 sq. ft.
443 S State, Los Angeles, CA 90033
MLS# CRCV26019172Listed by: MAINSTREET REALTORS $648,888Active3 beds 2 baths1,016 sq. ft.
3451 Estrada, Los Angeles, CA 90023
MLS# CROC26019243Listed by: BANKERS INVESTMENT GROUP INC. $899,000Pending6 beds -- baths
3507 Sabina, Los Angeles, CA 90023
MLS# SR26016278Listed by: LUXURY COLLECTIVE $1,299,999Active-- beds -- baths5,146 sq. ft.
2429 E 3rd, Los Angeles, CA 90033
MLS# DW26019372Listed by: CENTURY 21 ALLSTARS $1,249,900Active7 beds 7 baths
947 S Sunol Drive, Los Angeles, CA 90023
MLS# PW26015574Listed by: THE MANTELLI GROUP $299,000Active-- beds 1 baths640 sq. ft.
360 W Avenue 26 #111, Los Angeles, CA 90031
MLS# CL26643437Listed by: MAISONRE $999,000Active4 beds 2 baths1,746 sq. ft.
2639 Round, Los Angeles, CA 90032
MLS# CRIG26018384Listed by: KELLER WILLIAMS REALTY $1,089,000Active8 beds 4 baths
1031 S Ditman, Los Angeles, CA 90023
MLS# CV26018950Listed by: STIGLER MORTGAGE $825,000Active2 beds 2 baths
4206 Lowell, Los Angeles, CA 90032
MLS# AR26016833Listed by: SEVEN GABLES REAL ESTATE $2,100,000Active9 beds 6 baths5,253 sq. ft.
5353 Oakland Street, Los Angeles, CA 90032
MLS# 26642465Listed by: KELLER WILLIAMS SIERRA MADRE $1,197,000Active-- beds -- baths3,100 sq. ft.
2718 Malabar, Los Angeles, CA 90033
MLS# DW26018416Listed by: CENTURY 21 ALLSTARS $949,999Active5 beds 4 baths
2044 Workman Street, Los Angeles, CA 90031
MLS# CV26017694Listed by: EXECUTIVE REALTY SERVICES $896,000Active4 beds 3 baths2,315 sq. ft.
3439 Siskiyou, Los Angeles, CA 90023
MLS# SR26018009Listed by: CENTURY 21 MASTERS $1,398,000Active5 beds 4 baths
3733 Bostwick St, East Los Angeles, CA 90063
MLS# AR26012655Listed by: 888 REALTY $1,100,000Active3 beds -- baths2,066 sq. ft.
214 S Avenue 18, Los Angeles, CA 90031
MLS# CL26641345Listed by: MARCUS & MILLICHAP $799,000Active3 beds 1 baths
1613 E 1st, Los Angeles, CA 90033
MLS# RS26017773Listed by: VIP RE FIRM $515,000Active3 beds 4 baths
2112 City View Avenue, Los Angeles, CA 90033
MLS# SR26016896Listed by: TRUST PROPERTIES USA,INC $1,100,000Active7 beds 3 baths
2447 Malabar Street, Los Angeles, CA 90033
MLS# MB26016539Listed by: WEST SHORES REALTY $799,000Active1 beds -- baths2,028 sq. ft.
444 Camulos, Los Angeles, CA 90033
MLS# CROC26015897Listed by: TRI-STAR REALTY $798,888Active5 beds -- baths2,161 sq. ft.
2415 N Gates Street, Los Angeles, CA 90031
MLS# CL26640637Listed by: LOFTWAY $700,000Active3 beds 2 baths1,369 sq. ft.
803 S Rowan, Los Angeles, CA 90023
MLS# TR26005941Listed by: CENTURY 21 MASTERS $1,175,000Active7 beds -- baths3,384 sq. ft.
537 Bradshawe Avenue, Los Angeles, CA 90022
MLS# CRPF26014658Listed by: BOT REAL ESTATE $1,180,000Pending8 beds 4 baths3,157 sq. ft.
4326 Hammel St, Los Angeles, CA 90022
MLS# CRWS26012640Listed by: WETRUST REALTY $749,000Active2 beds 2 baths650 sq. ft.
4535 Dudley Drive, Los Angeles, CA 90032
MLS# CL26639697Listed by: COMPASS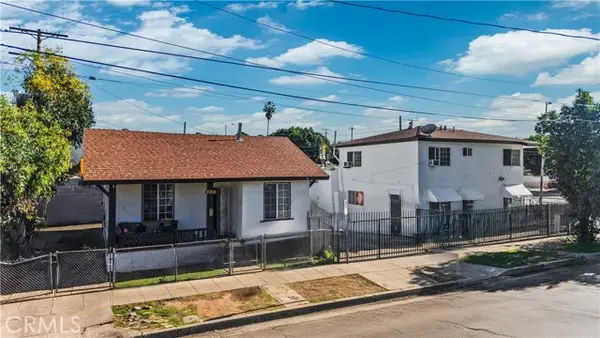 $1,199,899Active7 beds 3 baths2,747 sq. ft.
3501 E 3rd Place, Los Angeles, CA 90063
MLS# CRSR26014037Listed by: LPT REALTY, INC $1,500,000Active1 beds 1 baths
436 S Soto, Los Angeles, CA 90033
MLS# AR26014659Listed by: KW EXECUTIVE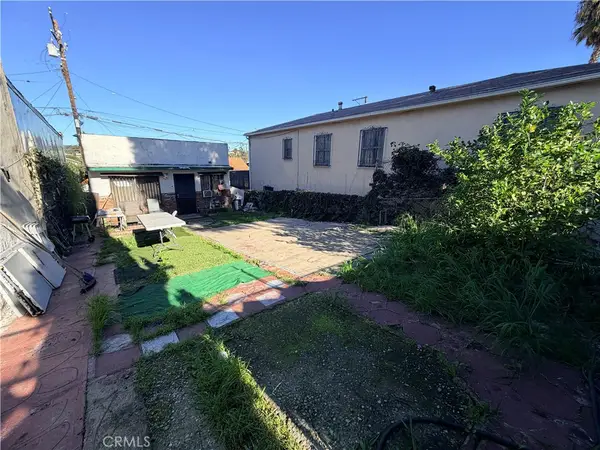 $525,000Active1 beds 1 baths418 sq. ft.
4257 City Terrace, East Los Angeles, CA 90063
MLS# WS26014544Listed by: KW EXECUTIVE $699,000Active-- beds -- baths4,176 sq. ft.
1101 N Rowan, Los Angeles, CA 90063
MLS# DW26013480Listed by: CENTURY 21 ALLSTARS- $95,000Active0.16 Acres
2721 N Onyxdr, Los Angeles, CA 90032
MLS# CRSB26013227Listed by: KELLER WILLIAMS REALTY - $85,000Active0.14 Acres
2815 N Round, Los Angeles, CA 90032
MLS# CRSB26013235Listed by: KELLER WILLIAMS REALTY  $799,990Active5 beds 2 baths1,206 sq. ft.
3224 Griffin, Los Angeles, CA 90031
MLS# SW25269246Listed by: KELLER WILLIAMS, THE LAKES $1,288,000Active-- beds -- baths5,930 sq. ft.
701 N Fickett, Los Angeles, CA 90033
MLS# PW26012751Listed by: ONE GROUP REALTY $929,900Pending5 beds -- baths2,283 sq. ft.
624 S Chicago Street, Los Angeles, CA 90023
MLS# CL26639657Listed by: ERNEST & COOPER REALTY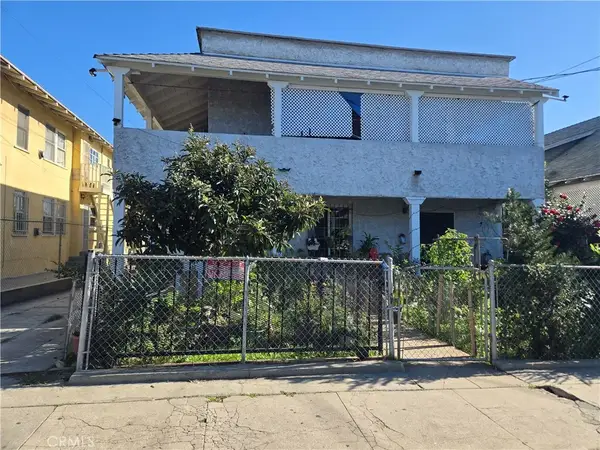 $799,000Active4 beds 2 baths
924 Euclid, Los Angeles, CA 90023
MLS# MB26012209Listed by: SAND MANAGEMENT GROUP $995,000Active6 beds 3 baths2,166 sq. ft.
6100 Southside Drive, East Los Angeles, CA 90022
MLS# DW26010836Listed by: 24 HOUR REAL ESTATE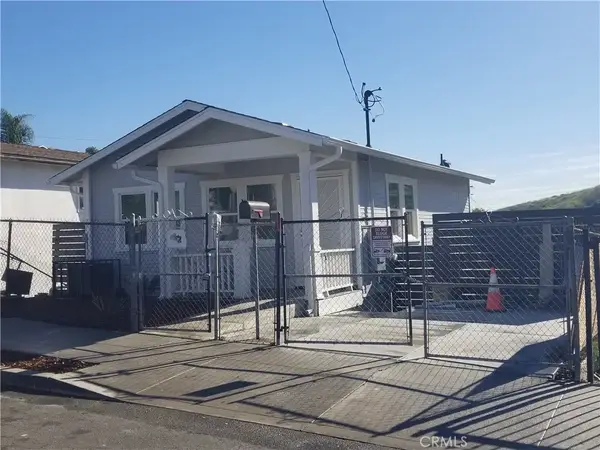 $729,900Active2 beds 2 baths860 sq. ft.
4620 Twining, Los Angeles, CA 90032
MLS# MB26011906Listed by: GEORGE MICHAEL REALTY $599,999Pending3 beds 2 baths1,350 sq. ft.
360 W Avenue 26 #419, Los Angeles, CA 90031
MLS# CRSR26011243Listed by: HILLCREST PROPERTIES $775,000Active5 beds -- baths1,672 sq. ft.
448 S Evergreen, East Los Angeles, CA 90033
MLS# CRGD26011674Listed by: KELLER WILLIAMS R. E. SERVICES $500,000Active3 beds 2 baths1,454 sq. ft.
2021 Darwin Avenue, Los Angeles, CA 90031
MLS# DW26011045Listed by: CENTURY 21 REALTY MASTERS $749,000Active7 beds -- baths2,116 sq. ft.
4616 Hammel, Los Angeles, CA 90022
MLS# CRDW26010965Listed by: DLP REALTY SALES & LOANS $840,000Active3 beds 3 baths1,780 sq. ft.
1420 Miller Avenue, Los Angeles, CA 90063
MLS# DW26009497Listed by: VIP RE FIRM $410,000Pending1 beds 1 baths902 sq. ft.
808 Record, Los Angeles, CA 90063
MLS# DW26009528Listed by: 24 HOUR REAL ESTATE $520,000Active2 beds 2 baths990 sq. ft.
360 W Avenue 26 #446, Los Angeles, CA 90031
MLS# 26632021Listed by: CHOICE 100 REALTY, INC. $540,000Active0.67 Acres
0 Marengo, Los Angeles, CA 90063
MLS# CRP1-25443Listed by: WETRUST REALTY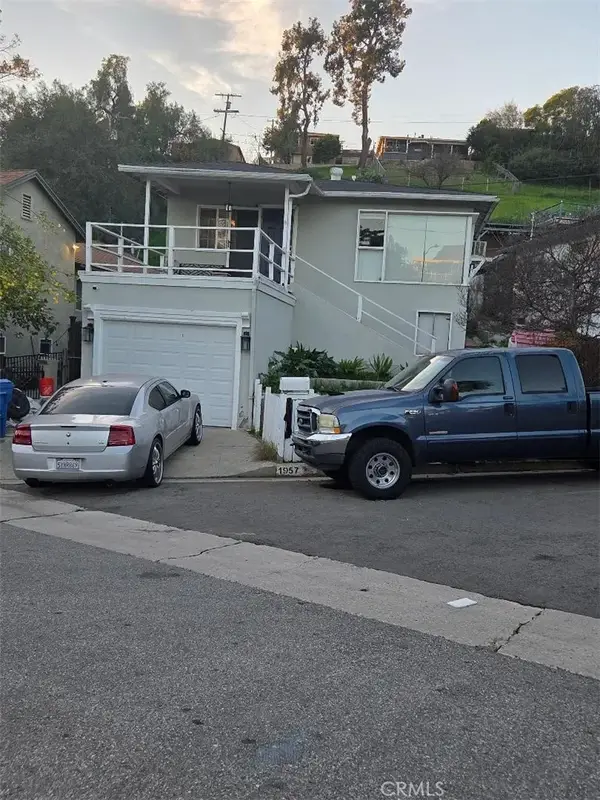 $850,000Active3 beds 2 baths1,431 sq. ft.
1957 Barnett, Los Angeles, CA 90032
MLS# DW26009949Listed by: COLDEWLL BANKER LEADERS $828,800Active-- beds -- baths2,184 sq. ft.
830 S Record Avenue, Los Angeles, CA 90023
MLS# AR26009498Listed by: COLDWELL BANKER DYNASTY T.C. $768,800Active-- beds -- baths1,984 sq. ft.
2500 Ganahl, Los Angeles, CA 90033
MLS# AR26009626Listed by: COLDWELL BANKER DYNASTY T.C.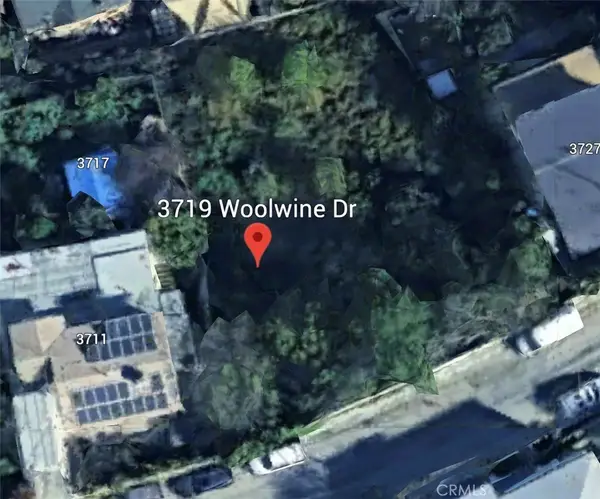 $79,500Active0.11 Acres
3719 Woolwine Drive, Los Angeles, CA 90063
MLS# SB26009354Listed by: VISTA SOTHEBYS INTERNATIONAL REALTY $1,980,000Active12 beds 9 baths
3020 Baldwin Street, Los Angeles, CA 90031
MLS# AR26008073Listed by: RE/MAX PREMIER PROP ARCADIA $3,795,000Active-- beds -- baths12,352 sq. ft.
2107 E Cesar E Chavez Avenue, Los Angeles, CA 90033
MLS# 26633243Listed by: THE COLLECTIVE REALTY
Local realty services provided by:CENTURY 21 Allstars, CENTURY 21 Sierra Properties, CENTURY 21 Affiliated, CENTURY 21 Jordan-Link
The information being provided by California Regional MLS (Southern California) is for the consumer's personal, non-commercial use and may not be used for any purpose other than to identify prospective properties consumer may be interested in purchasing. Any information relating to real estate for sale referenced on this web site comes from the Internet Data Exchange (IDX) program of the California Regional MLS (Southern California). CENTURY 21 Allstars is not a Multiple Listing Service (MLS), nor does it offer MLS access. This website is a service of CENTURY 21 Allstars, a broker participant of California Regional MLS (Southern California). This web site may reference real estate listing(s) held by a brokerage firm other than the broker and/or agent who owns this web site.
The accuracy of all information, regardless of source, including but not limited to open house information, square footages and lot sizes, is deemed reliable but not guaranteed and should be personally verified through personal inspection by and/or with the appropriate professionals. The data contained herein is copyrighted by California Regional MLS (Southern California) and is protected by all applicable copyright laws. Any unauthorized dissemination of this information is in violation of copyright laws and is strictly prohibited.
Copyright 2021 California Regional MLS (Southern California). All rights reserved.
This information is deemed reliable but not guaranteed. You should rely on this information only to decide whether or not to further investigate a particular property. BEFORE MAKING ANY OTHER DECISION, YOU SHOULD PERSONALLY INVESTIGATE THE FACTS (e.g. square footage and lot size) with the assistance of an appropriate professional. You may use this information only to identify properties you may be interested in investigating further. All uses except for personal, non-commercial use in accordance with the foregoing purpose are prohibited. Redistribution or copying of this information, any photographs or video tours is strictly prohibited. This information is derived from the Internet Data Exchange (IDX) service provided by San Diego MLS®. Displayed property listings may be held by a brokerage firm other than the broker and/or agent responsible for this display. The information and any photographs and video tours and the compilation from which they are derived is protected by copyright. Compilation © 2020 San Diego MLS®, Inc.
Popular neighborhoods near The Eastside, Los Angeles, CA
Zip codes near The Eastside, Los Angeles, CA
- 90011 homes for sale
- 90012 homes for sale
- 90013 homes for sale
- 90014 homes for sale
- 90015 homes for sale
- 90017 homes for sale
- 90021 homes for sale
- 90022 homes for sale
- 90023 homes for sale
- 90026 homes for sale
- 90031 homes for sale
- 90032 homes for sale
- 90033 homes for sale
- 90042 homes for sale
- 90057 homes for sale
- 90063 homes for sale
- 90065 homes for sale
- 90270 homes for sale
- 91754 homes for sale
- 91803 homes for sale
Counties near The Eastside, Los Angeles, CA
Protect your home and budget from life's surprises with an Assurant Home Warranty, backed by a partner that supports you through every step of homeownership. Explore Plans.
©2026 Century 21 Real Estate LLC. All rights reserved. CENTURY 21®, the CENTURY 21 Logo and C21® are service marks owned by Century 21 Real Estate LLC. Century 21 Real Estate LLC fully supports the principles of the Fair Housing Act and the Equal Opportunity Act. Each office is independently owned and operated. Listing information is deemed reliable but not guaranteed accurate.