- Berkshire Lakes, Naples homes for sale
- Berkshire Village, Naples homes for sale
- Blue Heron the Sanctuary, Naples homes for sale
- Blue Sky's, Naples homes for sale
- Bretonne Park, Naples homes for sale
- Cape Sable Lakes, Naples homes for sale
- Cedar Hammock Golf & Country Club, Naples homes for sale
- Countryside Golf and Country Club, Naples homes for sale
- Falling Waters, Naples homes for sale
- Forest Park, Naples homes for sale
- Granada Lakes Villas, Naples homes for sale
- Moon Lake, Naples homes for sale
- Naples Heritage, Naples homes for sale
- Plantation, Naples homes for sale
- Sabal Lake, Naples homes for sale
- Sapphire Lakes, Naples homes for sale
- The Shores, Naples homes for sale
- The Villas of Whittenberg, Naples homes for sale
- Twelve Lakes, Naples homes for sale
- Windjammer Village, Naples homes for sale
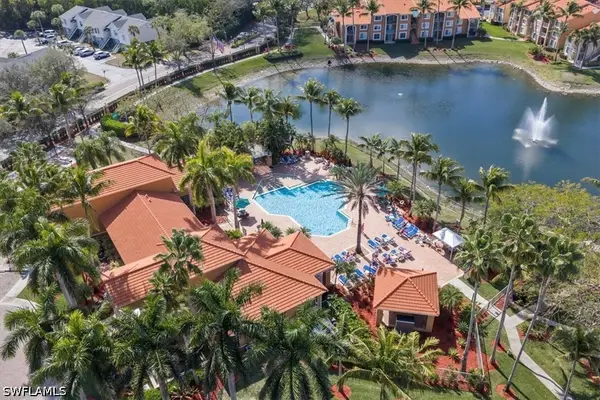
The Enclave at Naples, Naples, FL - homes for sale
16 of 16 results displayed
- New
 $270,000Active3 beds 2 baths1,219 sq. ft.
1210 Wildwood Lakes Boulevard #306, Naples, FL 34104
MLS# 226013014Listed by: COLDWELL BANKER REALTY 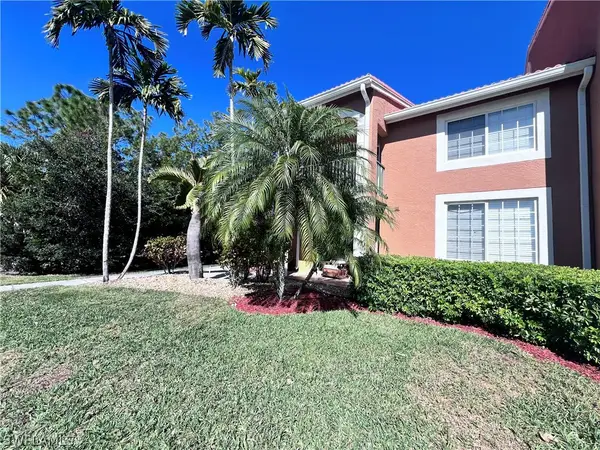 $215,000Active1 beds 1 baths670 sq. ft.
1240 Wildwood Lakes Boulevard N #101, Naples, FL 34104
MLS# 226007106Listed by: SIGNATURE INTL PREMIER PROPERT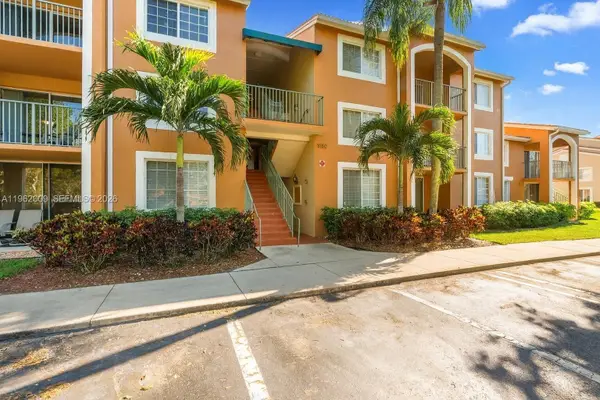 $275,000Active2 beds 2 baths1,042 sq. ft.
1150 Wildwood Lakes Blvd #203, Naples, FL 34104
MLS# A11962009Listed by: COLDWELL BANKER REALTY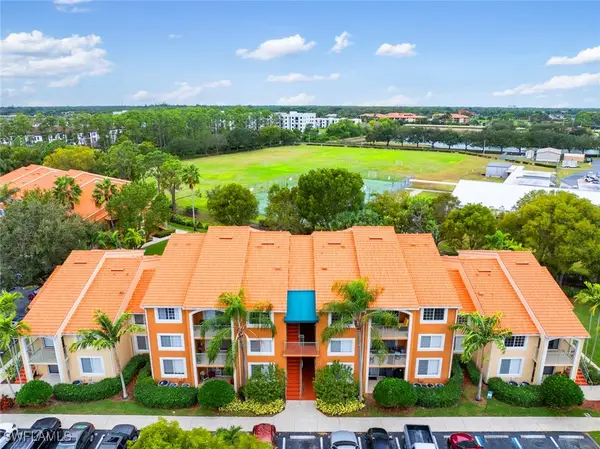 $249,000Active2 beds 2 baths1,042 sq. ft.
1180 Wildwood Lakes Boulevard #303, Naples, FL 34104
MLS# 226004973Listed by: DOUGLAS ELLIMAN FLORIDA, LLC $310,000Active3 beds 2 baths1,219 sq. ft.
1210 Wildwood Lakes Boulevard #203, Naples, FL 34104
MLS# 2026003973Listed by: VENTURE HOMES REALTY LLC $236,490Pending1 beds 1 baths670 sq. ft.
1260 Wildwood Lakes Boulevard #108, Naples, FL 34104
MLS# 226001551Listed by: REALTY ONE GROUP MVP $235,000Active1 beds 1 baths670 sq. ft.
1150 Wildwood Lakes Boulevard #8-107, Naples, FL 34104
MLS# 225082566Listed by: KEY & LEGACY REALTY LLC $267,000Active3 beds 2 baths1,219 sq. ft.
1230 Wildwood Lakes Boulevard #105, Naples, FL 34104
MLS# 225076654Listed by: WATERFRONT REALTY GROUP INC $214,900Pending2 beds 2 baths1,042 sq. ft.
1260 Wildwood Lakes Boulevard #305, Naples, FL 34104
MLS# 225076877Listed by: WATERFRONT REALTY GROUP INC $285,000Active3 beds 2 baths1,219 sq. ft.
1210 Wildwood Lakes Boulevard #306, Naples, FL 34104
MLS# 225073413Listed by: COLDWELL BANKER REALTY $255,000Pending2 beds 2 baths1,042 sq. ft.
1190 Wildwood Lakes Boulevard #105, Naples, FL 34104
MLS# 225071737Listed by: NAPLES HOMES AND RENTALS INC $220,000Pending2 beds 1 baths909 sq. ft.
1160 Wildwood Lakes Boulevard #9-108, Naples, FL 34104
MLS# 225065083Listed by: KELLER WILLIAMS ELEVATE LUXURY $234,900Active2 beds 2 baths1,042 sq. ft.
1260 Wildwood Lakes Boulevard #204, Naples, FL 34104
MLS# 225058310Listed by: DOWNING FRYE REALTY INC. $272,900Active1 beds 1 baths670 sq. ft.
1265 Wildwood Lakes Boulevard #208, Naples, FL 34104
MLS# 225056836Listed by: REALTY ONE GROUP MVP $259,000Active1 beds 1 baths670 sq. ft.
1265 Wildwood Lakes Boulevard #102, Naples, FL 34104
MLS# 225042819Listed by: REALTY ONE GROUP MVP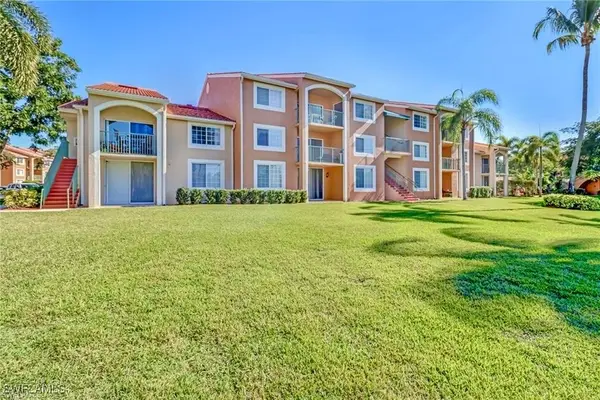 $255,000Active1 beds 1 baths700 sq. ft.
1185 Wildwood Lakes Boulevard #101, Naples, FL 34104
MLS# 225063201Listed by: REALTY HUB
Local realty services provided by:CENTURY 21 SUNBELT REALTY, CENTURY 21 Circle
Information deemed reliable but not guaranteed. Information is provided, in part, by Greater Miami MLS. This information being provided is for consumer's personal, non-commercial use and may not be used for any other purpose other than to identify prospective properties consumers may be interested in purchasing.
Popular neighborhoods near The Enclave at Naples, Naples, FL
Zip codes near The Enclave at Naples, Naples, FL
- 33928 homes for sale
- 33931 homes for sale
- 34102 homes for sale
- 34103 homes for sale
- 34104 homes for sale
- 34105 homes for sale
- 34108 homes for sale
- 34109 homes for sale
- 34110 homes for sale
- 34112 homes for sale
- 34113 homes for sale
- 34114 homes for sale
- 34116 homes for sale
- 34117 homes for sale
- 34119 homes for sale
- 34120 homes for sale
- 34134 homes for sale
- 34135 homes for sale
- 34140 homes for sale
- 34145 homes for sale
Counties near The Enclave at Naples, Naples, FL
- Broward County homes for sale
- Charlotte County homes for sale
- Collier County homes for sale
- DeSoto County homes for sale
- Glades County homes for sale
- Hardee County homes for sale
- Hendry County homes for sale
- Highlands County homes for sale
- Lee County homes for sale
- Manatee County homes for sale
- Miami-Dade County homes for sale
- Monroe County homes for sale
- Okeechobee County homes for sale
- Palm Beach County homes for sale
- Sarasota County homes for sale
Protect your home and budget from life's surprises with an Assurant Home Warranty, backed by a partner that supports you through every step of homeownership. Explore Plans.
©2026 Century 21 Real Estate LLC. All rights reserved. CENTURY 21®, the CENTURY 21 Logo and C21® are service marks owned by Century 21 Real Estate LLC. Century 21 Real Estate LLC fully supports the principles of the Fair Housing Act and the Equal Opportunity Act. Each office is independently owned and operated. Listing information is deemed reliable but not guaranteed accurate.