- Collins Garden, San Antonio homes for sale
- El Charro, San Antonio homes for sale
- Englewood, San Antonio homes for sale
- Gillette Area, San Antonio homes for sale
- Greater Gardendale, San Antonio homes for sale
- Historic Westside, San Antonio homes for sale
- Hot Wells Mission Reach, San Antonio homes for sale
- King William, San Antonio homes for sale
- Kingsborough Ridge, San Antonio homes for sale
- Lone Star, San Antonio homes for sale
- Mission San Jose, San Antonio homes for sale
- Palm Heights, San Antonio homes for sale
- Quintana, San Antonio homes for sale
- Riverside, San Antonio homes for sale
- Riverside South, San Antonio homes for sale
- Roosevelt Park, San Antonio homes for sale
- San Juan Gardens, San Antonio homes for sale
- South Southwest, San Antonio homes for sale
- Thelka, San Antonio homes for sale
- Thompson, San Antonio homes for sale
Tierra Linda, San Antonio, TX - homes for sale
22 of 22 results displayed
- New
 $302,999Active4 beds 3 baths2,288 sq. ft.
1422 Caceres Spur, San Antonio, TX 78224
MLS# 1952178Listed by: MARTI REALTY GROUP - New
 $317,999Active4 beds 4 baths2,149 sq. ft.
1438 Leticia Glen, San Antonio, TX 78224
MLS# 1952182Listed by: MARTI REALTY GROUP - New
 $194,500Active3 beds 2 baths1,412 sq. ft.
1210 Mccauley, San Antonio, TX 78224
MLS# 1950990Listed by: PARTNERS REALTY  $169,900Active3 beds 2 baths1,296 sq. ft.
1721 Brunswick Blvd., San Antonio, TX 78211
MLS# 1947759Listed by: 1ST CHOICE REALTY GROUP $210,000Active3 beds 2 baths1,276 sq. ft.
4111 Imogene Ivy, San Antonio, TX 78211
MLS# 1947428Listed by: MALOUFF REALTY, LLC $58,500Pending0.14 Acres
1402 Gerald, San Antonio, TX 78211
MLS# 1943884Listed by: LPT REALTY, LLC $236,000Active4 beds 2 baths1,200 sq. ft.
110 Whitman, San Antonio, TX 78211
MLS# 1939648Listed by: LIFESTYLES REALTY HOUSTON INC. $267,000Active3 beds 3 baths1,679 sq. ft.
507 Linden, San Antonio, TX 78211
MLS# 1939216Listed by: REAL BROKER, LLC $119,900Active2 beds 1 baths600 sq. ft.
871 W Harlan, San Antonio, TX 78211
MLS# 1938980Listed by: MALOUFF REALTY, LLC $30,000Active0.05 Acres
1537 Flanders, San Antonio, TX 78211
MLS# 1937646Listed by: VORTEX REALTY $216,946Active3 beds 2 baths1,652 sq. ft.
1051 Fitch St, San Antonio, TX 78211
MLS# 1937273Listed by: WATTERS INTERNATIONAL REALTY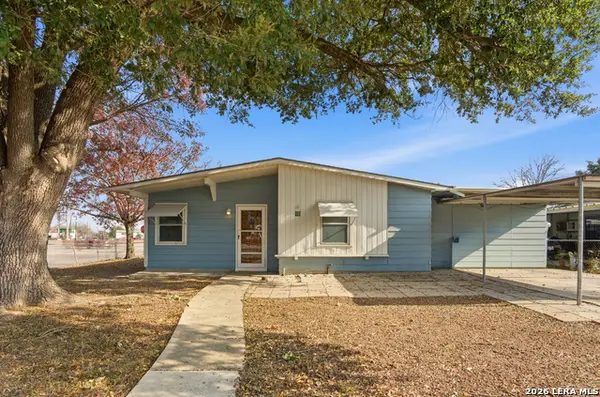 $235,000Active5 beds 3 baths1,836 sq. ft.
10 Whitman, San Antonio, TX 78211
MLS# 1936641Listed by: TRUE VALOR REALTY $162,900Active4 beds 3 baths1,302 sq. ft.
512 Vickers Avenue, San Antonio, TX 78211
MLS# 70245899Listed by: LEVITATE REAL ESTATE $149,900Active3 beds 2 baths1,394 sq. ft.
216 Milvid, San Antonio, TX 78211
MLS# 1927175Listed by: VORTEX REALTY $196,460Active3 beds 1 baths1,047 sq. ft.
1207 W Gerald A, San Antonio, TX 78211
MLS# 1919892Listed by: JB GOODWIN, REALTORS $224,900Active3 beds 2 baths1,440 sq. ft.
10155 Asta Trail, San Antonio, TX 78224
MLS# 1919270Listed by: PATRIOT REALTY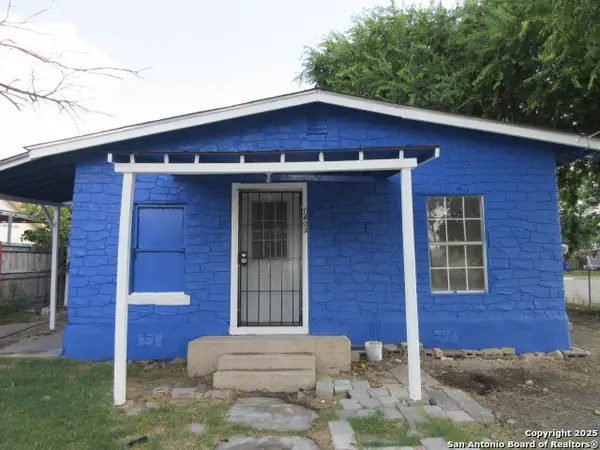 $99,900Active2 beds 1 baths660 sq. ft.
1403 Brunswick, San Antonio, TX 78211
MLS# 1917926Listed by: PARTNERS REALTY $39,700Pending3 beds 1 baths1,104 sq. ft.
1026 Fitch, San Antonio, TX 78211
MLS# 1915296Listed by: JOSEPH WALTER REALTY, LLC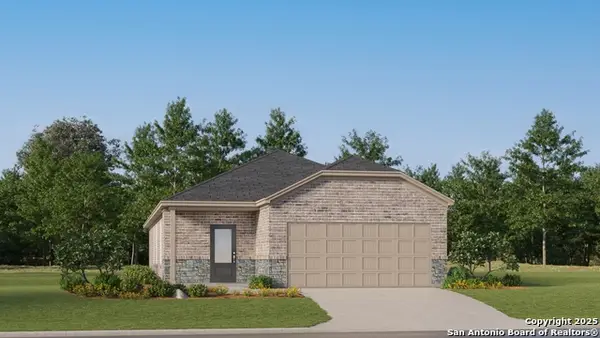 $254,999Active3 beds 2 baths1,657 sq. ft.
1406 Caceres Spur, San Antonio, TX 78224
MLS# 1913663Listed by: MARTI REALTY GROUP $235,000Active3 beds 2 baths1,407 sq. ft.
862 W Southcross, San Antonio, TX 78211
MLS# 1909899Listed by: PHYLLIS BROWNING COMPANY $97,000Pending3 beds 1 baths913 sq. ft.
10 Linden, San Antonio, TX 78211
MLS# 1909369Listed by: LISTWITHFREEDOM.COM $267,000Active3 beds 3 baths1,679 sq. ft.
505 Linden, San Antonio, TX 78211
MLS# 1895329Listed by: REAL BROKER, LLC
Local realty services provided by:CENTURY 21 Middleton, CENTURY 21 Judge Fite Company
Copyright 2026, Houston Realtors Information Service, Inc. All information provided is deemed reliable but is not guaranteed and should be independently verified. IDX information is provided exclusively for consumers' personal, non-commercial use, it may not be used for any purpose other than to identify prospective properties consumers may be interested in purchasing, and the data is deemed reliable but is not guaranteed accurate by the MLS.
Popular neighborhoods near Tierra Linda, San Antonio, TX
Zip codes near Tierra Linda, San Antonio, TX
- 78202 homes for sale
- 78203 homes for sale
- 78204 homes for sale
- 78205 homes for sale
- 78206 homes for sale
- 78207 homes for sale
- 78208 homes for sale
- 78210 homes for sale
- 78211 homes for sale
- 78212 homes for sale
- 78214 homes for sale
- 78215 homes for sale
- 78221 homes for sale
- 78224 homes for sale
- 78225 homes for sale
- 78226 homes for sale
- 78228 homes for sale
- 78236 homes for sale
- 78237 homes for sale
- 78242 homes for sale
Counties near Tierra Linda, San Antonio, TX
- Atascosa County homes for sale
- Bandera County homes for sale
- Bexar County homes for sale
- Blanco County homes for sale
- Caldwell County homes for sale
- Comal County homes for sale
- DeWitt County homes for sale
- Frio County homes for sale
- Gillespie County homes for sale
- Gonzales County homes for sale
- Guadalupe County homes for sale
- Hays County homes for sale
- Karnes County homes for sale
- Kendall County homes for sale
- Kerr County homes for sale
- Live Oak County homes for sale
- McMullen County homes for sale
- Medina County homes for sale
- Uvalde County homes for sale
- Wilson County homes for sale
Protect your home and budget from life's surprises with an Assurant Home Warranty, backed by a partner that supports you through every step of homeownership. Explore Plans.
©2026 Century 21 Real Estate LLC. All rights reserved. CENTURY 21®, the CENTURY 21 Logo and C21® are service marks owned by Century 21 Real Estate LLC. Century 21 Real Estate LLC fully supports the principles of the Fair Housing Act and the Equal Opportunity Act. Each office is independently owned and operated. Listing information is deemed reliable but not guaranteed accurate.