- Casas Adobes homes for sale
- Catalina Foothills homes for sale
- Corona De Tucson homes for sale
- Drexel Heights homes for sale
- Flowing Wells homes for sale
- Green Valley homes for sale
- Mt Lemmon homes for sale
- Oro Valley homes for sale
- Picture Rocks homes for sale
- Rincon Valley homes for sale
- Sahuarita homes for sale
- South Tucson homes for sale
- Summit homes for sale
- Tanque Verde homes for sale
- Three Points homes for sale
- Tucson homes for sale
- Tucson Estates homes for sale
- Tucson Mountains homes for sale
- Vail homes for sale
- Valencia West homes for sale
85706, AZ - homes for sale
113 of 113 results displayed
- New
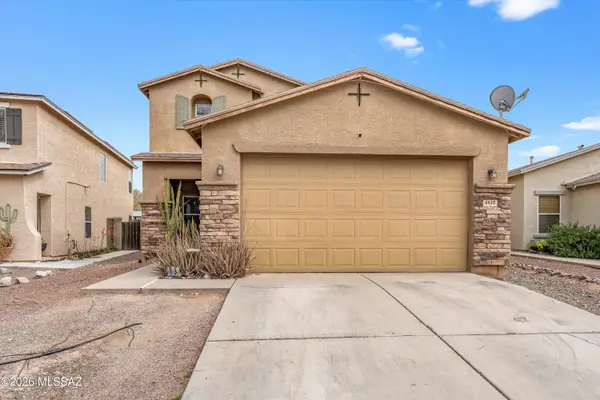 $350,000Active5 beds 3 baths2,530 sq. ft.
6435 S Sunrise Valley, Tucson, AZ 85706
MLS# 22606760Listed by: BERKSHIRE HATHAWAY HOMESERVICES ARIZONA PROPERTIES
- New
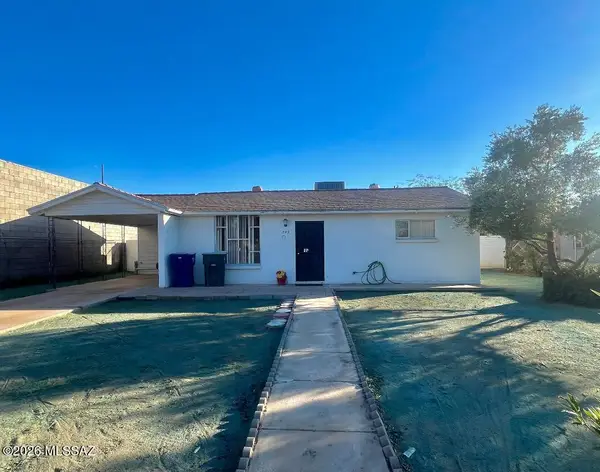 $169,900Active2 beds 2 baths1,008 sq. ft.
809 W Milton, Tucson, AZ 85706
MLS# 22606701Listed by: TIERRA ANTIGUA REALTY - New
 $425,990Active4 beds 3 baths2,344 sq. ft.
7577 S Ray Carroll, Tucson, AZ 85747
MLS# 22606421Listed by: LENNAR SALES CORP. - New
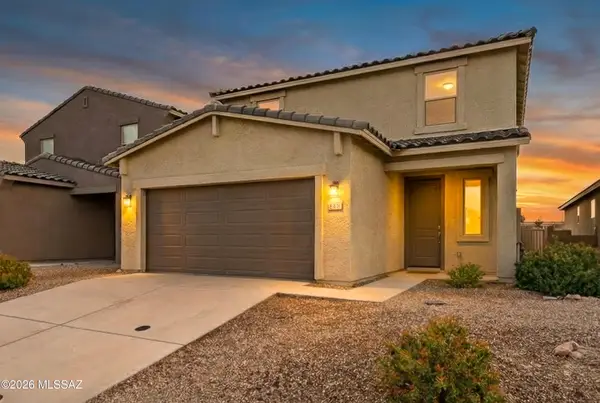
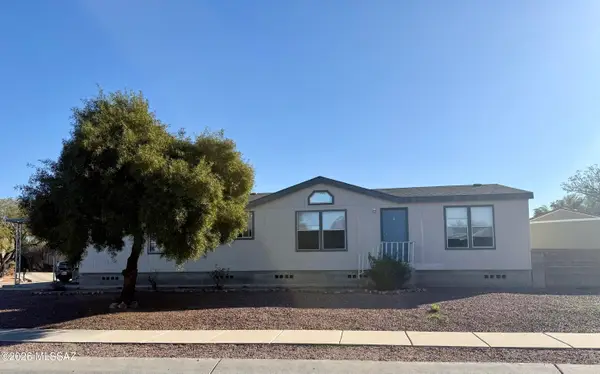 $250,000Active3 beds 2 baths1,624 sq. ft.
2854 E Cottonwood Club, Tucson, AZ 85706
MLS# 22604371Listed by: TIERRA ANTIGUA REALTY - New
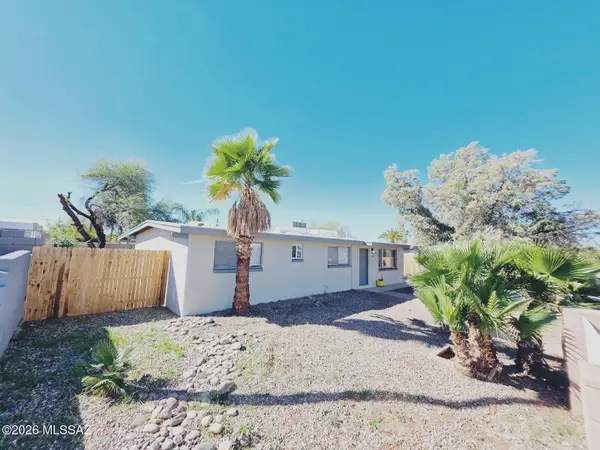
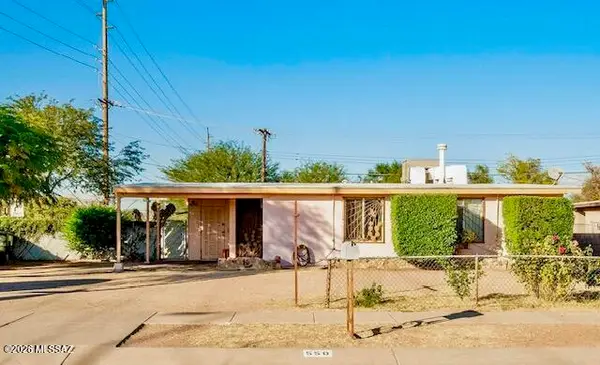
 $280,000Active3 beds 2 baths1,300 sq. ft.
2521 E Knightsbridge, Tucson, AZ 85706
MLS# 22606267Listed by: RIO NUEVO REALTY LLC - New
 $279,900Active4 beds 2 baths1,324 sq. ft.
4272 E Frankfort, Tucson, AZ 85706
MLS# 22606226Listed by: REALTY ONE GROUP INTEGRITY - New
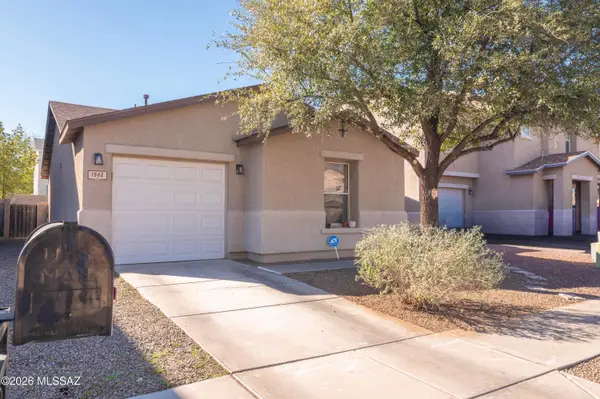
 $269,900Active2 beds 2 baths988 sq. ft.
938 W Connecticut, Tucson, AZ 85706
MLS# 22606191Listed by: REAL BROKER - New
 $284,900Active3 beds 2 baths1,663 sq. ft.
5032 S Cassia, Tucson, AZ 85706
MLS# 22606188Listed by: REAL BROKER - New
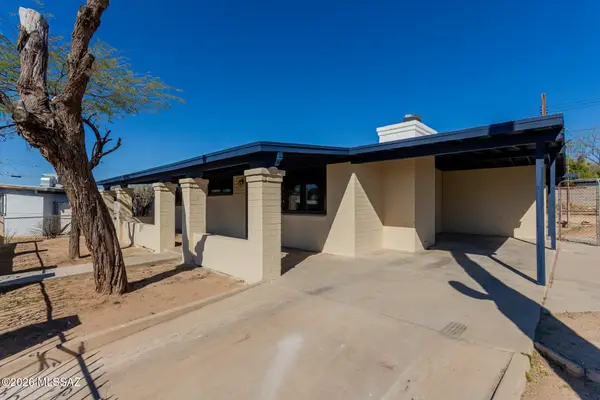
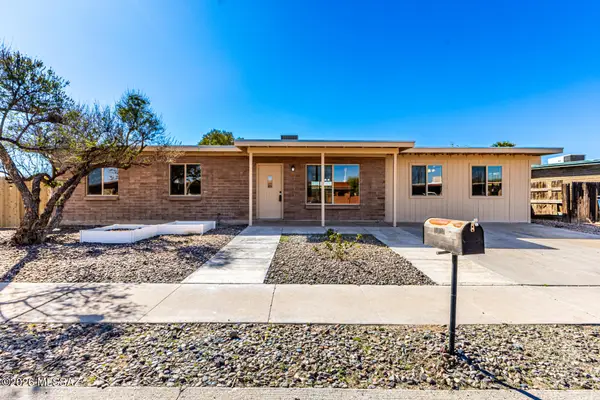
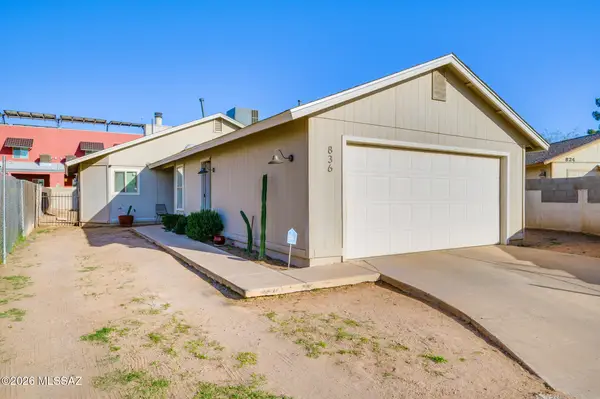 $265,000Active3 beds 2 baths1,392 sq. ft.
836 E Oregon, Tucson, AZ 85706
MLS# 22606181Listed by: TIERRA ANTIGUA REALTY - New
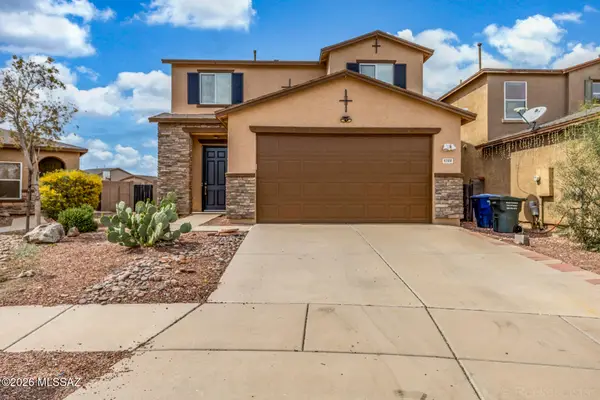 $325,000Active3 beds 3 baths2,010 sq. ft.
6308 S Desert Range, Tucson, AZ 85706
MLS# 22605975Listed by: EXIT REALTY LIVING LEGACY - New
 $325,000Active3 beds 2 baths1,395 sq. ft.
6448 S Bright Sun, Tucson, AZ 85706
MLS# 22605992Listed by: REAL BROKER - New
 $155,000Active3 beds 2 baths1,344 sq. ft.
4098 E White Water, Tucson, AZ 85706
MLS# 22605945Listed by: OMNI HOMES INTERNATIONAL - New
 $279,900Active3 beds 2 baths1,016 sq. ft.
5525 S Alaska, Tucson, AZ 85706
MLS# 22605867Listed by: REALTY EXECUTIVES ARIZONA TERRITORY - New
 $285,000Active3 beds 2 baths1,315 sq. ft.
981 W Santa Maria, Tucson, AZ 85706
MLS# 22605807Listed by: REAL BROKER - Open Fri, 12 to 10pmNew
 $300,000Active3 beds 3 baths1,678 sq. ft.
351 W Hammerhead, Tucson, AZ 85706
MLS# 22605789Listed by: OPENDOOR BROKERAGE, LLC - New
 $335,000Active3 beds 2 baths1,284 sq. ft.
2400 E Camino Malcote, Tucson, AZ 85706
MLS# 22605706Listed by: INDIE REALTY, LLC  $275,000Active3 beds 2 baths1,305 sq. ft.
5601 S Masterson, Tucson, AZ 85706
MLS# 22605547Listed by: TIERRA ANTIGUA REALTY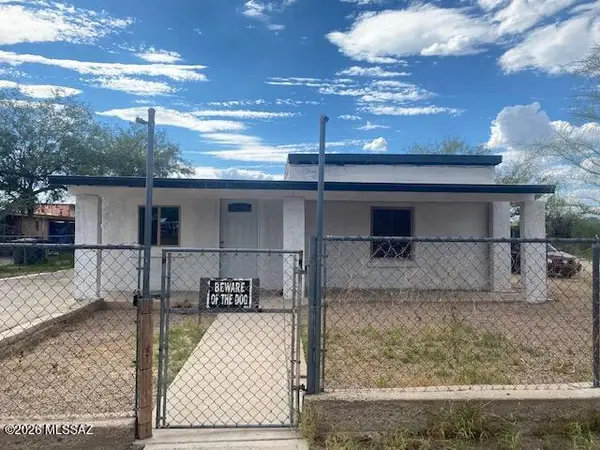 $450,000Active-- beds -- baths1,927 sq. ft.
5110 S 17th, Tucson, AZ 85706
MLS# 22605415Listed by: UNITED REAL ESTATE SPECIALISTS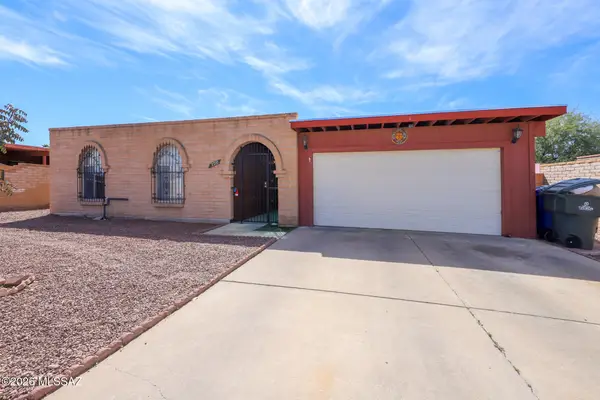 $310,000Active3 beds 2 baths1,463 sq. ft.
2210 E Oregon, Tucson, AZ 85706
MLS# 22605375Listed by: REALTY EXECUTIVES ARIZONA TERRITORY $245,000Active4 beds 2 baths1,456 sq. ft.
4130 E White Water, Tucson, AZ 85706
MLS# 22605310Listed by: REAL BROKER $274,900Active3 beds 2 baths1,271 sq. ft.
1634 E Calle Grandiosa, Tucson, AZ 85706
MLS# 22605255Listed by: GRIJALVA REALTY CORP.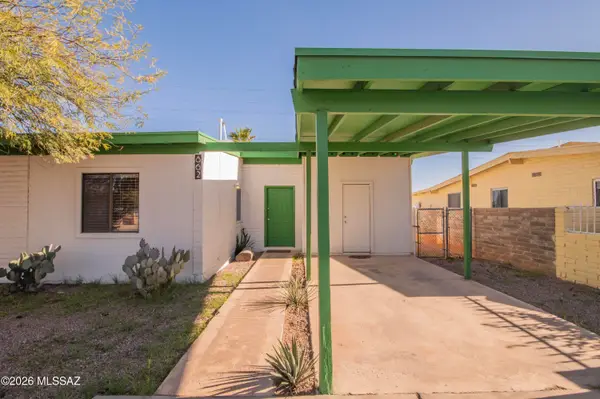 $244,999Active3 beds 2 baths1,065 sq. ft.
862 W Hawaii, Tucson, AZ 85706
MLS# 22605195Listed by: TIERRA ANTIGUA REALTY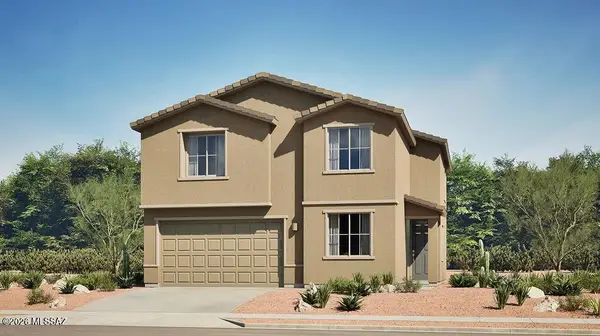 $437,990Active4 beds 3 baths2,535 sq. ft.
7583 S Ray Carroll, Tucson, AZ 85747
MLS# 22605086Listed by: LENNAR SALES CORP.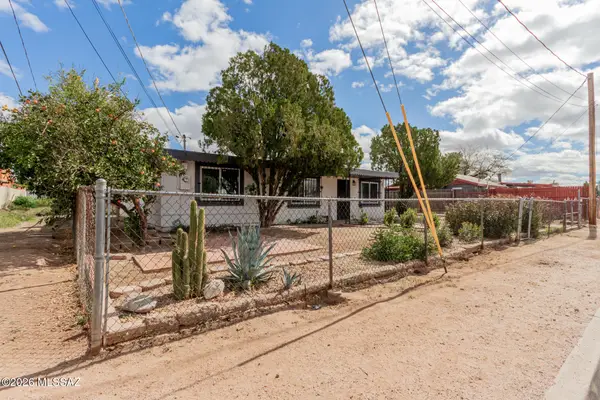 $265,000Active3 beds 2 baths1,304 sq. ft.
5017 S 11th, Tucson, AZ 85706
MLS# 22604964Listed by: REAL BROKER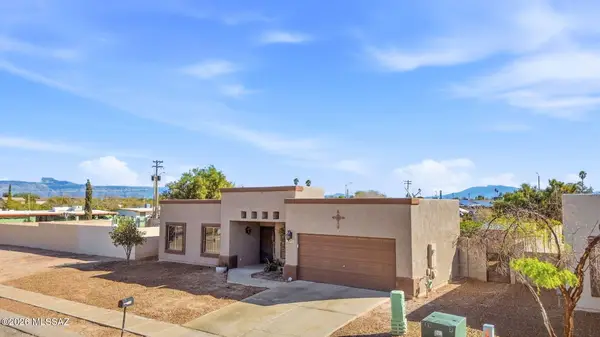 $275,000Active3 beds 2 baths1,336 sq. ft.
5923 S Avenida Bodega, Tucson, AZ 85706
MLS# 22604863Listed by: REALTY EXECUTIVES ARIZONA TERRITORY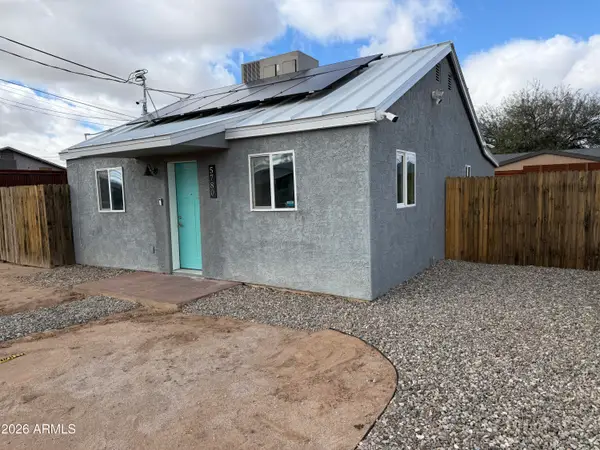 $258,000Active2 beds 1 baths813 sq. ft.
5780 S Southland Boulevard, Tucson, AZ 85706
MLS# 6987899Listed by: EXIT REALTY COANNAH- Open Fri, 7 to 9pm
 $422,370Active4 beds 3 baths2,220 sq. ft.
4818 E Greenway Wash, Tucson, AZ 85706
MLS# 22604850Listed by: RE/MAX PORTFOLIO HOMES  $225,000Active2 beds 1 baths1,004 sq. ft.
5596 S Monrovia, Tucson, AZ 85706
MLS# 22604790Listed by: TIERRA ANTIGUA REALTY $290,000Active3 beds 2 baths1,627 sq. ft.
1469 E Wedwick, Tucson, AZ 85706
MLS# 22604738Listed by: MY HOME GROUP $265,000Active4 beds 2 baths1,404 sq. ft.
4249 E Canada, Tucson, AZ 85706
MLS# 22604446Listed by: RE/MAX RESULTS $260,000Active2 beds 2 baths969 sq. ft.
1958 E Calle Corza, Tucson, AZ 85706
MLS# 22604410Listed by: TIERRA BUENA REALTY LLC $230,000Pending2 beds 2 baths1,043 sq. ft.
2164 E Calle Sierra Del Manantial, Tucson, AZ 85706
MLS# 22602973Listed by: REALTY EXECUTIVES ARIZONA TERRITORY $309,900Active3 beds 2 baths1,334 sq. ft.
2557 E Calle Joya De Ventura, Tucson, AZ 85706
MLS# 22604206Listed by: REAL BROKER $115,000Active2 beds 1 baths672 sq. ft.
5517 S Bonney, Tucson, AZ 85706
MLS# 22604175Listed by: REALTY EXECUTIVES ARIZONA TERRITORY $329,000Active3 beds 2 baths1,310 sq. ft.
5665 S Catalina, Tucson, AZ 85706
MLS# 22603966Listed by: REALTY EXECUTIVES ARIZONA TERRITORY $209,000Pending3 beds 2 baths1,792 sq. ft.
5850 S Bonney, Tucson, AZ 85706
MLS# 22603894Listed by: PRESIDENTIAL REALTY, LLC $249,900Active3 beds 2 baths1,253 sq. ft.
4210 E Canada, Tucson, AZ 85706
MLS# 22603719Listed by: AT HOME DESERT REALTY $210,000Pending5 beds 2 baths1,110 sq. ft.
225 W Calle Margarita, Tucson, AZ 85706
MLS# 22603606Listed by: ENGEL & VOLKERS TUCSON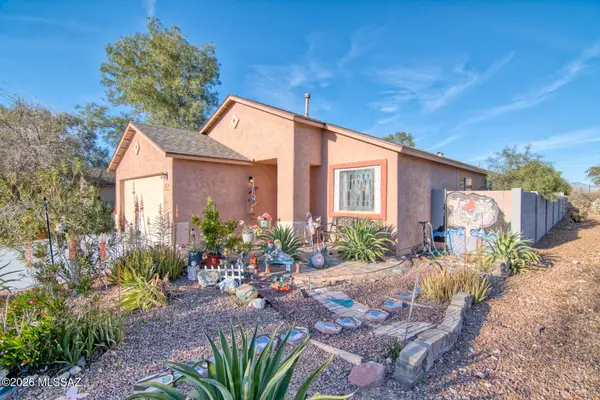 $320,000Active3 beds 2 baths1,511 sq. ft.
2579 E Paseo La Tierra Buena, Tucson, AZ 85706
MLS# 22603548Listed by: PEACH PROPERTIES HM, INC.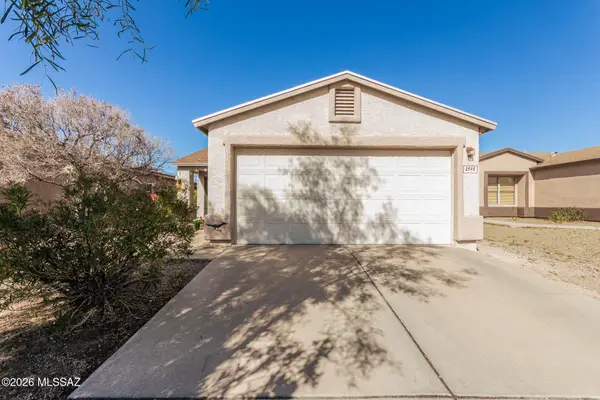 $249,900Active2 beds 2 baths958 sq. ft.
2595 E Warwick Castle, Tucson, AZ 85706
MLS# 22603552Listed by: LONG REALTY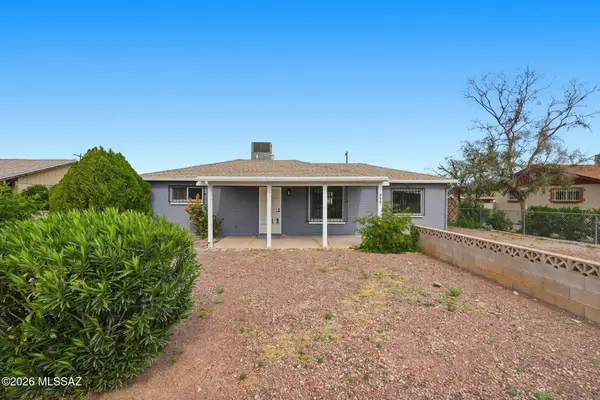 $224,900Pending2 beds 1 baths1,062 sq. ft.
950 W Calle Evelina, Tucson, AZ 85706
MLS# 22603522Listed by: GENTRY REAL ESTATE- Open Sat, 2 to 4pm
 $244,999Active2 beds 1 baths1,004 sq. ft.
1562 E Monrovia, Tucson, AZ 85706
MLS# 22603422Listed by: TIERRA ANTIGUA REALTY  $275,000Active2 beds 2 baths1,127 sq. ft.
1820 E Alaska, Tucson, AZ 85706
MLS# 22603381Listed by: KELLER WILLIAMS SOUTHERN ARIZONA $170,000Active2 beds 2 baths969 sq. ft.
2044 E Calle Sierra Del Manantial, Tucson, AZ 85706
MLS# 22603289Listed by: HOMESMART ADVANTAGE GROUP $296,000Active4 beds 2 baths1,176 sq. ft.
118 W Calle Margarita, Tucson, AZ 85706
MLS# 22602980Listed by: REALTY EXECUTIVES ARIZONA TERRITORY $279,000Active4 beds 3 baths1,535 sq. ft.
3780 E Felix, Tucson, AZ 85706
MLS# 22602862Listed by: OMNI HOMES INTERNATIONAL $169,900Active2 beds 1 baths891 sq. ft.
4973 S Highland, Tucson, AZ 85706
MLS# 22602734Listed by: KELLER WILLIAMS INTEGRITY FIRST $259,000Active2 beds 1 baths958 sq. ft.
5447 S Via Florena, Tucson, AZ 85706
MLS# 22602639Listed by: REALTY EXECUTIVES ARIZONA TERRITORY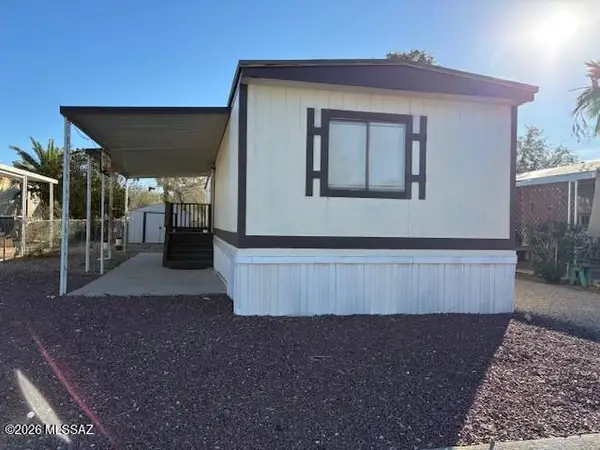 $85,000Active3 beds 2 baths1,008 sq. ft.
5600 S Country Club, Tucson, AZ 85706
MLS# 22602515Listed by: REALTY EXECUTIVES ARIZONA TERRITORY $250,000Active4 beds 2 baths1,668 sq. ft.
402 W Alaska, Tucson, AZ 85706
MLS# 22602433Listed by: REAL BROKER $210,000Active3 beds 2 baths1,063 sq. ft.
5315 S Champion, Tucson, AZ 85706
MLS# 22602387Listed by: TIERRA ANTIGUA REALTY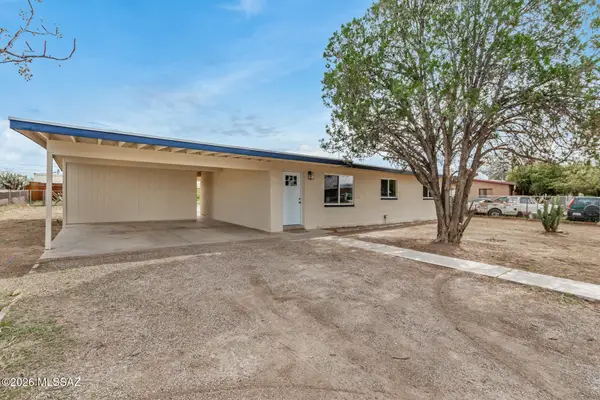 $279,900Active3 beds 2 baths1,092 sq. ft.
5917 S Euclid, Tucson, AZ 85706
MLS# 22602311Listed by: REAL BROKER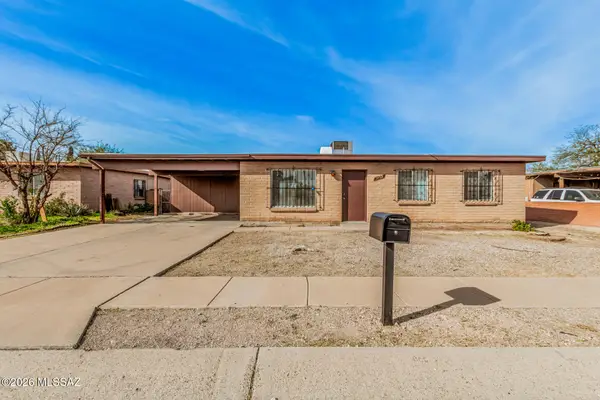 $235,000Active3 beds 2 baths1,058 sq. ft.
5402 S Jasmine, Tucson, AZ 85706
MLS# 22602255Listed by: REAL BROKER $279,900Pending3 beds 2 baths1,308 sq. ft.
6255 S High Hope, Tucson, AZ 85706
MLS# 22602181Listed by: ART SOFTLEY REAL ESTATE 01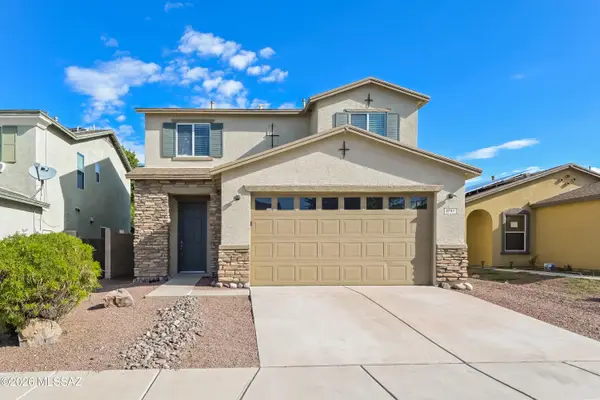 $315,000Pending4 beds 3 baths2,010 sq. ft.
3751 E Bright View, Tucson, AZ 85706
MLS# 22602063Listed by: MY HOME GROUP- Open Sun, 4 to 6pm
 $245,000Active2 beds 1 baths1,015 sq. ft.
5125 S Missiondale, Tucson, AZ 85706
MLS# 22602058Listed by: LONG REALTY  $450,000Active-- beds -- baths2,158 sq. ft.
5778 S Park, Tucson, AZ 85706
MLS# 22602033Listed by: ENGEL & VOLKERS TUCSON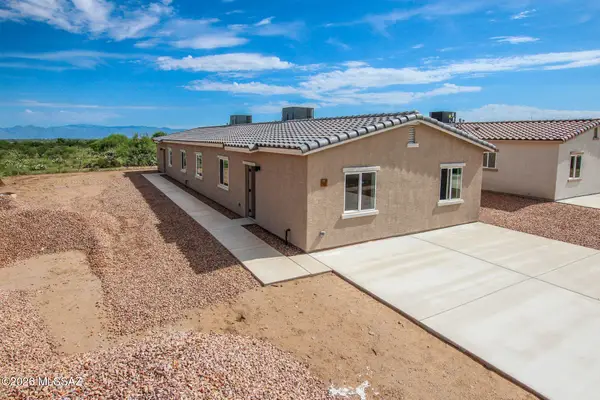 $450,000Active-- beds -- baths2,158 sq. ft.
5802 S Park, Tucson, AZ 85706
MLS# 22602042Listed by: ENGEL & VOLKERS TUCSON $450,000Active-- beds -- baths2,158 sq. ft.
5794 S Park, Tucson, AZ 85706
MLS# 22602038Listed by: ENGEL & VOLKERS TUCSON $285,000Active3 beds 2 baths1,255 sq. ft.
1694 E Calle Grandiosa, Tucson, AZ 85706
MLS# 22601974Listed by: TIERRA ANTIGUA REALTY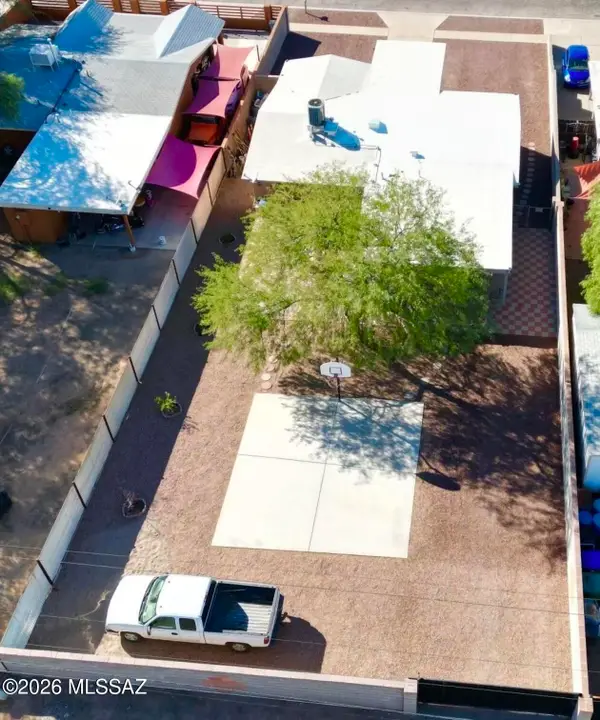 $270,000Active4 beds 2 baths1,332 sq. ft.
5841 S Herpa, Tucson, AZ 85706
MLS# 22601485Listed by: REALTY EXECUTIVES ARIZONA TERRITORY $277,000Active4 beds 2 baths1,218 sq. ft.
5335 S Fairland Park, Tucson, AZ 85706
MLS# 22601500Listed by: COLDWELL BANKER REALTY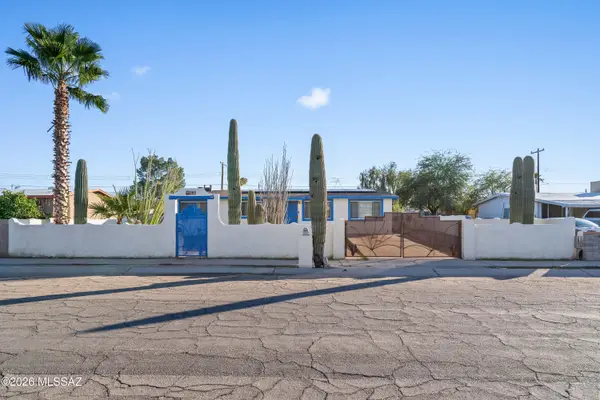 $280,000Active4 beds 1 baths1,225 sq. ft.
265 W Calle Antonia, Tucson, AZ 85706
MLS# 22601429Listed by: REALTY EXECUTIVES ARIZONA TERRITORY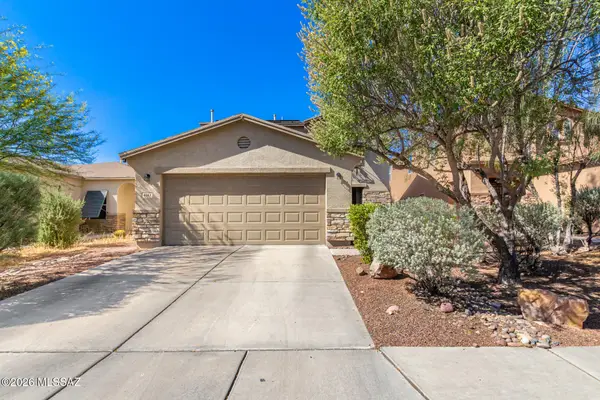 $275,000Active3 beds 3 baths1,629 sq. ft.
6383 S Sunrise Valley, Tucson, AZ 85706
MLS# 22601370Listed by: KELLER WILLIAMS INTEGRITY FIRST $259,990Active2 beds 1 baths850 sq. ft.
6235 S Blue Angels, Tucson, AZ 85706
MLS# 22601259Listed by: KB HOME SALES-TUCSON INC. $289,000Active3 beds 2 baths1,852 sq. ft.
943 W Calle Garcia, Tucson, AZ 85706
MLS# 22600877Listed by: REALTY EXECUTIVES ARIZONA TERRITORY $290,000Pending3 beds 2 baths1,446 sq. ft.
5965 S Placita Picacho El Diablo, Tucson, AZ 85706
MLS# 22600799Listed by: TIERRA ANTIGUA REALTY $282,000Active4 beds 2 baths1,573 sq. ft.
5449 S Pinta, Tucson, AZ 85706
MLS# 22600660Listed by: REAL BROKER $305,000Active4 beds 3 baths1,845 sq. ft.
6004 S Kirtley, Tucson, AZ 85706
MLS# 22531505Listed by: KELLER WILLIAMS INTEGRITY FIRST $397,000Active4 beds 3 baths2,220 sq. ft.
4722 E Julian Wash, Tucson, AZ 85706
MLS# 22602878Listed by: MY HOME GROUP $341,900Active4 beds 2 baths1,891 sq. ft.
858 W Santa Rosa, Tucson, AZ 85706
MLS# 22522536Listed by: REALTY ONE GROUP INTEGRITY $229,000Active3 beds 1 baths1,088 sq. ft.
758 W Santa Paula, Tucson, AZ 85706
MLS# 22524084Listed by: REALTY EXECUTIVES ARIZONA TERRITORY $266,990Active2 beds 1 baths1,015 sq. ft.
6219 S Blue Angels, Tucson, AZ 85706
MLS# 22528260Listed by: KB HOME SALES-TUCSON INC.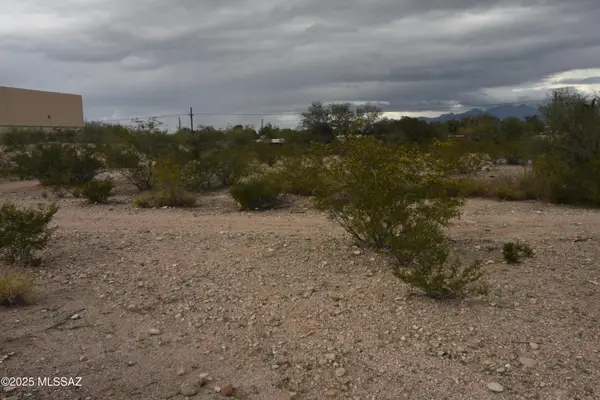 $485,000Active2.53 Acres
3441 E Global, Tucson, AZ 85706
MLS# 22530535Listed by: WESTAR MORTGAGE & REALTY CORPORATION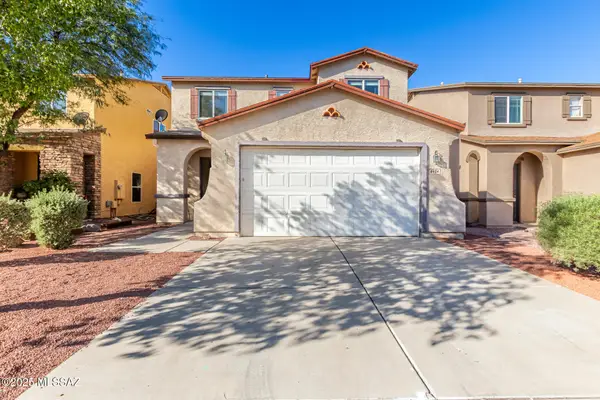 $333,900Active3 beds 3 baths2,010 sq. ft.
6424 S Bright Sun, Tucson, AZ 85706
MLS# 22532190Listed by: CITIEA $175,000Active3 beds 2 baths1,116 sq. ft.
965 W Milton, Tucson, AZ 85706
MLS# 22531578Listed by: PROVEN HOME REALTY $399,900Pending4 beds 2 baths1,776 sq. ft.
3985 E Market, Tucson, AZ 85706
MLS# 22531399Listed by: DRH PROPERTIES INC. $254,999Active4 beds 2 baths1,346 sq. ft.
801 W Hawaii, Tucson, AZ 85706
MLS# 22531268Listed by: REALTY EXECUTIVES ARIZONA TERRITORY- Open Sat, 1 to 3pm
 $277,000Active4 beds 2 baths1,803 sq. ft.
964 W Calle Alvord, Tucson, AZ 85706
MLS# 22531160Listed by: TIERRA ANTIGUA REALTY  $252,000Active3 beds 2 baths1,450 sq. ft.
4084 E White Water, Tucson, AZ 85706
MLS# 22531030Listed by: OMNI HOMES INTERNATIONAL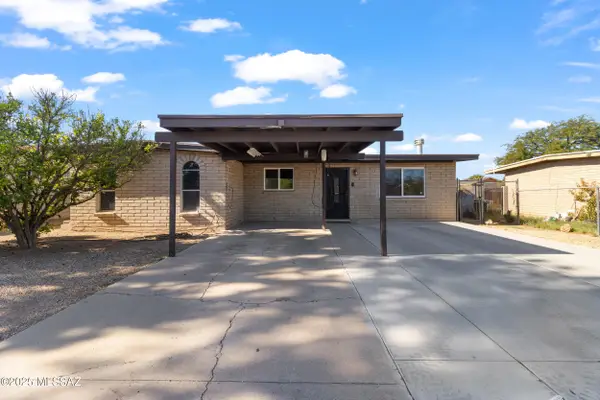 $275,000Pending3 beds 2 baths1,536 sq. ft.
5832 S Herpa, Tucson, AZ 85706
MLS# 22530740Listed by: REALTY ONE GROUP INTEGRITY $299,000Active3 beds 2 baths1,592 sq. ft.
3644 E Helena, Tucson, AZ 85706
MLS# 22530572Listed by: REALTY EXECUTIVES ARIZONA TERRITORY- Open Sun, 4 to 6pm
 $249,000Active3 beds 2 baths1,107 sq. ft.
5633 S Liberty, Tucson, AZ 85706
MLS# 22530258Listed by: OMNI HOMES INTERNATIONAL  $299,000Active3 beds 2 baths1,343 sq. ft.
4440 E Drexel, Tucson, AZ 85706
MLS# 22527778Listed by: KELLER WILLIAMS SOUTHERN ARIZONA $359,900Pending4 beds 2 baths1,776 sq. ft.
3990 E Market, Tucson, AZ 85706
MLS# 22529752Listed by: DRH PROPERTIES INC. $405,000Active5 beds 3 baths2,208 sq. ft.
6322 S Crescent Peak, Tucson, AZ 85706
MLS# 22529243Listed by: AZ FLAT FEE $284,999Active3 beds 2 baths1,284 sq. ft.
2464 E Camino Malcote, Tucson, AZ 85706
MLS# 22528348Listed by: OMNI HOMES INTERNATIONAL $284,990Active3 beds 2 baths1,262 sq. ft.
6227 S Blue Angels, Tucson, AZ 85706
MLS# 22528389Listed by: KB HOME SALES-TUCSON INC. $427,000Pending4 beds 3 baths2,264 sq. ft.
3984 E Market, Tucson, AZ 85706
MLS# 22528202Listed by: DRH PROPERTIES INC.- New
 $220,000Active2 beds 1 baths920 sq. ft.
550 W Calle Garcia, Tucson, AZ 85706
MLS# 22605991Listed by: TIERRA ANTIGUA REALTY  $319,900Pending3 beds 2 baths1,558 sq. ft.
3997 E Market, Tucson, AZ 85706
MLS# 22527402Listed by: DRH PROPERTIES INC. $300,000Active3 beds 2 baths1,663 sq. ft.
1341 E Bilby, Tucson, AZ 85706
MLS# 22525224Listed by: OMNI HOMES INTERNATIONAL $116,960Pending3 beds 3 baths1,402 sq. ft.
5846 S Del Moral, Tucson, AZ 85706
MLS# 22526374Listed by: BANG REALTY- ARIZONA INC $515,000Active-- beds -- baths2,926 sq. ft.
5009 S Park, Tucson, AZ 85706
MLS# 22526275Listed by: KELLER WILLIAMS INTEGRITY FIRST $285,000Active3 beds 3 baths1,813 sq. ft.
3830 E Eventide, Tucson, AZ 85706
MLS# 22525871Listed by: COLDWELL BANKER REALTY $300,000Pending4 beds 3 baths2,072 sq. ft.
3757 E Drexel Manor Sv, Tucson, AZ 85706
MLS# 22525148Listed by: SOLD MASTERS REALTY $322,000Pending4 beds 3 baths1,845 sq. ft.
5984 S Antrim, Tucson, AZ 85706
MLS# 22524521Listed by: REAL BROKER $274,500Pending3 beds 2 baths1,435 sq. ft.
826 W Calle Evelina, Tucson, AZ 85706
MLS# 22524522Listed by: REALTY ONE GROUP INTEGRITY $275,000Active3 beds 2 baths1,255 sq. ft.
1654 E Calle Grandiosa, Tucson, AZ 85706
MLS# 22524386Listed by: KELLER WILLIAMS ARIZONA REALTY $273,900Active4 beds 1 baths1,080 sq. ft.
743 W Milton, Tucson, AZ 85706
MLS# 22522886Listed by: REALTY EXECUTIVES ARIZONA TERRITORY $172,000Active-- beds -- baths1,163 sq. ft.
1227 E Ginter, Tucson, AZ 85706
MLS# 22522829Listed by: REALTY ONE GROUP INTEGRITY $229,000Active3 beds 1 baths828 sq. ft.
661 W Calle Milu, Tucson, AZ 85706
MLS# 22522790Listed by: REALTY EXECUTIVES ARIZONA TERRITORY $299,700Active3 beds 2 baths1,861 sq. ft.
5760 S Stewart, Tucson, AZ 85706
MLS# 22602022Listed by: REALTY EXECUTIVES ARIZONA TERRITORY $223,900Active3 beds 2 baths1,101 sq. ft.
5090 S Mira Loma, Tucson, AZ 85706
MLS# 22522093Listed by: TIERRA ANTIGUA REALTY $229,000Active2 beds 1 baths863 sq. ft.
273 W Virginia, Tucson, AZ 85706
MLS# 22518497Listed by: REALTY ONE GROUP INTEGRITY $280,000Active3 beds 2 baths1,308 sq. ft.
6006 S Mogollon, Tucson, AZ 85706
MLS# 22530599Listed by: ENGEL & VOLKERS TUCSON $317,900Active3 beds 2 baths1,935 sq. ft.
4029 E Big Game, Tucson, AZ 85706
MLS# 22519321Listed by: AT HOME DESERT REALTY $350,000Active4 beds 2 baths1,524 sq. ft.
5119 S Aleppo, Tucson, AZ 85706
MLS# 22600419Listed by: NEXTHOME COMPLETE REALTY (DBA) $239,000Active3 beds 2 baths1,394 sq. ft.
801 W Idaho, Tucson, AZ 85706
MLS# 22516223Listed by: OMNI HOMES INTERNATIONAL $425,000Active-- beds -- baths1,882 sq. ft.
5978 S Stewart, Tucson, AZ 85706
MLS# 22605242Listed by: OMNI HOMES INTERNATIONAL $425,000Active-- beds -- baths1,882 sq. ft.
5988 S Stewart, Tucson, AZ 85706
MLS# 22605250Listed by: OMNI HOMES INTERNATIONAL $175,000Active3 beds 2 baths1,050 sq. ft.
914 W Wedwick, Tucson, AZ 85706
MLS# 22526553Listed by: TIERRA ANTIGUA REALTY $515,000Active2.02 Acres
3502 E Felix, Tucson, AZ 85706
MLS# 22427028Listed by: COLDWELL BANKER REALTY
Local realty services provided by:CENTURY 21 Success Realty, CENTURY 21 Arizona West
The data relating to real estate listings on this website comes in part from the Internet Data Exchange (IDX) program of Multiple Listing Service of Southern Arizona. IDX information is provided exclusively for consumers' personal, non-commercial use and may not be used for any purpose other than to identify prospective properties consumers may be interested in purchasing. Listings provided by brokerages other than CENTURY 21 Success Realty are identified with the MLSSAZ IDX Logo. All information is deemed reliable but is not guaranteed accurate. Listing information Copyright 2026 MLS of Southern Arizona. All Rights Reserved.
Popular searches near 85706
Popular neighborhoods near 85706
- Barrio Centro, Tucson homes for sale
- Cherry Avenue, Tucson homes for sale
- Country Club Manor, Tucson homes for sale
- Elvira, Tucson homes for sale
- Fairgrounds, Tucson homes for sale
- Julia Keen, Tucson homes for sale
- Las Vistas, Tucson homes for sale
- Midvale Park, Tucson homes for sale
- Mortimore, Tucson homes for sale
- Pueblo Gardens, Tucson homes for sale
- Rancho Buena, Tucson homes for sale
- Rancho Valencia, Tucson homes for sale
- Roberts, Tucson homes for sale
- Santa Cruz Southwest, Tucson homes for sale
- Santa Rita Park, Tucson homes for sale
- South Park, Tucson homes for sale
- South Tucson, Tucson homes for sale
- Southern Heights, South Tucson homes for sale
- Sunnyside, Tucson homes for sale
- Wakefield, Tucson homes for sale
Protect your home and budget from life's surprises with an Assurant Home Warranty, backed by a partner that supports you through every step of homeownership. Explore Plans.
©2026 Century 21 Real Estate LLC. All rights reserved. CENTURY 21®, the CENTURY 21 Logo and C21® are service marks owned by Century 21 Real Estate LLC. Century 21 Real Estate LLC fully supports the principles of the Fair Housing Act and the Equal Opportunity Act. Each office is independently owned and operated. Listing information is deemed reliable but not guaranteed accurate.