- Broadway Pantano East, Tucson homes for sale
- Carson Corner, Tucson homes for sale
- Civano, Tucson homes for sale
- Corbett, Tucson homes for sale
- Dietz, Tucson homes for sale
- Groves Lincoln Park, Tucson homes for sale
- La Estancia de Tucson, Tucson homes for sale
- Lakeside Park, Tucson homes for sale
- Longview Estates, Tucson homes for sale
- Mesquite Ranch, Tucson homes for sale
- Miramonte Terrace, Tucson homes for sale
- Old Spanish Trail, Tucson homes for sale
- Rolling Hills, Tucson homes for sale
- Rolling Hills Country Club Estates, Tucson homes for sale
- Sherwood Village Terrace, Tucson homes for sale
- South Harrison, Tucson homes for sale
- Stella Mann, Tucson homes for sale
- Terra Del Sol, Tucson homes for sale
- Valley View East, Tucson homes for sale
- Yale Estates, Tucson homes for sale
Tucson, AZ - homes for sale
300 of 2,906 results displayed
- New
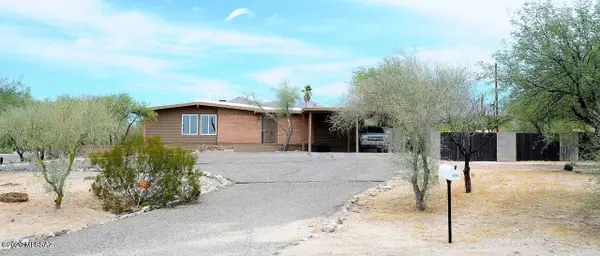
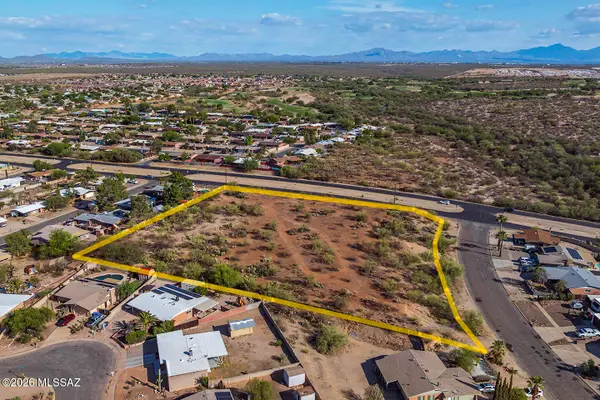 $475,000Active3.14 Acres
3727 S Sarnoff, Tucson, AZ 85730
MLS# 22617041Listed by: REALTY EXECUTIVES ARIZONA TERRITORY
- New
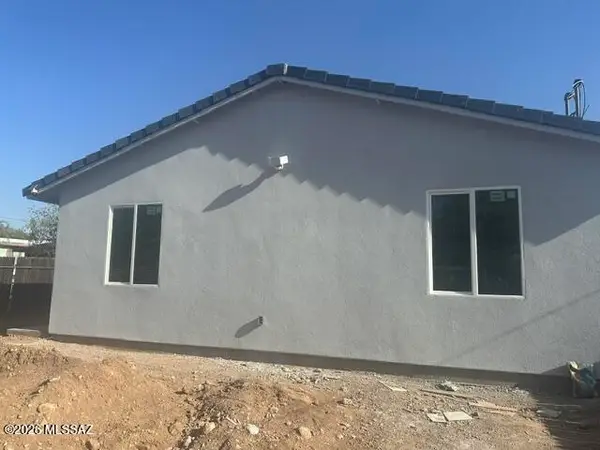 $599,000Active-- beds -- baths2,900 sq. ft.
827 E 33rd, Tucson, AZ 85713
MLS# 22617044Listed by: REAL BROKER - New
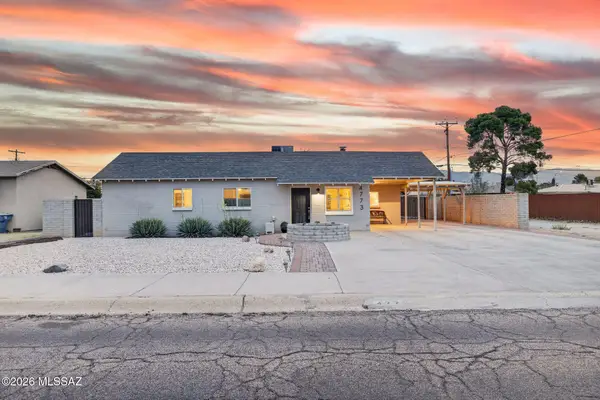 $325,000Active3 beds 1 baths1,599 sq. ft.
4773 E Eastland, Tucson, AZ 85711
MLS# 22617032Listed by: LONG REALTY - New
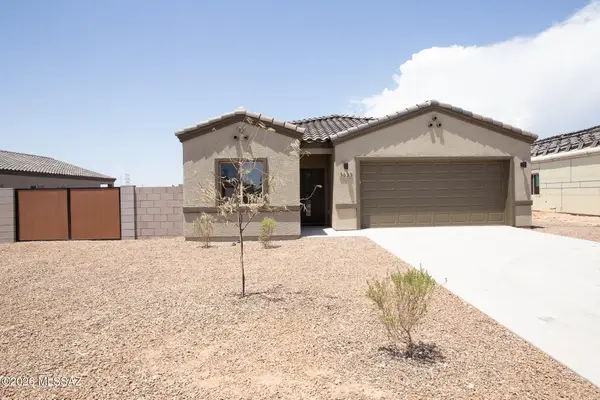 $399,900Active4 beds 2 baths1,725 sq. ft.
3633 E Nebraska, Tucson, AZ 85706
MLS# 22617033Listed by: ROCA REALTY - New
 $389,900Active4 beds 3 baths2,057 sq. ft.
5966 E Jayden, Tucson, AZ 85756
MLS# 22617034Listed by: DRH PROPERTIES INC. - New
 $300,000Active2 beds 2 baths1,258 sq. ft.
6255 N Camino Pimeria Alta, Tucson, AZ 85718
MLS# 22617030Listed by: OMNI HOMES INTERNATIONAL - New
 $279,000Active3 beds 2 baths1,250 sq. ft.
458 S Kenyon, Tucson, AZ 85710
MLS# 22617019Listed by: REALTY EXECUTIVES ARIZONA TERRITORY - New
 $299,900Active3 beds 2 baths1,620 sq. ft.
3241 S Ames, Tucson, AZ 85730
MLS# 22617020Listed by: REALTY EXECUTIVES ARIZONA TERRITORY - New
 $195,000Active3 beds 2 baths912 sq. ft.
3651 E 33rd, Tucson, AZ 85713
MLS# 22617021Listed by: LONG REALTY - New
 $615,000Active4 beds 2 baths1,926 sq. ft.
4840 N Islero, Tucson, AZ 85749
MLS# 22617025Listed by: MOUNTAIN RETREAT REALTY EXPERTS, LLC - New
 $8,899Active2.18 Acres
1430 Tifon, Rio Rico, AZ 85648
MLS# 22617026Listed by: LIST WITH FREEDOM, INC. - New
 $300,000Active4 beds 3 baths2,447 sq. ft.
11008 E Midnight Moon, Tucson, AZ 85747
MLS# 22616408Listed by: VAIL REALTY - New
 $105,000Active1 beds 2 baths800 sq. ft.
1620 N Wilmot, Tucson, AZ 85712
MLS# 22616964Listed by: PIMA VALLEY REALTY AND PROPERTY MANAGEMENT - New
 $209,000Active2 beds 2 baths903 sq. ft.
5750 N Camino Esplendora, Tucson, AZ 85718
MLS# 22616977Listed by: SUNQUEST REALTY - New
 $345,000Active4 beds 2 baths1,538 sq. ft.
8790 E Mountain Spring, Tucson, AZ 85747
MLS# 22616980Listed by: TIERRA ANTIGUA REALTY - New
 $409,990Active4 beds 4 baths1,792 sq. ft.
383 S Stonington, Tucson, AZ 85748
MLS# 22616981Listed by: HOMESMART ADVANTAGE GROUP - New
 $374,999Active-- beds -- baths1,600 sq. ft.
1808/1810 E Miles, Tucson, AZ 85719
MLS# 22616990Listed by: NEW CONCEPT - New
 $275,000Active4 beds 2 baths1,244 sq. ft.
2469 S Kevin, Tucson, AZ 85748
MLS# 22616996Listed by: ARIZONA REALTY AND LAW - New
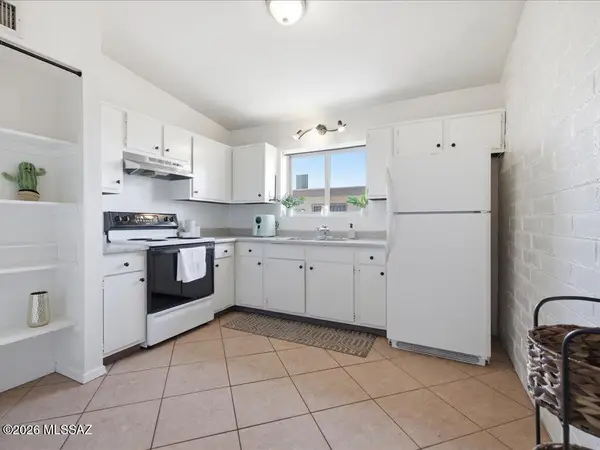
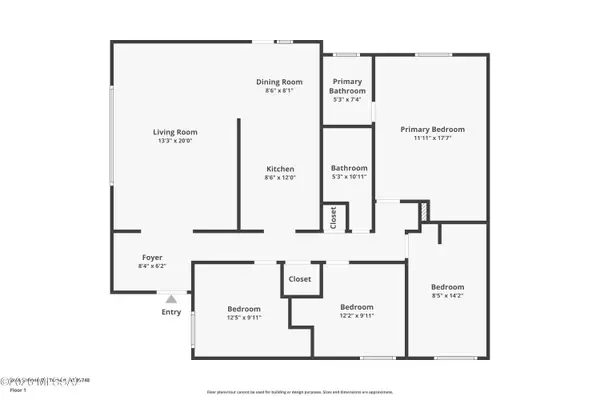
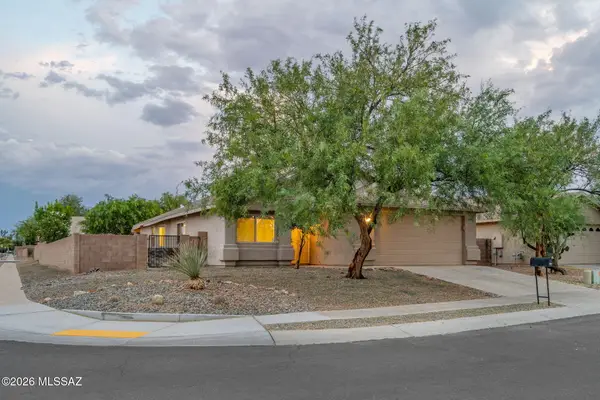
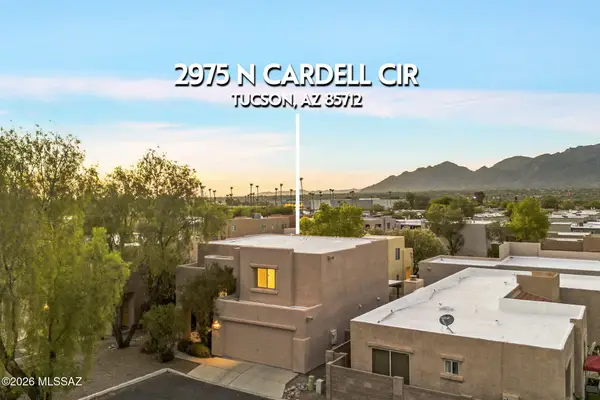 $325,000Active3 beds 3 baths1,542 sq. ft.
2975 N Cardell, Tucson, AZ 85712
MLS# 22617001Listed by: KELLER WILLIAMS SOUTHERN ARIZONA - Open Sat, 5 to 7pmNew
 $310,000Active3 beds 2 baths1,660 sq. ft.
8090 E Sundew, Tucson, AZ 85710
MLS# 22617003Listed by: REALTY EXECUTIVES ARIZONA TERRITORY - New
 $338,000Active3 beds 2 baths1,262 sq. ft.
6415 S Ambarella, Tucson, AZ 85756
MLS# 22617007Listed by: KMS REALTY - New
 $559,000Active3 beds 3 baths2,041 sq. ft.
10685 E Oakwood, Tucson, AZ 85749
MLS# 22617011Listed by: SUMMIT RESIDENTIAL SERVICES LLC - Open Fri, 6 to 9pmNew
 $1,289,000Active4 beds 3 baths3,446 sq. ft.
4228 N Placita De Sandra, Tucson, AZ 85718
MLS# 22617012Listed by: REALTY EXECUTIVES ARIZONA TERRITORY - New
 $180,000Active2 beds 1 baths977 sq. ft.
3750 N Country Club, Tucson, AZ 85716
MLS# 22617013Listed by: OMNI HOMES INTERNATIONAL - Open Sun, 1 to 4pmNew
 $414,000Active3 beds 2 baths1,930 sq. ft.
6712 E Via De Ayate, Tucson, AZ 85756
MLS# 22616971Listed by: JASON MITCHELL REAL ESTATE - New
 $270,000Active3 beds 2 baths1,215 sq. ft.
6915 E Tobin, Tucson, AZ 85730
MLS# 22616973Listed by: KELLER WILLIAMS SOUTHERN ARIZONA - New
 $320,000Active3 beds 2 baths1,630 sq. ft.
5791 N Moonbrook, Tucson, AZ 85741
MLS# 22616974Listed by: LONG REALTY - New
 $750,000Active3 beds 3 baths2,712 sq. ft.
3581 N Lynford, Tucson, AZ 85749
MLS# 22616976Listed by: TIERRA ANTIGUA REALTY - New
 $235,000Active2 beds 2 baths1,844 sq. ft.
6120 E 5th, Tucson, AZ 85711
MLS# 22616952Listed by: GENTRY REAL ESTATE - Open Sun, 2 to 4pmNew
 $295,000Active4 beds 2 baths2,200 sq. ft.
3024 W Tucker, Tucson, AZ 85746
MLS# 22616967Listed by: KELLER WILLIAMS INTEGRITY FIRST - New
 $1,100,000Active6 beds 4 baths5,411 sq. ft.
1000 N Camino Cordon, Tucson, AZ 85748
MLS# 22616968Listed by: LONG REALTY - New
 $349,000Active4 beds 2 baths1,310 sq. ft.
1212 W Fresno, Tucson, AZ 85745
MLS# 22616955Listed by: KMS REALTY - New
 $550,000Active3 beds 2 baths2,003 sq. ft.
4232 E Poe, Tucson, AZ 85711
MLS# 22616956Listed by: RUSS LYON SOTHEBY'S INTERNATIONAL REALTY - New
 $80,000Active2 beds 2 baths980 sq. ft.
5000 E Grant, Tucson, AZ 85712
MLS# 22616959Listed by: SUNQUEST REALTY - Open Fri, 7 to 9pmNew
 $170,000Active2 beds 1 baths720 sq. ft.
350 N Silverbell, Tucson, AZ 85745
MLS# 22615847Listed by: KELLER WILLIAMS INTEGRITY FIRST - Open Sat, 2 to 5pmNew
 $240,000Active2 beds 2 baths1,279 sq. ft.
1911 N Camino De La Cienega, Tucson, AZ 85715
MLS# 22616778Listed by: KELLER WILLIAMS INTEGRITY FIRST - New
 $345,000Active3 beds 2 baths1,350 sq. ft.
5719 E Fairmount, Tucson, AZ 85712
MLS# 22616936Listed by: COLDWELL BANKER REALTY - Open Sat, 2 to 4pmNew
 $402,000Active5 beds 3 baths2,201 sq. ft.
615 E Linden, Tucson, AZ 85705
MLS# 22616939Listed by: UNITED REAL ESTATE SPECIALISTS - New
 $279,900Active3 beds 2 baths1,092 sq. ft.
1319 W Speedway, Tucson, AZ 85745
MLS# 22616941Listed by: AT HOME DESERT REALTY - Open Fri, 6 to 9pmNew
 $345,000Active4 beds 2 baths1,871 sq. ft.
7509 E 42nd, Tucson, AZ 85730
MLS# 22616943Listed by: TIERRA ANTIGUA REALTY - New
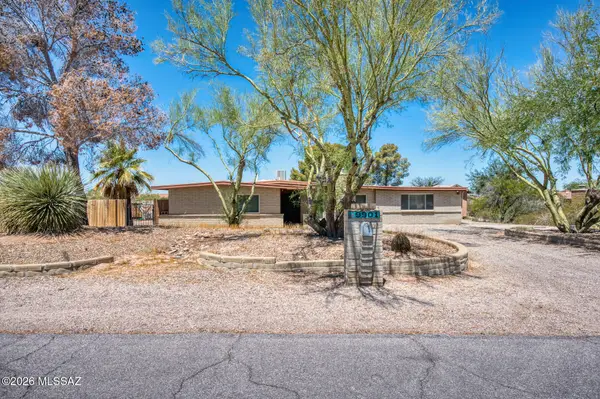 $350,000Active4 beds 2 baths2,162 sq. ft.
9901 E Discovery, Tucson, AZ 85748
MLS# 22616946Listed by: HARVEY MORDKA REALTY - New
 $300,000Active2 beds 2 baths1,037 sq. ft.
7535 E Harbor, Tucson, AZ 85715
MLS# 22616947Listed by: OMNI HOMES INTERNATIONAL - Open Fri, 5:30 to 7:30pmNew
 $980,000Active4 beds 3 baths3,254 sq. ft.
4905 N Craycroft, Tucson, AZ 85718
MLS# 22616950Listed by: LONG REALTY - Open Fri, 12 to 10pmNew
 $275,000Active3 beds 2 baths1,581 sq. ft.
1497 W Argyle, Tucson, AZ 85746
MLS# 22616931Listed by: OPENDOOR BROKERAGE, LLC - New
 $460,000Active5 beds 4 baths2,897 sq. ft.
7904 S Bonanza Park, Tucson, AZ 85747
MLS# 22616932Listed by: OPENDOOR BROKERAGE, LLC - Open Sat, 3 to 5pmNew
 $420,000Active2 beds 2 baths1,232 sq. ft.
701 S Osborne, Tucson, AZ 85701
MLS# 22616933Listed by: TIERRA ANTIGUA REALTY - New
 $530,000Active4 beds 2 baths2,409 sq. ft.
4934 E Glenn, Tucson, AZ 85712
MLS# 22616934Listed by: OMNI HOMES INTERNATIONAL - Open Fri, 12 to 10pmNew
 $235,000Active2 beds 2 baths1,087 sq. ft.
5263 S Coldwater, Tucson, AZ 85746
MLS# 22616928Listed by: OPENDOOR BROKERAGE, LLC - New
 $410,000Active3 beds 2 baths2,014 sq. ft.
10337 S Pantano Knolls, Vail, AZ 85641
MLS# 22616818Listed by: HOMESMART ADVANTAGE GROUP - Open Sat, 11:30am to 3pmNew
 $310,000Active3 beds 2 baths1,260 sq. ft.
1738 W Pueblo Vista, Tucson, AZ 85713
MLS# 22616860Listed by: PAK HOME REALTY - New
 $550,000Active3 beds 3 baths2,290 sq. ft.
11435 E Sundance, Tucson, AZ 85749
MLS# 22616917Listed by: LONG REALTY - New
 $329,500Active2 beds 1 baths1,022 sq. ft.
510 S Country Club, Tucson, AZ 85716
MLS# 22616924Listed by: REALTY EXECUTIVES ARIZONA TERRITORY - New
 $279,900Active3 beds 2 baths1,387 sq. ft.
6654 S Luxor, Tucson, AZ 85746
MLS# 22616925Listed by: COPPER MOUNTAIN REALTY, L.L.C. - New
 $89,000Active1 beds 1 baths475 sq. ft.
1810 E Blacklidge, Tucson, AZ 85719
MLS# 22616927Listed by: OMNI HOMES INTERNATIONAL  $505,000Pending3 beds 2 baths1,568 sq. ft.
1700 W Sunset, Tucson, AZ 85704
MLS# 22616926Listed by: TIERRA ANTIGUA REALTY- New
 $259,000Active2 beds 2 baths1,088 sq. ft.
4819 S Windrose, Tucson, AZ 85730
MLS# 22616912Listed by: REALTY EXECUTIVES ARIZONA TERRITORY - New
 $205,000Active3 beds 2 baths1,075 sq. ft.
6951 E Golf Links, Tucson, AZ 85730
MLS# 22616914Listed by: RUSS LYON SOTHEBY'S INTERNATIONAL REALTY - New
 $325,000Active3 beds 2 baths1,757 sq. ft.
618 S Staunton, Tucson, AZ 85710
MLS# 22616915Listed by: REALTY EXECUTIVES ARIZONA TERRITORY - New
 $309,000Active3 beds 2 baths1,290 sq. ft.
6918 E Kingston, Tucson, AZ 85710
MLS# 22616919Listed by: REALTY EXECUTIVES ARIZONA TERRITORY - Open Sat, 1 to 7pmNew
 $342,500Active3 beds 2 baths1,512 sq. ft.
810 N Camino Santiago, Tucson, AZ 85745
MLS# 22616870Listed by: LONG REALTY - New
 $239,700Active2 beds 1 baths952 sq. ft.
972 N Chrysler, Tucson, AZ 85716
MLS# 22616872Listed by: REALTY EXECUTIVES ARIZONA TERRITORY - Open Sat, 6 to 8pmNew
 $389,000Active3 beds 2 baths2,016 sq. ft.
8825 E Shenandoah, Tucson, AZ 85710
MLS# 22616873Listed by: REALTY EXECUTIVES ARIZONA TERRITORY - New
 $335,990Active3 beds 3 baths1,453 sq. ft.
2671 S Oakenshield, Tucson, AZ 85730
MLS# 22616874Listed by: RICHMOND AMERICAN HOMES OF AZ - New
 $334,990Active3 beds 3 baths1,453 sq. ft.
2661 S Oakenshield, Tucson, AZ 85730
MLS# 22616878Listed by: RICHMOND AMERICAN HOMES OF AZ  $450,000Pending3 beds 3 baths1,868 sq. ft.
191 E Calderwood, Tucson, AZ 85704
MLS# 22616880Listed by: NEW CONCEPT- Open Sat, 2 to 5pmNew
 $289,500Active3 beds 2 baths1,172 sq. ft.
9500 E 33rd, Tucson, AZ 85710
MLS# 22616881Listed by: LONG REALTY - New
 $165,000Active3 beds 2 baths1,479 sq. ft.
5911 S Bonney, Tucson, AZ 85706
MLS# 22616882Listed by: JASON MITCHELL REAL ESTATE - New
 $235,000Active4 beds 2 baths1,602 sq. ft.
5982 S Wood Crest, Tucson, AZ 85746
MLS# 22616884Listed by: KELLER WILLIAMS SOUTHERN ARIZONA - New
 $316,990Active2 beds 1 baths952 sq. ft.
365 N Coville, Tucson, AZ 85745
MLS# 22616885Listed by: KB HOME SALES-TUCSON INC. - New
 $289,500Active1 beds 1 baths850 sq. ft.
2020 E River, Tucson, AZ 85718
MLS# 22616886Listed by: ANDY COURTNEY PROPERTIES, LTD. - Open Sun, 4 to 6pmNew
 $439,900Active3 beds 3 baths1,394 sq. ft.
2331 N Hampton, Tucson, AZ 85719
MLS# 22616890Listed by: REALTY EXECUTIVES ARIZONA TERRITORY - Open Sat, 3am to 5pmNew
 $550,000Active4 beds 3 baths2,685 sq. ft.
8038 S Golden Bell, Tucson, AZ 85747
MLS# 22616894Listed by: REALTY EXECUTIVES ARIZONA TERRITORY - New
 $324,990Active2 beds 2 baths979 sq. ft.
373 N Coville, Tucson, AZ 85745
MLS# 22616895Listed by: KB HOME SALES-TUCSON INC. - Open Sat, 2:30 to 4:30pmNew
 $425,000Active3 beds 2 baths1,378 sq. ft.
5144 N Standing Rock, Tucson, AZ 85750
MLS# 22616863Listed by: TIERRA ANTIGUA REALTY - New
 $225,000Active3 beds 2 baths1,142 sq. ft.
201 E Rodeo, Tucson, AZ 85714
MLS# 22616850Listed by: REALTY EXECUTIVES ARIZONA TERRITORY - New
 $240,000Active1.76 Acres
9911 E Mt Pleasant, Tucson, AZ 85749
MLS# 22616851Listed by: TIERRA ANTIGUA REALTY - New
 $299,900Active3 beds 2 baths1,490 sq. ft.
7331 E Brooks, Tucson, AZ 85730
MLS# 22616841Listed by: TIERRA ANTIGUA REALTY - New
 $300,000Active3 beds 2 baths1,398 sq. ft.
3332 S Champlain, Tucson, AZ 85730
MLS# 22616842Listed by: LONG REALTY - New
 $677,250Active4 beds 4 baths3,305 sq. ft.
10212 E Bell Rock, Tucson, AZ 85747
MLS# 22616843Listed by: CITIEA - New
 $374,900Active4 beds 2 baths1,744 sq. ft.
809 S Loyola, Tucson, AZ 85710
MLS# 22616837Listed by: REALTY EXECUTIVES ARIZONA TERRITORY - New
 $1,150,000Active3 beds 2 baths2,714 sq. ft.
5051 E Camino Bosque, Tucson, AZ 85718
MLS# 22616583Listed by: LONG REALTY - New
 $264,900Active3 beds 1 baths1,200 sq. ft.
5733 E 30th, Tucson, AZ 85711
MLS# 22616776Listed by: REALTY EXECUTIVES ARIZONA TERRITORY - Open Sat, 2 to 4pmNew
 $560,000Active3 beds 2 baths2,382 sq. ft.
7100 E River Canyon, Tucson, AZ 85750
MLS# 22616797Listed by: KELLER WILLIAMS SOUTHERN ARIZONA - New
 $220,000Active3 beds 2 baths1,563 sq. ft.
1246 S Camino Seco, Tucson, AZ 85710
MLS# 22616830Listed by: OMNI HOMES INTERNATIONAL - New
 $450,000Active3 beds 2 baths1,643 sq. ft.
2500 W Irvington, Tucson, AZ 85746
MLS# 22616820Listed by: COLDWELL BANKER REALTY - New
 $362,000Active2 beds 1 baths900 sq. ft.
938 S 7th, Tucson, AZ 85701
MLS# 22616812Listed by: SINCLAIR ASSOCIATES - New
 $439,000Active-- beds -- baths1,882 sq. ft.
2975 N Walnut, Tucson, AZ 85712
MLS# 22616801Listed by: OMNI HOMES INTERNATIONAL - New
 $375,000Active4 beds 3 baths2,160 sq. ft.
10197 E Sonoran Heights, Tucson, AZ 85748
MLS# 22616802Listed by: REALTY EXECUTIVES ARIZONA TERRITORY  $549,337Pending4 beds 4 baths2,378 sq. ft.
2703 S Ayala, Tucson, AZ 85713
MLS# 22616795Listed by: PEPPER VINER MANAGEMENT CO. III, LLC- Open Fri, 6 to 8:30pmNew
 $335,000Active3 beds 2 baths1,431 sq. ft.
7431 E Calle Cuernavaca, Tucson, AZ 85710
MLS# 22615734Listed by: TIERRA ANTIGUA REALTY - New
 $500,000Active3 beds 2 baths1,868 sq. ft.
5590 N Waterfield, Tucson, AZ 85750
MLS# 22616792Listed by: TIERRA ANTIGUA REALTY - New
 $360,000Active3 beds 2 baths1,627 sq. ft.
3241 S Serena, Tucson, AZ 85730
MLS# 22616794Listed by: LONG REALTY - New
 $394,990Active4 beds 3 baths2,160 sq. ft.
6121 E Campolina, Tucson, AZ 85756
MLS# 22616784Listed by: RICHMOND AMERICAN HOMES OF AZ - New
 $249,900Active0.6 Acres
9650 E Sabino Estates, Tucson, AZ 85749
MLS# 22616790Listed by: WEST USA REALTY - Open Sun, 6:30 to 8:30pmNew
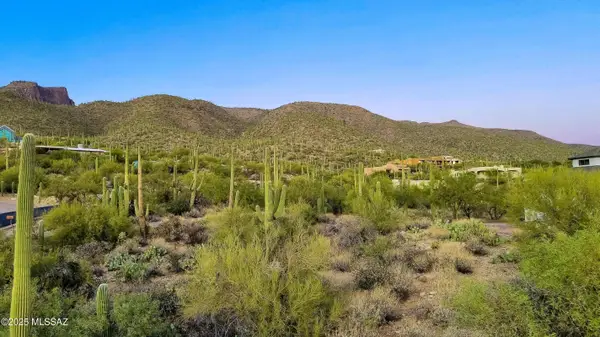
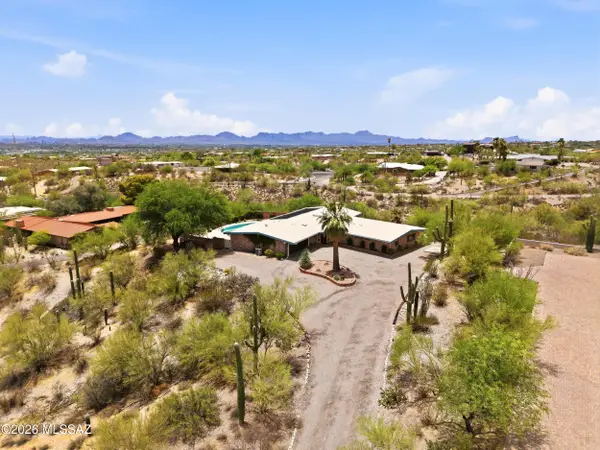
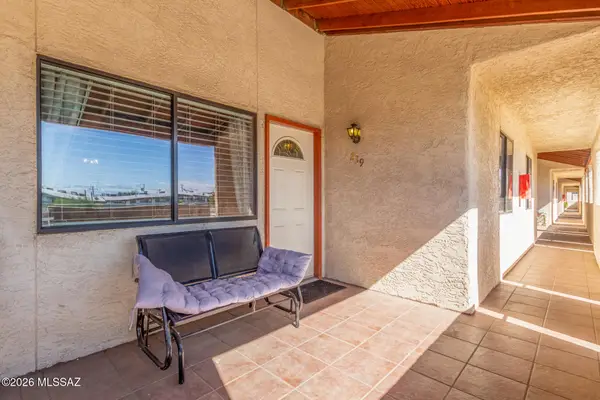
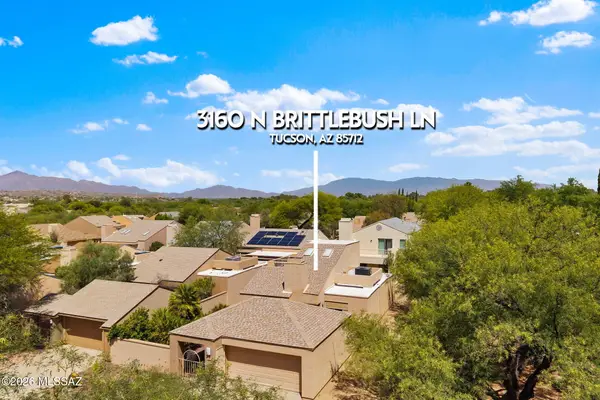 $425,000Active3 beds 2 baths1,475 sq. ft.
3160 N Brittlebush, Tucson, AZ 85712
MLS# 22616773Listed by: RUSS LYON SOTHEBY'S INTERNATIONAL REALTY - New
 $995,000Active3 beds 3 baths2,940 sq. ft.
4901 N Camino Arenosa, Tucson, AZ 85718
MLS# 22616774Listed by: LONG REALTY - New
 $89,900Active1 beds 1 baths560 sq. ft.
455 W Kelso, Tucson, AZ 85705
MLS# 22616775Listed by: OMNI HOMES INTERNATIONAL - New
 $80,000Active1 beds 1 baths475 sq. ft.
1810 E Blacklidge, Tucson, AZ 85719
MLS# 22616777Listed by: REAL BROKER - New
 $344,990Active3 beds 2 baths1,560 sq. ft.
6125 E Campolina, Tucson, AZ 85756
MLS# 22616779Listed by: RICHMOND AMERICAN HOMES OF AZ - New
 $300,000Active3 beds 2 baths1,301 sq. ft.
3775 N Nash Creek, Tucson, AZ 85745
MLS# 22616781Listed by: LONG REALTY - Open Fri, 5 to 7pmNew
 $259,000Active3 beds 2 baths1,515 sq. ft.
2109 S Camino Seco, Tucson, AZ 85710
MLS# 22616762Listed by: REALTY EXECUTIVES ARIZONA TERRITORY - Open Sun, 3 to 7pmNew
 $525,000Active5 beds 3 baths2,044 sq. ft.
5635 N Via Latigo, Tucson, AZ 85704
MLS# 22616763Listed by: EXP REALTY - New
 $160,000Active3 beds 2 baths1,560 sq. ft.
6163 S Mainside, Tucson, AZ 85746
MLS# 22616766Listed by: PAUL JOHN CHARETTE - New
 $769,900Active4 beds 4 baths3,056 sq. ft.
12866 E Tortoise Pointe, Vail, AZ 85641
MLS# 22616755Listed by: LONG REALTY - New
 $130,000Active2 beds 2 baths1,107 sq. ft.
1600 N Wilmot, Tucson, AZ 85712
MLS# 22616757Listed by: JASON MITCHELL REAL ESTATE - New
 $259,900Active3 beds 2 baths1,204 sq. ft.
2266 E Sunland, Tucson, AZ 85713
MLS# 22616750Listed by: VALLEY VIEWS RE - New
 $259,000Active2 beds 1 baths1,193 sq. ft.
231 W 26th, Tucson, AZ 85713
MLS# 22616671Listed by: REAL BROKER - New
 $448,000Active3 beds 2 baths1,950 sq. ft.
2806 E Seneca, Tucson, AZ 85716
MLS# 22616733Listed by: CENTRA REALTY - New
 $200,000Active3 beds 2 baths1,198 sq. ft.
1 E Elvado, Tucson, AZ 85756
MLS# 22616738Listed by: LONG REALTY - New
 $899,333Active4 beds 2 baths3,648 sq. ft.
5617 N Camino Del Conde, Tucson, AZ 85718
MLS# 22616742Listed by: UNITY REALTY - Open Sat, 12 to 3pmNew
 $325,000Active3 beds 2 baths1,601 sq. ft.
10433 E Ravenswood, Tucson, AZ 85747
MLS# 22616744Listed by: REALTY EXECUTIVES ARIZONA TERRITORY - New
 $350,000Active3 beds 2 baths1,795 sq. ft.
2630 S Pace E, Tucson, AZ 85730
MLS# 22616746Listed by: OMNI HOMES INTERNATIONAL - New
 $305,000Active5 beds 2 baths2,100 sq. ft.
749 W Calle Margarita, Tucson, AZ 85706
MLS# 22616731Listed by: TIERRA ANTIGUA REALTY - Open Sun, 2 to 5pmNew
 $368,000Active4 beds 3 baths2,212 sq. ft.
4979 S River Run, Tucson, AZ 85746
MLS# 22616735Listed by: EMBARC REALTY - New
 $210,000Active3 beds 2 baths1,058 sq. ft.
3046 N Jackson, Tucson, AZ 85719
MLS# 22616704Listed by: REAL BROKER - New
 $1,195,000Active4 beds 3 baths2,835 sq. ft.
11231 E Placita Rancho Grande, Tucson, AZ 85730
MLS# 22616710Listed by: LONG REALTY - New
 $355,000Active13.25 Acres
5499 N Wentworth, Tucson, AZ 85749
MLS# 22616722Listed by: REAL BROKER - New
 $240,000Active4 beds 2 baths1,895 sq. ft.
5819 E Calle Silvosa --, Tucson, AZ 85711
MLS# 7050566Listed by: HOMESMART - New
 $265,000Active6 beds 2 baths2,091 sq. ft.
3650 E March, Tucson, AZ 85713
MLS# 22616693Listed by: UNITED REAL ESTATE SPECIALISTS - New
 $340,000Active3 beds 2 baths1,579 sq. ft.
3927 W Rock Basin, Tucson, AZ 85745
MLS# 22616695Listed by: LONG REALTY - New
 $340,000Active4 beds 2 baths2,082 sq. ft.
5929 E Cedarbird, Tucson, AZ 85756
MLS# 22616696Listed by: LONG REALTY - New
 $529,900Active3 beds 3 baths2,329 sq. ft.
1140 S Singing Bird, Tucson, AZ 85745
MLS# 22616697Listed by: LONG REALTY - New
 $200,000Active2 beds 1 baths801 sq. ft.
4095 S Queen Palm, Tucson, AZ 85730
MLS# 22616687Listed by: OMNI HOMES INTERNATIONAL - New
 $310,000Active3 beds 3 baths1,627 sq. ft.
7067 S Gull, Tucson, AZ 85756
MLS# 22616690Listed by: TIERRA ANTIGUA REALTY - New
 $315,000Active4 beds 2 baths1,718 sq. ft.
5497 S Canada, Tucson, AZ 85706
MLS# 22616691Listed by: TIERRA ANTIGUA REALTY - New
 $134,995Active2 beds 1 baths838 sq. ft.
6533 E Calle La Paz, Tucson, AZ 85715
MLS# 22616678Listed by: BIDEGAIN REALTY, INC.  $237,000Pending4 beds 2 baths1,477 sq. ft.
7321 E Tamara, Tucson, AZ 85730
MLS# 22616681Listed by: CONGRESS REALTY- New
 $335,000Active4 beds 3 baths2,274 sq. ft.
7500 S Malcolm, Tucson, AZ 85746
MLS# 22616666Listed by: REAL BROKER - New
 $599,000Active3 beds 2 baths2,065 sq. ft.
5341 N Fort Yuma, Tucson, AZ 85750
MLS# 22616670Listed by: LONG REALTY - Open Sat, 1 to 3pmNew
 $486,500Active4 beds 4 baths2,069 sq. ft.
3003 N Gaia, Tucson, AZ 85745
MLS# 22616673Listed by: OMNI HOMES INTERNATIONAL - New
 $348,000Active4 beds 3 baths2,303 sq. ft.
6522 E Brushback, Tucson, AZ 85756
MLS# 22616658Listed by: JASON MITCHELL REAL ESTATE - New
 $370,000Active3 beds 2 baths1,622 sq. ft.
760 N Western Ridge, Tucson, AZ 85748
MLS# 22616659Listed by: OMNI HOMES INTERNATIONAL - New
 $349,900Active4 beds 2 baths1,921 sq. ft.
10013 E Rocky Wash, Tucson, AZ 85748
MLS# 22616661Listed by: KELLER WILLIAMS SOUTHERN ARIZONA - New
 $259,000Active3 beds 2 baths1,027 sq. ft.
4652 S Calle Madrid, Tucson, AZ 85714
MLS# 22616663Listed by: HOMESMART ADVANTAGE GROUP - New
 $349,900Active3 beds 2 baths1,242 sq. ft.
4320 E Hayhurst, Tucson, AZ 85712
MLS# 22616665Listed by: TIERRA ANTIGUA REALTY - Open Fri, 7 to 10pmNew
 $165,000Active2 beds 2 baths977 sq. ft.
3690 N Country Club, Tucson, AZ 85716
MLS# 22616515Listed by: REAL BROKER - New
 $200,000Active-- beds -- baths2,001 sq. ft.
843 W Wyoming, Tucson, AZ 85706
MLS# 22616664Listed by: REAL BROKER - New
 $78,000Active0.08 Acres
2703 E Grant, Tucson, AZ 85716
MLS# 22616653Listed by: VYLLA HOME - New
 $299,900Active1 beds 1 baths693 sq. ft.
2709 E Grant, Tucson, AZ 85716
MLS# 22616654Listed by: VYLLA HOME - New
 $294,000Active2 beds 2 baths1,025 sq. ft.
4406 E Haven, Tucson, AZ 85712
MLS# 22616646Listed by: LONG REALTY - New
 $595,000Active4 beds 3 baths2,519 sq. ft.
10971 E Soaptree, Tucson, AZ 85748
MLS# 22616644Listed by: 1ST AMERICAN REAL ESTATE AND PROPERTY MANAGEMENT - New
 $495,000Active3 beds 2 baths1,923 sq. ft.
6120 N Pomona, Tucson, AZ 85704
MLS# 22616632Listed by: RE/MAX EXCALIBUR - New
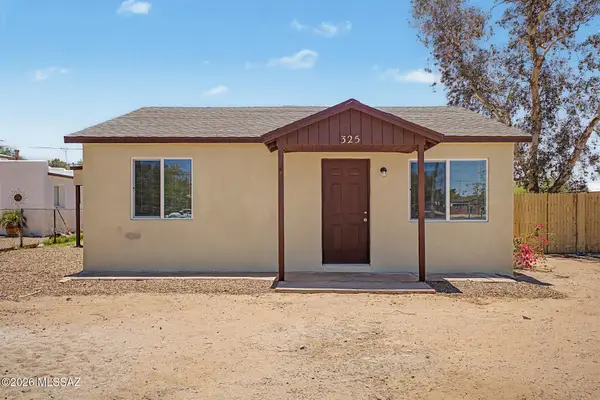 $289,000Active3 beds 2 baths1,358 sq. ft.
325 W District, Tucson, AZ 85714
MLS# 22616628Listed by: PANDA KEY REALTY - Open Mon, 8 to 10pmNew
 $390,000Active4 beds 2 baths2,165 sq. ft.
10046 E Cedar Hill, Tucson, AZ 85748
MLS# 22616622Listed by: REALTY EXECUTIVES ARIZONA TERRITORY - New
 $159,900Active1 beds 1 baths576 sq. ft.
7668 E 22nd, Tucson, AZ 85710
MLS# 22616615Listed by: LONG REALTY - New
 $215,000Active2 beds 1 baths940 sq. ft.
2314 E 35th, Tucson, AZ 85713
MLS# 22616617Listed by: OMNI HOMES INTERNATIONAL - New
 $315,000Active3 beds 2 baths2,343 sq. ft.
10241 E Speedway, Tucson, AZ 85748
MLS# 22616601Listed by: REALTY EXECUTIVES ARIZONA TERRITORY - New
 $100,000Active2 beds -- baths1,088 sq. ft.
1044 E 24th, Tucson, AZ 85713
MLS# 22616602Listed by: KELLER WILLIAMS SOUTHERN ARIZONA - New
 $249,900Active3 beds 2 baths1,040 sq. ft.
4041 N Ray, Tucson, AZ 85705
MLS# 22616605Listed by: REALTY EXECUTIVES ARIZONA TERRITORY - New
 $190,000Active4 beds 1 baths1,342 sq. ft.
2151 S Howard, Tucson, AZ 85713
MLS# 22616607Listed by: THE PLEXPERT - New
 $265,000Active3 beds 2 baths1,204 sq. ft.
5418 S Wembly, Tucson, AZ 85746
MLS# 22616608Listed by: TIERRA ANTIGUA REALTY - New
 $290,000Active3 beds 2 baths1,247 sq. ft.
2403 E Calle Gran Desierto, Tucson, AZ 85706
MLS# 22616609Listed by: TIERRA ANTIGUA REALTY - New
 $349,900Active4 beds 3 baths2,183 sq. ft.
6726 E Sea Horse, Tucson, AZ 85756
MLS# 22616610Listed by: REAL BROKER - New
 $219,900Active2 beds 2 baths1,172 sq. ft.
3750 N Country Club, Tucson, AZ 85716
MLS# 22616611Listed by: RUSS LYON SOTHEBY'S INTERNATIONAL REALTY - Open Sun, 3 to 6pmNew
 $915,000Active4 beds 3 baths2,928 sq. ft.
5025 E Placita Salud, Tucson, AZ 85718
MLS# 22616612Listed by: TIERRA ANTIGUA REALTY - New
 $335,000Active2 beds 2 baths1,031 sq. ft.
5855 N Kolb, Tucson, AZ 85750
MLS# 22616613Listed by: COLDWELL BANKER REALTY - New
 $295,000Active3 beds 2 baths1,368 sq. ft.
6245 S Dunton, Tucson, AZ 85706
MLS# 22616597Listed by: TIERRA ANTIGUA REALTY - New
 $205,000Active2 beds 2 baths1,033 sq. ft.
1042 N Va Primavera, Tucson, AZ 85710
MLS# 22616579Listed by: BIDEGAIN REALTY, INC. - New
 $122,999Active2 beds 1 baths560 sq. ft.
455 W Kelso, Tucson, AZ 85705
MLS# 22616581Listed by: TIERRA ANTIGUA REALTY - New
 $259,900Active3 beds 3 baths1,322 sq. ft.
3019 E 21st, Tucson, AZ 85716
MLS# 22616582Listed by: CENTRA REALTY - New
 $749,000Active2 beds 2 baths1,636 sq. ft.
5449 N Va Papavero, Tucson, AZ 85750
MLS# 22616585Listed by: 1912 REALTY - Open Sun, 2 to 5pmNew
 $335,000Active3 beds 2 baths1,645 sq. ft.
2501 E Greenlee, Tucson, AZ 85716
MLS# 22616586Listed by: LONG REALTY - New
 $258,900Active2 beds 2 baths1,073 sq. ft.
2504 N Ironwood Ridge, Tucson, AZ 85745
MLS# 22616587Listed by: TIERRA ANTIGUA REALTY - New
 $337,400Active4 beds 2 baths1,448 sq. ft.
6470 E Calle Luna, Tucson, AZ 85710
MLS# 22616589Listed by: REALTY EXECUTIVES ARIZONA TERRITORY - New
 $425,000Active3 beds 2 baths1,738 sq. ft.
7456 E Calle Infinito, Tucson, AZ 85715
MLS# 22616559Listed by: LONG REALTY - New
 $299,999Active3 beds 2 baths1,465 sq. ft.
5063 S River Run, Tucson, AZ 85746
MLS# 22616560Listed by: REALTY EXECUTIVES ARIZONA TERRITORY - New
 $1,390,000Active3 beds 3 baths3,204 sq. ft.
5070 N Valley View, Tucson, AZ 85718
MLS# 22616563Listed by: LONG REALTY - New
 $235,000Active2 beds 2 baths1,249 sq. ft.
600 E River, Tucson, AZ 85704
MLS# 22616569Listed by: PAUL JOHN CHARETTE - New
 $135,000Active0.58 Acres
1918 S Twinkling Starr Drive #00047, Tucson, AZ 85745
MLS# 7049695Listed by: LONG REALTY COVEY LUXURY PROPERTIES - New
 $387,000Active4 beds 3 baths1,507 sq. ft.
4927 E Adams, Tucson, AZ 85712
MLS# 22616547Listed by: EPIQUE REALTY - New
 $435,000Active5 beds 3 baths2,562 sq. ft.
5526 E 20th, Tucson, AZ 85711
MLS# 22616548Listed by: 1912 REALTY - New
 $649,000Active4 beds 3 baths2,822 sq. ft.
7411 E Calle Cabo, Tucson, AZ 85750
MLS# 22616549Listed by: RUSS LYON SOTHEBY'S INTERNATIONAL REALTY - New
 $350,000Active4 beds 3 baths1,875 sq. ft.
9617 E Glasgow, Tucson, AZ 85747
MLS# 22616550Listed by: LONG REALTY - New
 $254,900Active4 beds 2 baths1,495 sq. ft.
672 W Calle Sevilla, Tucson, AZ 85756
MLS# 22616551Listed by: OMNI HOMES INTERNATIONAL - New
 $340,000Active4 beds 2 baths2,091 sq. ft.
3149 W Montana, Tucson, AZ 85746
MLS# 22616546Listed by: KELLER WILLIAMS ARIZONA REALTY - Open Fri, 7 to 10pmNew
 $675,000Active5 beds 4 baths2,571 sq. ft.
5636 S Creosote Ridge, Tucson, AZ 85747
MLS# 22614051Listed by: COLDWELL BANKER REALTY - New
 $285,000Active2 beds 1 baths886 sq. ft.
7088 S Camino Grande, Tucson, AZ 85746
MLS# 22614612Listed by: JASON MITCHELL REAL ESTATE - New
 $450,000Active5 beds 3 baths2,633 sq. ft.
6693 E Via Arroyo Largo, Tucson, AZ 85756
MLS# 22615059Listed by: TIERRA ANTIGUA REALTY - New
 $695,000Active2 beds 3 baths2,013 sq. ft.
5833 N Placita Del Baron, Tucson, AZ 85718
MLS# 22616240Listed by: CORDOVA REALTY - New
 $355,000Active4 beds 2 baths1,727 sq. ft.
10451 E Oakbrook, Tucson, AZ 85747
MLS# 22616333Listed by: REAL BROKER - New
 $405,000Active3 beds 2 baths1,746 sq. ft.
101 S Bonanza, Tucson, AZ 85748
MLS# 22616431Listed by: OMNI HOMES INTERNATIONAL - Open Sat, 2 to 6pmNew
 $475,000Active3 beds 2 baths2,087 sq. ft.
529 E Squirrel Tail, Tucson, AZ 85704
MLS# 22616495Listed by: TIERRA ANTIGUA REALTY - New
 $749,000Active-- beds -- baths2,820 sq. ft.
3516 E Florence, Tucson, AZ 85716
MLS# 22616510Listed by: REAL BROKER - New
 $295,000Active3 beds 2 baths1,107 sq. ft.
4791 E Joslyn Heights, Tucson, AZ 85712
MLS# 22616513Listed by: OMNI HOMES INTERNATIONAL - New
 $295,000Active3 beds 2 baths1,140 sq. ft.
1421 W Calle Plomo, Tucson, AZ 85745
MLS# 22616534Listed by: REAL BROKER - Open Sat, 1 to 3pmNew
 $479,000Active4 beds 2 baths1,953 sq. ft.
5414 E 3rd, Tucson, AZ 85711
MLS# 22616538Listed by: LONG REALTY - New
 $319,000Active3 beds 2 baths1,294 sq. ft.
2111 S Miramonte, Tucson, AZ 85713
MLS# 22616542Listed by: LONG REALTY - New
 $325,000Active3 beds 2 baths1,530 sq. ft.
1543 N Plaza De Lirios, Tucson, AZ 85745
MLS# 22616536Listed by: EXP REALTY - New
 $349,000Active3 beds 2 baths1,629 sq. ft.
2612 S Bonanza, Tucson, AZ 85730
MLS# 22616526Listed by: EXP REALTY - New
 $319,000Active3 beds 1 baths1,138 sq. ft.
5131 E Fairmount, Tucson, AZ 85712
MLS# 22616528Listed by: LONG REALTY - Open Sat, 1 to 4pmNew
 $469,900Active3 beds 3 baths1,922 sq. ft.
5364 N Entrada De Sabino, Tucson, AZ 85750
MLS# 22616529Listed by: REAL BROKER - New
 $625,000Active4 beds 2 baths1,598 sq. ft.
2217 N Tucson Boulevard, Tucson, AZ 85716
MLS# 7049495Listed by: OMNI HOMES INTERNATIONAL - New
 $320,000Active3 beds 2 baths1,661 sq. ft.
8965 E 35th, Tucson, AZ 85710
MLS# 22616499Listed by: RE/MAX EXCALIBUR REALTY - New
 $435,000Active5 beds 3 baths2,633 sq. ft.
6668 E Via Arroyo Azul, Tucson, AZ 85756
MLS# 22616500Listed by: COLDWELL BANKER REALTY - Open Sat, 2 to 5pmNew
 $350,000Active3 beds 2 baths1,479 sq. ft.
9224 E Baker, Tucson, AZ 85710
MLS# 22616503Listed by: EXP REALTY - New
 $170,000Active2 beds 1 baths820 sq. ft.
1921 W La Osa, Tucson, AZ 85705
MLS# 22616507Listed by: ENGEL & VOLKERS TUCSON - Open Sat, 5 to 7:30pmNew
 $375,000Active2 beds 2 baths1,464 sq. ft.
10446 E Sara Scarlet, Tucson, AZ 85747
MLS# 22616512Listed by: REALTY EXECUTIVES ARIZONA TERRITORY - New
 $279,900Active4 beds 2 baths1,313 sq. ft.
7511 S Brackenbury, Tucson, AZ 85746
MLS# 22616516Listed by: REAL BROKER - New
 $221,000Active3 beds 2 baths1,555 sq. ft.
5343 S Via Baltra, Tucson, AZ 85706
MLS# 22616521Listed by: HOMESMART ADVANTAGE GROUP - New
 $850,000Active3 beds 3 baths2,261 sq. ft.
1230 E Placita Del Cervato, Tucson, AZ 85718
MLS# 22616523Listed by: LONG REALTY - New
 $200,000Active3 beds 2 baths1,568 sq. ft.
5801 E 2nd, Tucson, AZ 85711
MLS# 22616525Listed by: EXP REALTY - New
 $635,000Active4 beds 3 baths2,813 sq. ft.
100 N Eastern Slope, Tucson, AZ 85748
MLS# 22616468Listed by: TIERRA ANTIGUA REALTY - New
 $235,000Active2 beds 2 baths1,232 sq. ft.
978 W Lockwood, Tucson, AZ 85704
MLS# 22616469Listed by: REALTY EXECUTIVES ARIZONA TERRITORY - New
 $325,000Active3 beds 2 baths1,343 sq. ft.
10430 E Wishbone, Tucson, AZ 85748
MLS# 22616470Listed by: KELLER WILLIAMS INTEGRITY FIRST - New
 $149,900Active2 beds 1 baths894 sq. ft.
2601 W Broadway, Tucson, AZ 85745
MLS# 22616471Listed by: LONG REALTY - Open Fri, 6 to 9pmNew
 $320,000Active3 beds 2 baths2,074 sq. ft.
6619 E Scarlett, Tucson, AZ 85710
MLS# 22616472Listed by: REAL BROKER - New
 $115,000Active2 beds 1 baths639 sq. ft.
1810 E Blacklidge, Tucson, AZ 85719
MLS# 22616473Listed by: COLDWELL BANKER REALTY - Open Fri, 6 to 8pmNew
 $315,000Active3 beds 2 baths1,133 sq. ft.
8466 S Burien, Tucson, AZ 85747
MLS# 22616477Listed by: REAL BROKER - Open Sat, 12 to 3pmNew
 $310,000Active2 beds 1 baths1,080 sq. ft.
428 W Rosales, Tucson, AZ 85701
MLS# 22616479Listed by: LONG REALTY - New
 $310,000Active3 beds 2 baths1,387 sq. ft.
6161 N Tarragon, Tucson, AZ 85741
MLS# 22616482Listed by: REAL BROKER - New
 $264,000Active3 beds 2 baths1,636 sq. ft.
310 W Canada, Tucson, AZ 85706
MLS# 22616487Listed by: STEVENS REALTY & TAX SERVICE - Open Sat, 1 to 3pmNew
 $750,000Active5 beds 2 baths2,771 sq. ft.
2711 N Kiva, Tucson, AZ 85715
MLS# 22616491Listed by: TIERRA ANTIGUA REALTY - New
 $350,000Active3 beds 2 baths1,530 sq. ft.
6202 E Timrod, Tucson, AZ 85711
MLS# 22616494Listed by: INDIE REALTY, LLC - New
 $329,900Active3 beds 2 baths1,740 sq. ft.
5112 Dakota Vista, Tucson, AZ 85746
MLS# 22616497Listed by: EXP REALTY - New
 $549,990Active4 beds 3 baths3,211 sq. ft.
2611 N Teresa, Tucson, AZ 85745
MLS# 22616454Listed by: TIERRA ANTIGUA REALTY - New
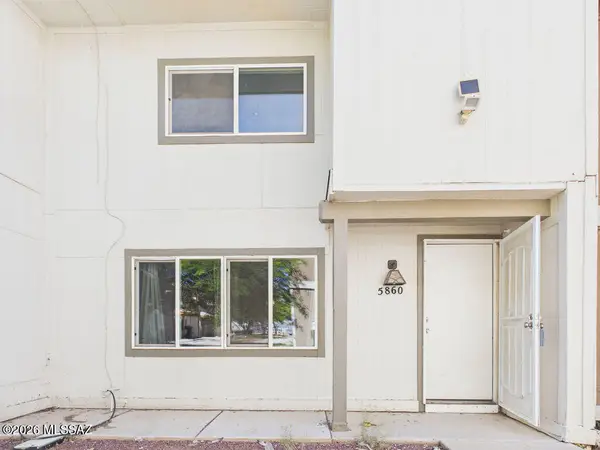 $175,000Active3 beds 3 baths1,402 sq. ft.
5860 S Del Moral, Tucson, AZ 85706
MLS# 22616456Listed by: EXP REALTY - New
 $340,000Active2 beds 2 baths1,330 sq. ft.
2264 E Camino Cancion, Tucson, AZ 85718
MLS# 22616459Listed by: TIERRA ANTIGUA REALTY - New
 $289,000Active2 beds 2 baths1,473 sq. ft.
6100 N Oracle, Tucson, AZ 85704
MLS# 22616462Listed by: REALTY EXECUTIVES ARIZONA TERRITORY - New
 $319,000Active4 beds 2 baths1,612 sq. ft.
2902 W Vermont, Tucson, AZ 85746
MLS# 22616465Listed by: KMS REALTY - New
 $189,000Active3 beds 2 baths1,187 sq. ft.
325 W Santa Paula, Tucson, AZ 85706
MLS# 22616466Listed by: EMBARC REALTY - Open Fri, 2 to 5pmNew
 $865,000Active4 beds 4 baths2,900 sq. ft.
935 S Fremont, Tucson, AZ 85719
MLS# 22616215Listed by: REALTY EXECUTIVES ARIZONA TERRITORY - New
 $364,900Active4 beds 2 baths1,538 sq. ft.
8244 S Lost Mountain, Tucson, AZ 85747
MLS# 22616435Listed by: REALTY EXECUTIVES ARIZONA TERRITORY - Open Sat, 12 to 3pmNew
 $825,000Active3 beds 2 baths1,898 sq. ft.
2615 E Manchester, Tucson, AZ 85716
MLS# 22616441Listed by: REAL BROKER - New
 $69,000Active2 beds 2 baths1,100 sq. ft.
3411 S Camino Seco, Tucson, AZ 85730
MLS# 22616443Listed by: EXP REALTY - New
 $115,000Active3 beds 2 baths1,440 sq. ft.
783 W Laguna, Tucson, AZ 85705
MLS# 22616447Listed by: LONG REALTY - Open Fri, 7 to 9pmNew
 $775,000Active5 beds 4 baths2,836 sq. ft.
2460 N Cavalry, Tucson, AZ 85749
MLS# 22616450Listed by: KELLER WILLIAMS SOUTHERN ARIZONA - New
 $295,000Active3 beds 2 baths1,140 sq. ft.
1432 W Calle Gallego, Tucson, AZ 85745
MLS# 22616451Listed by: RUSS LYON SOTHEBY'S INTERNATIONAL REALTY - New
 $378,880Active3 beds 2 baths1,729 sq. ft.
6872 E Calle De Oro, Tucson, AZ 85715
MLS# 22616452Listed by: MAC'S PRO REAL ESTATE - New
 $165,000Active1 beds 1 baths753 sq. ft.
1200 E River, Tucson, AZ 85718
MLS# 22616428Listed by: TIERRA ANTIGUA REALTY - Open Sat, 5 to 8pmNew
 $685,000Active3 beds 2 baths1,935 sq. ft.
6591 E Via Algardi, Tucson, AZ 85750
MLS# 22616425Listed by: COLDWELL BANKER REALTY - New
 $369,900Active3 beds 2 baths1,750 sq. ft.
6701 E Koralee, Tucson, AZ 85710
MLS# 22615562Listed by: TIERRA ANTIGUA REALTY - New
 $350,000Active2 beds 2 baths1,400 sq. ft.
5951 E Eli, Tucson, AZ 85711
MLS# 22615703Listed by: COLDWELL BANKER REALTY - Open Fri, 6 to 8pmNew
 $459,900Active4 beds 2 baths2,045 sq. ft.
2229 W Window Rock, Tucson, AZ 85745
MLS# 22616035Listed by: EXP REALTY - New
 $620,000Active-- beds -- baths2,908 sq. ft.
4155 E Bellevue, Tucson, AZ 85712
MLS# 22616351Listed by: REALTY EXECUTIVES ARIZONA TERRITORY - New
 $389,000Active3 beds 2 baths1,836 sq. ft.
7550 E Rio Verde, Tucson, AZ 85715
MLS# 22616369Listed by: REAL BROKER - New
 $525,000Active3 beds 2 baths1,886 sq. ft.
2845 N Vactor Ranch, Tucson, AZ 85715
MLS# 22616400Listed by: LONG REALTY - New
 $550,000Active3 beds 3 baths1,655 sq. ft.
2841 N Bentley, Tucson, AZ 85716
MLS# 22616404Listed by: RUSS LYON SOTHEBY'S INTERNATIONAL REALTY - New
 $265,000Active2 beds 1 baths981 sq. ft.
2613 N Calle De Romy, Tucson, AZ 85712
MLS# 22616411Listed by: OMNI HOMES INTERNATIONAL - Open Sun, 12 to 2pmNew
 $545,000Active3 beds 2 baths2,036 sq. ft.
5305 N Spring View, Tucson, AZ 85749
MLS# 22616416Listed by: RUSS LYON SOTHEBY'S INTERNATIONAL REALTY - New
 $52,000Active1 beds 1 baths750 sq. ft.
1735 S Jones, Tucson, AZ 85713
MLS# 22616417Listed by: NEXTHOME COMPLETE REALTY (DBA) - New
 $799,000Active3 beds 3 baths3,030 sq. ft.
10305 E Camino Tesote, Tucson, AZ 85749
MLS# 22616409Listed by: REAL BROKER - Open Sat, 1 to 9pmNew
 $317,900Active4 beds 2 baths1,935 sq. ft.
4029 E Big Game, Tucson, AZ 85706
MLS# 22616395Listed by: LONG REALTY - New
 $350,000Active3 beds 2 baths1,483 sq. ft.
7360 E Cll Nostalgico, Tucson, AZ 85715
MLS# 22616397Listed by: LONG REALTY - New
 $429,900Active6 beds 3 baths2,271 sq. ft.
1211 S 9th, Tucson, AZ 85713
MLS# 22616382Listed by: COLDWELL BANKER REALTY - New
 $465,000Active2 beds 2 baths1,291 sq. ft.
446 N Campbell, Tucson, AZ 85719
MLS# 22616384Listed by: WEST USA REALTY - New
 $1,395,000Active4 beds 3 baths4,410 sq. ft.
11280 E Broadway, Tucson, AZ 85748
MLS# 22616387Listed by: LONG REALTY - New
 $549,000Active3 beds 2 baths1,192 sq. ft.
611 E 4th, Tucson, AZ 85705
MLS# 22616391Listed by: TIERRA ANTIGUA REALTY - New
 $295,000Active3 beds 2 baths2,141 sq. ft.
9226 E 38th, Tucson, AZ 85730
MLS# 22616346Listed by: FOUND REALTY - New
 $295,000Active4 beds 2 baths1,124 sq. ft.
3451 W Avenida De San Candido, Tucson, AZ 85746
MLS# 22616375Listed by: REALTYFELIX.COM LLC - New
 $320,000Active2 beds 2 baths1,440 sq. ft.
4086 E Montecito, Tucson, AZ 85711
MLS# 22616377Listed by: STEVE LONG REALTY - New
 $399,000Active4 beds 2 baths2,108 sq. ft.
5583 S Swires, Tucson, AZ 85746
MLS# 22616354Listed by: OMNI HOMES INTERNATIONAL - New
 $215,000Active2 beds 1 baths828 sq. ft.
6540 E Barrow, Tucson, AZ 85730
MLS# 22616356Listed by: LONG REALTY - New
 $949,000Active4 beds 3 baths3,189 sq. ft.
5215 E Calle Del Ciervo, Tucson, AZ 85718
MLS# 22616326Listed by: TIERRA ANTIGUA REALTY - New
 $365,000Active3 beds 2 baths1,634 sq. ft.
1867 N Camino Alicante, Tucson, AZ 85715
MLS# 22616327Listed by: HELP-U-SELL REAL ESTATE - New
 $315,000Active3 beds 2 baths1,256 sq. ft.
1998 S Sylvester, Tucson, AZ 85713
MLS# 22616328Listed by: ENGEL & VOLKERS TUCSON - New
 $950,000Active3 beds 3 baths2,496 sq. ft.
10015 E Fort Lowell, Tucson, AZ 85749
MLS# 22616331Listed by: REALTY EXECUTIVES ARIZONA TERRITORY - New
 $159,900Active3 beds 2 baths1,152 sq. ft.
2934 W Century, Tucson, AZ 85746
MLS# 22616336Listed by: OMNI HOMES INTERNATIONAL - New
 $329,000Active4 beds 2 baths1,618 sq. ft.
9562 E Gershon, Tucson, AZ 85748
MLS# 22616337Listed by: PIMA VALLEY REALTY AND PROPERTY MANAGEMENT - New
 $330,000Active3 beds 2 baths1,380 sq. ft.
642 W Florence, Tucson, AZ 85705
MLS# 22616338Listed by: EXP REALTY - New
 $85,000Active2 beds 2 baths980 sq. ft.
1655 W Ajo, Tucson, AZ 85713
MLS# 22616345Listed by: REALTY EXECUTIVES ARIZONA TERRITORY - New
 $299,000Active3 beds 2 baths1,269 sq. ft.
8448 E Ruby, Tucson, AZ 85730
MLS# 22616348Listed by: REAL BROKER - New
 $249,000Active3 beds 2 baths1,092 sq. ft.
2665 N Leah, Tucson, AZ 85705
MLS# 22616349Listed by: HACIENDA BELLA REALTY & PROPER - New
 $875,000Active3 beds 3 baths2,776 sq. ft.
280 S Brown, Tucson, AZ 85710
MLS# 22616352Listed by: REALTY EXECUTIVES ARIZONA TERRITORY - New
 $780,000Active4 beds 3 baths2,444 sq. ft.
4554 N Avenida Del Cazador, Tucson, AZ 85718
MLS# 22615272Listed by: OMNI HOMES INTERNATIONAL - New
 $170,000Active3.18 Acres
3420 W Milton, Tucson, AZ 85746
MLS# 22616301Listed by: JASON MITCHELL REAL ESTATE - New
 $450,000Active5 beds 3 baths2,908 sq. ft.
10650 E Bridgeport, Tucson, AZ 85747
MLS# 22616306Listed by: COLDWELL BANKER REALTY - New
 $545,000Active-- beds -- baths3,737 sq. ft.
138 W District, Tucson, AZ 85714
MLS# 22616313Listed by: REAL BROKER - New
 $217,500Active1 beds 1 baths753 sq. ft.
5051 N Sabino Canyon, Tucson, AZ 85750
MLS# 22616322Listed by: KELLER WILLIAMS SOUTHERN ARIZONA - New
 $219,000Active2 beds 2 baths1,207 sq. ft.
2825 W Jennie, Tucson, AZ 85713
MLS# 22616324Listed by: REAL BROKER - New
 $17,000Active1 beds 1 baths425 sq. ft.
5735 S Hildreth, Tucson, AZ 85746
MLS# 22616957Listed by: REAL BROKER - New
 $165,000Active0.13 Acres
710 N Echols, Tucson, AZ 85705
MLS# 22616295Listed by: ARMENTA REALTY, LLC - New
 $328,000Active3 beds 2 baths1,184 sq. ft.
7821 E Joshua, Tucson, AZ 85730
MLS# 22614623Listed by: NEXTHOME COMPLETE REALTY (DBA) - New
 $264,900Active2 beds 1 baths932 sq. ft.
2451 N Richey, Tucson, AZ 85716
MLS# 22614710Listed by: HABITATION REALTY ERA POWERED - New
 $550,000Active4 beds 3 baths1,978 sq. ft.
735 E Drachman, Tucson, AZ 85719
MLS# 22615682Listed by: REAL BROKER - New
 $275,000Active3 beds 2 baths1,140 sq. ft.
2672 S Black Moon, Tucson, AZ 85730
MLS# 22616280Listed by: REAL BROKER - New
 $145,000Active2 beds 1 baths816 sq. ft.
2841 N Columbus, Tucson, AZ 85712
MLS# 22616282Listed by: KELLER WILLIAMS SOUTHERN ARIZONA - New
 $425,000Active4 beds 3 baths2,080 sq. ft.
9051 E Cooper, Tucson, AZ 85710
MLS# 22616286Listed by: WOW REAL ESTATE LLC - New
 $350,000Active3 beds 2 baths1,485 sq. ft.
7394 E Placita Luz De La Luna, Tucson, AZ 85715
MLS# 22616290Listed by: LONG REALTY - New
 $325,000Active3 beds 2 baths1,652 sq. ft.
1208 S Brown, Tucson, AZ 85710
MLS# 22616274Listed by: BLUE FOX PROPERTIES, LLC - New
 $290,000Active2 beds 2 baths1,570 sq. ft.
4210 N Limberlost, Tucson, AZ 85705
MLS# 22616275Listed by: EXP REALTY  $370,750Pending4 beds 2 baths1,602 sq. ft.
7328 S Gray Jay, Tucson, AZ 85747
MLS# 22616258Listed by: MTH REALTY LLC- Open Sat, 1 to 3pmNew
 $295,000Active2 beds 2 baths1,025 sq. ft.
3412 N Catalina, Tucson, AZ 85712
MLS# 22616263Listed by: BERKSHIRE HATHAWAY HOMESERVICES ARIZONA PROPERTIES - New
 $511,090Active4 beds 3 baths2,338 sq. ft.
7570 S Kinglet, Tucson, AZ 85747
MLS# 22616264Listed by: MTH REALTY LLC - New
 $199,900Active3 beds 2 baths1,300 sq. ft.
5632 E Calle Aurora, Tucson, AZ 85711
MLS# 22616252Listed by: TIERRA ANTIGUA REALTY - New
 $305,900Active3 beds 2 baths1,745 sq. ft.
6343 S Rigby, Tucson, AZ 85746
MLS# 22616253Listed by: COLDWELL BANKER REALTY - Open Sat, 2 to 4pmNew
 $369,900Active4 beds 3 baths2,055 sq. ft.
9181 E Sugar Sumac, Tucson, AZ 85747
MLS# 22616255Listed by: LONG REALTY - New
 $295,000Active3 beds 2 baths1,511 sq. ft.
5149 S Via Laguna Blanca, Tucson, AZ 85706
MLS# 22616256Listed by: REALTYFELIX.COM LLC - New
 $385,840Active4 beds 2 baths1,602 sq. ft.
7322 S Gray Jay, Tucson, AZ 85747
MLS# 22616245Listed by: MTH REALTY LLC - New
 $615,000Active-- beds -- baths2,583 sq. ft.
3251-3257 N Stone, Tucson, AZ 85705
MLS# 22616231Listed by: DIAMONDBACK REAL ESTATE - New
 $234,500Active3 beds 2 baths1,232 sq. ft.
6120 E Thunder River, Tucson, AZ 85756
MLS# 22616242Listed by: EMPIRE MANAGEMENT - New
 $275,000Active0.82 Acres
438 E Mohave, Tucson, AZ 85705
MLS# 22616244Listed by: HOT CASA REAL ESTATE - New
 $360,000Active3 beds 3 baths1,959 sq. ft.
2914 W Wyoming, Tucson, AZ 85746
MLS# 22616219Listed by: LONG REALTY - New
 $325,000Active4 beds 2 baths1,600 sq. ft.
6815 E Mary, Tucson, AZ 85730
MLS# 22616225Listed by: REALTY EXECUTIVES ARIZONA TERRITORY - Open Sat, 2 to 5pmNew
 $305,000Active3 beds 2 baths1,404 sq. ft.
3560 W Avenida Sombra, Tucson, AZ 85746
MLS# 22616208Listed by: TIERRA ANTIGUA REALTY - New
 $369,000Active4.9 Acres
E Palo Verde, Tucson, AZ 85718
MLS# 22616210Listed by: LONG REALTY - New
 $32,000Active1 beds 1 baths400 sq. ft.
8989 E Escalante, Tucson, AZ 85730
MLS# 22616211Listed by: KELLER WILLIAMS REALTY PHOENIX - New
 $75,000Active1 beds 1 baths785 sq. ft.
2525 N Alvernon, Tucson, AZ 85712
MLS# 22616217Listed by: LONG REALTY - New
 $220,000Active3 beds 2 baths1,354 sq. ft.
68 N Camino Imagen, Tucson, AZ 85748
MLS# 22616204Listed by: REALTY EXECUTIVES ARIZONA TERRITORY - New
 $749,000Active4 beds 2 baths2,023 sq. ft.
6160 N Placita Manantial La Paloma, Tucson, AZ 85718
MLS# 22616205Listed by: HOMESMART ADVANTAGE GROUP - New
 $214,900Active2 beds 1 baths803 sq. ft.
3744 E 27th, Tucson, AZ 85713
MLS# 22614815Listed by: WEST USA REALTY
Local realty services provided by:CENTURY 21 Success Realty, CENTURY 21 Arizona Foothills
The data relating to real estate listings on this website comes in part from the Internet Data Exchange (IDX) program of Multiple Listing Service of Southern Arizona. IDX information is provided exclusively for consumers' personal, non-commercial use and may not be used for any purpose other than to identify prospective properties consumers may be interested in purchasing. Listings provided by brokerages other than CENTURY 21 Success Realty are identified with the MLSSAZ IDX Logo. All information is deemed reliable but is not guaranteed accurate. Listing information Copyright 2026 MLS of Southern Arizona. All Rights Reserved. TU Member Broker: Gabriel Gastelum
Neighborhoods near Tucson, AZ
Zip codes near Tucson, AZ
- 85641 homes for sale
- 85701 homes for sale
- 85705 homes for sale
- 85706 homes for sale
- 85710 homes for sale
- 85711 homes for sale
- 85712 homes for sale
- 85713 homes for sale
- 85714 homes for sale
- 85715 homes for sale
- 85716 homes for sale
- 85718 homes for sale
- 85719 homes for sale
- 85730 homes for sale
- 85746 homes for sale
- 85747 homes for sale
- 85748 homes for sale
- 85749 homes for sale
- 85750 homes for sale
- 85756 homes for sale
Popular searches near Tucson, AZ
- Casas Adobes homes for sale
- Catalina homes for sale
- Catalina Foothills homes for sale
- Corona De Tucson homes for sale
- Drexel Heights homes for sale
- Flowing Wells homes for sale
- Green Valley homes for sale
- J - Six Ranchettes homes for sale
- Mt Lemmon homes for sale
- Oro Valley homes for sale
- Rincon Valley homes for sale
- Sahuarita homes for sale
- South Tucson homes for sale
- Summerhaven homes for sale
- Summit homes for sale
- Tanque Verde homes for sale
- Tucson Estates homes for sale
- Tucson Mountains homes for sale
- Vail homes for sale
- Valencia West homes for sale
Protect your home and budget from life's surprises with an Assurant Home Warranty, backed by a partner that supports you through every step of homeownership. Explore Plans.
©2026 Century 21 Real Estate LLC. All rights reserved. CENTURY 21®, the CENTURY 21 Logo and C21® are service marks owned by Century 21 Real Estate LLC. Century 21 Real Estate LLC fully supports the principles of the Fair Housing Act and the Equal Opportunity Act. Each office is independently owned and operated. Listing information is deemed reliable but not guaranteed accurate.