- Bayou St. John, New Orleans homes for sale
- Broadmoor, New Orleans homes for sale
- Burtheville, New Orleans homes for sale
- Central Business District, New Orleans homes for sale
- Central City, New Orleans homes for sale
- Dixon, New Orleans homes for sale
- Fairgrounds, New Orleans homes for sale
- Fountainbleau, New Orleans homes for sale
- French Quarter, New Orleans homes for sale
- Freret, New Orleans homes for sale
- Garden District, New Orleans homes for sale
- Gert Town, New Orleans homes for sale
- Hurtsville, New Orleans homes for sale
- Lower Garden District, New Orleans homes for sale
- Marigny, New Orleans homes for sale
- Mid-City, New Orleans homes for sale
- Milan, New Orleans homes for sale
- Seventh Ward, New Orleans homes for sale
- Tremé / Lafitte, New Orleans homes for sale
- Uptown, New Orleans homes for sale
Tulane, New Orleans, LA - homes for sale
42 of 42 results displayed
- New
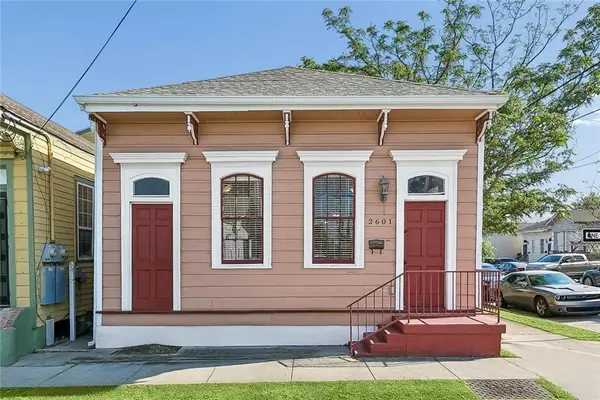 $259,000Active3 beds 2 baths1,475 sq. ft.
2601 Palmyra Street, New Orleans, LA 70119
MLS# 2549962Listed by: NORF REALTY LLC - New
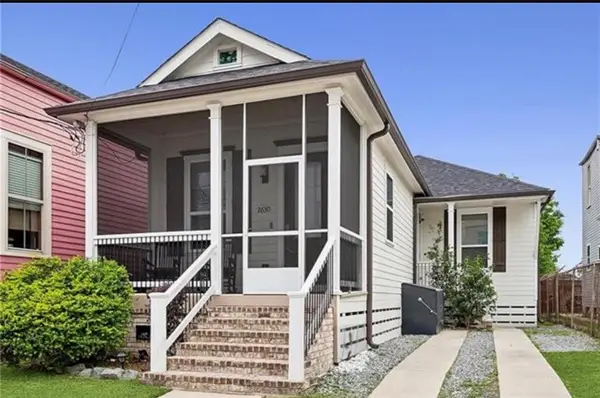 $500,000Active4 beds 3 baths2,045 sq. ft.
2630 Cleveland Avenue, New Orleans, LA 70119
MLS# 2549184Listed by: SAMANTHA BUSH REAL ESTATE SERVICES LLC 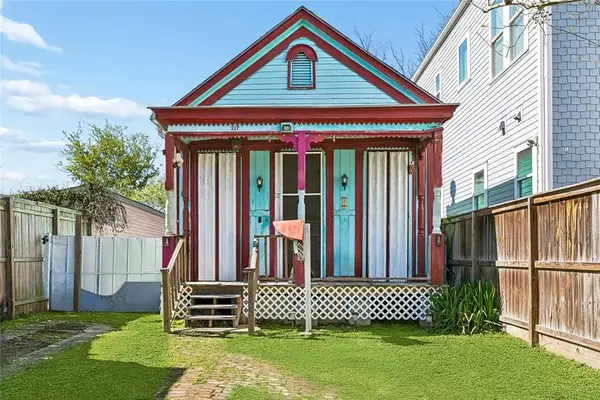 $185,000Active2 beds 1 baths1,140 sq. ft.
217 N Miro Street, New Orleans, LA 70119
MLS# 2548386Listed by: REDFIN CORPORATION $450,000Active-- beds -- baths3,070 sq. ft.
4033-35 Palmyra Street, New Orleans, LA 70119
MLS# NO2547003Listed by: WITRY COLLECTIVE, L.L.C.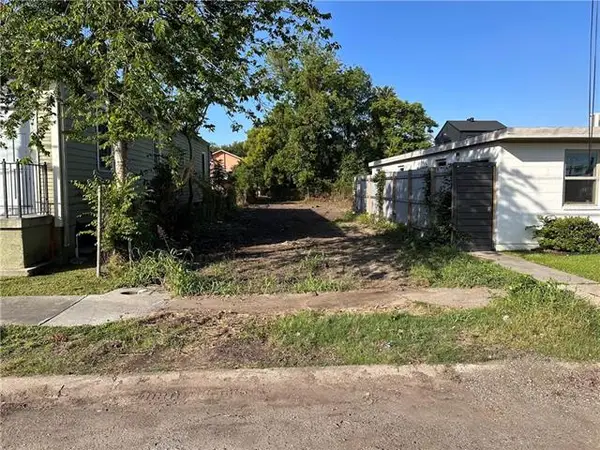 $85,000Pending0.1 Acres
2532 Conti Street, New Orleans, LA 70119
MLS# NO2546126Listed by: REVE, REALTORS $399,000Active-- beds -- baths1,750 sq. ft.
539-41 S Miro Street, New Orleans, LA 70119
MLS# NO2543181Listed by: CRESCENT SOTHEBY'S INTERNATIONAL $557,000Active3 beds 3 baths2,046 sq. ft.
2322 Saint Louis Street, New Orleans, LA 70119
MLS# 2540670Listed by: FALAYA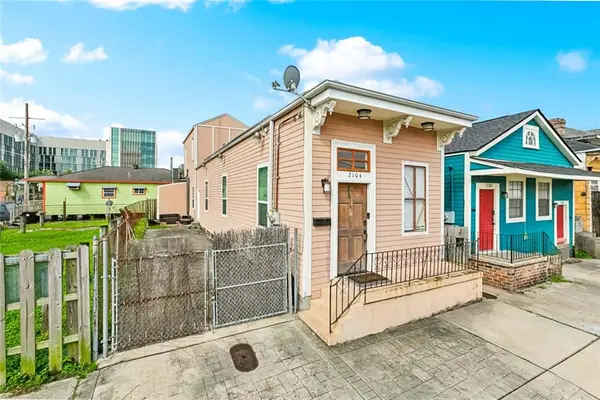 $259,000Active3 beds 2 baths2,164 sq. ft.
2104 Iberville Street, New Orleans, LA 70112
MLS# 2543308Listed by: GALIANO REALTY $640,000Active6 beds 6 baths2,758 sq. ft.
2009 Conti Street, New Orleans, LA 70112
MLS# 2541498Listed by: BRIDGEWATER REALTY ADVISORS, LLC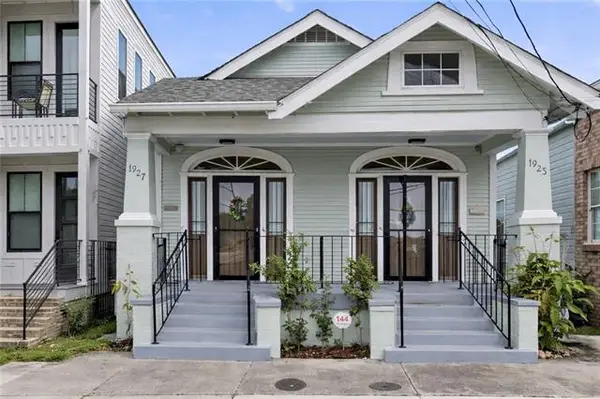 $474,900Active-- beds -- baths2,752 sq. ft.
1925-27 Iberville Street, New Orleans, LA 70112
MLS# NO2539966Listed by: KELLER WILLIAMS REALTY 455-0100 $474,900Active6 beds 3 baths2,752 sq. ft.
1925 27 Iberville Street, New Orleans, LA 70112
MLS# 2539966Listed by: KELLER WILLIAMS REALTY 455-0100 $410,000Active5 beds 4 baths2,115 sq. ft.
2328 30 Bienville Street, New Orleans, LA 70119
MLS# 2535525Listed by: EXP REALTY, LLC $189,000Active3 beds 2 baths1,125 sq. ft.
2436 Gravier Street, New Orleans, LA 70119
MLS# 2534459Listed by: THE COLETURE REAL ESTATE BROKERAGE LLC $350,000Active8 beds 4 baths3,376 sq. ft.
Address Withheld By Seller, New Orleans, LA 70119
MLS# NO2532786Listed by: REVE, REALTORS $355,000Active4 beds 2 baths1,418 sq. ft.
222 S Dorgenois Street, New Orleans, LA 70119
MLS# 2530667Listed by: BRIDGEWATER REALTY ADVISORS, LLC $310,000Active4 beds 3 baths1,644 sq. ft.
527 S Galvez Street, New Orleans, LA 70119
MLS# 2529209Listed by: HOMESMART REALTY SOUTH $290,000Active3 beds 2 baths2,075 sq. ft.
324 S Roadway Street #N-31, New Orleans, LA 70124
MLS# NO2441302Listed by: KELLER WILLIAMS REALTY 455-0100 $123,000Active0.08 Acres
314 N Roman Street, New Orleans, LA 70112
MLS# NO2518077Listed by: DN REALTY, LLC $270,000Active3 beds 2 baths1,137 sq. ft.
326 N Tonti Street, New Orleans, LA 70119
MLS# RANO2491204Listed by: HOSPITALITY REALTY $120,000Active4 beds 3 baths1,960 sq. ft.
2530 Cleveland Avenue, New Orleans, LA 70119
MLS# RANO2520965Listed by: LATTER & BLUM (LATT10) $124,000Active1 beds 1 baths683 sq. ft.
415 Manasses Place, New Orleans, LA 70119
MLS# 2524310Listed by: CRESCENT CITY LIVING, LLC $185,000Active-- beds -- baths1,193 sq. ft.
2543-45 Gravier Street, New Orleans, LA 70119
MLS# NO2505532Listed by: ABEK REAL ESTATE $539,000Active5 beds 3 baths2,111 sq. ft.
417 N Galvez Street, New Orleans, LA 70119
MLS# RANO2502551Listed by: TALBOT REALTY GROUP $1,200,000Active0 Acres
2536 Tulane Avenue, New Orleans, LA 70119
MLS# NO2474225Listed by: BEN & BURKA $1,299,000Active0.75 Acres
1801-39 Iberville Street, New Orleans, LA 70112
MLS# NO2495959Listed by: THE MCENERY COMPANY $174,900Active2 beds 1 baths1,235 sq. ft.
2525 Banks Street, New Orleans, LA 70119
MLS# RANO2488462Listed by: AUDUBON REALTY, LLC $157,500Active0.05 Acres
422 N Prieur Street, New Orleans, LA 70112
MLS# 2523754Listed by: ROBINSON REALTY $157,500Active0.07 Acres
1924 Saint Louis Street, New Orleans, LA 70112
MLS# 2523752Listed by: ROBINSON REALTY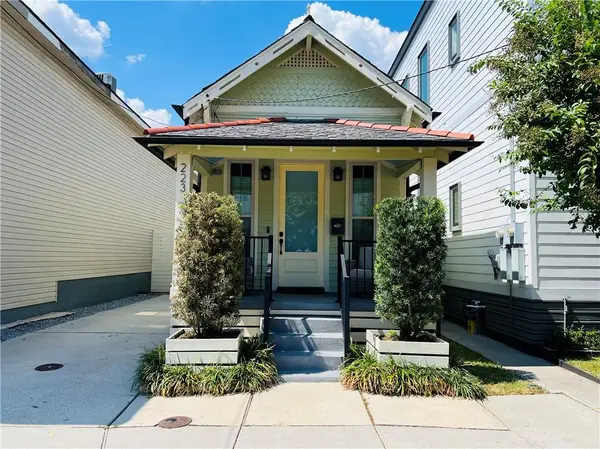 $314,900Active2 beds 2 baths1,100 sq. ft.
223 S Rocheblave Street, New Orleans, LA 70119
MLS# 2522025Listed by: J. RELF REALTY, INC. $123,000Active0.08 Acres
314 N Roman Street, New Orleans, LA 70112
MLS# 2518077Listed by: DN REALTY, LLC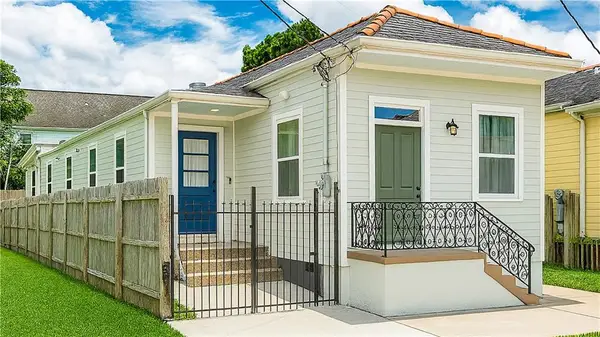 $399,000Active3 beds 2 baths1,198 sq. ft.
528 S Rocheblave Street, New Orleans, LA 70119
MLS# 2515880Listed by: KELLER WILLIAMS REALTY NEW ORLEANS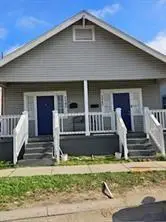 $185,000Active2 beds 2 baths1,193 sq. ft.
2543-45 Gravier Street, New Orleans, LA 70119
MLS# 2505532Listed by: ABEK REAL ESTATE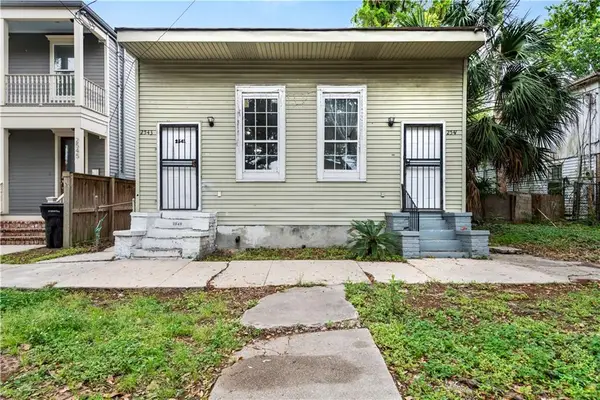 $255,000Active4 beds 2 baths1,577 sq. ft.
2541 Bienville Street, New Orleans, LA 70119
MLS# 2534706Listed by: BROCKS REALTY LLC $1,299,000Active0.75 Acres
1801-39 Iberville Street, New Orleans, LA 70112
MLS# 2495959Listed by: THE MCENERY COMPANY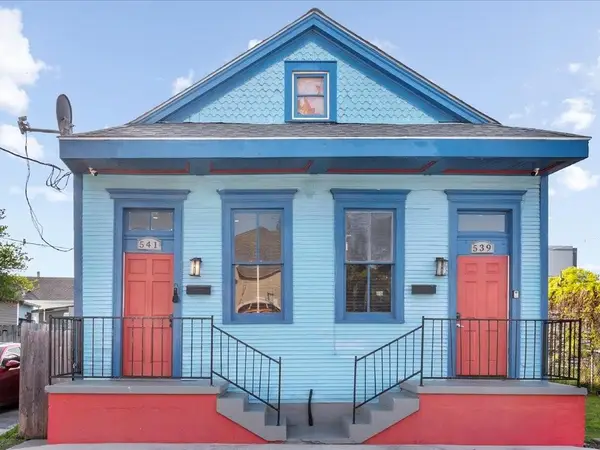 $399,000Active4 beds 2 baths1,750 sq. ft.
539 41 S Miro Street, New Orleans, LA 70119
MLS# 2543181Listed by: CRESCENT SOTHEBY'S INTERNATIONAL $375,000Active0 Acres
2120 Iberville Street, New Orleans, LA 70112
MLS# 2488394Listed by: LEONE GNO REALTY LLC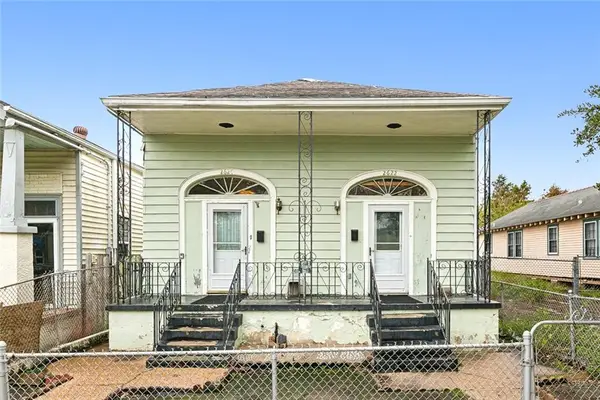 $159,000Active5 beds 2 baths1,785 sq. ft.
2620 22 Bienville Street, New Orleans, LA 70119
MLS# 2517489Listed by: BERKSHIRE HATHAWAY HOMESERVICES PREFERRED, REALTOR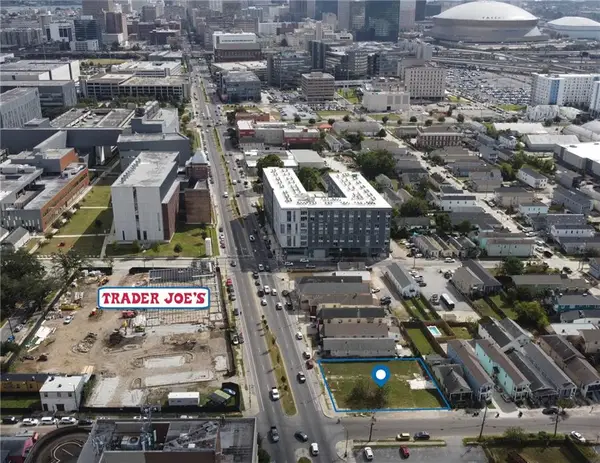 $1,200,000Active0.26 Acres
2536 Tulane Avenue, New Orleans, LA 70119
MLS# 2474225Listed by: BEN & BURKA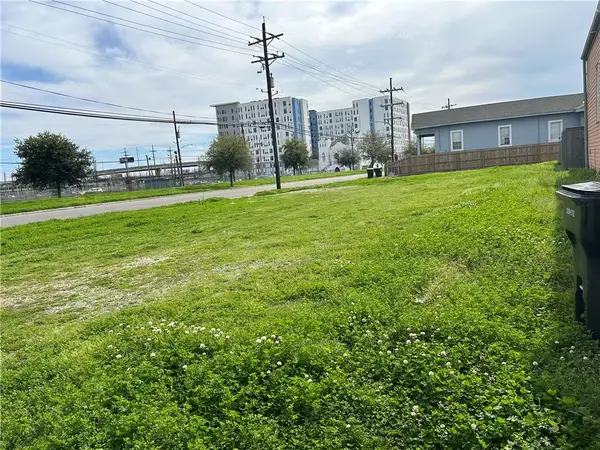 $350,000Active0 Acres
2206 Gravier Street, New Orleans, LA 70119
MLS# 2512777Listed by: FRERET REALTY $350,000Active0.09 Acres
517 S Galvez Street, New Orleans, LA 70119
MLS# 2512778Listed by: FRERET REALTY $350,000Active0 Acres
2200 Gravier Street, New Orleans, LA 70119
MLS# 2512780Listed by: FRERET REALTY $290,000Active3 beds 2 baths2,075 sq. ft.
324 S Roadway Street #N-31, New Orleans, LA 70124
MLS# 2441302Listed by: KELLER WILLIAMS REALTY 455-0100
Local realty services provided by:CENTURY 21 Investment Realty, CENTURY 21 Action Realty
Popular neighborhoods near Tulane, New Orleans, LA
Zip codes near Tulane, New Orleans, LA
- 70001 homes for sale
- 70005 homes for sale
- 70032 homes for sale
- 70053 homes for sale
- 70056 homes for sale
- 70058 homes for sale
- 70112 homes for sale
- 70113 homes for sale
- 70114 homes for sale
- 70115 homes for sale
- 70116 homes for sale
- 70117 homes for sale
- 70118 homes for sale
- 70119 homes for sale
- 70121 homes for sale
- 70122 homes for sale
- 70124 homes for sale
- 70125 homes for sale
- 70126 homes for sale
- 70130 homes for sale
Counties near Tulane, New Orleans, LA
- Ascension County homes for sale
- Assumption County homes for sale
- East Baton Rouge County homes for sale
- Hancock County homes for sale
- Harrison County homes for sale
- Jefferson County homes for sale
- Lafourche County homes for sale
- Livingston County homes for sale
- Orleans County homes for sale
- Pearl River County homes for sale
- Plaquemines County homes for sale
- St. Bernard County homes for sale
- St. Charles County homes for sale
- St. Helena County homes for sale
- St. James County homes for sale
- St. John the Baptist County homes for sale
- St. Tammany County homes for sale
- Tangipahoa County homes for sale
- Terrebonne County homes for sale
- Washington County homes for sale
Protect your home and budget from life's surprises with an Assurant Home Warranty, backed by a partner that supports you through every step of homeownership. Explore Plans.
©2026 Century 21 Real Estate LLC. All rights reserved. CENTURY 21®, the CENTURY 21 Logo and C21® are service marks owned by Century 21 Real Estate LLC. Century 21 Real Estate LLC fully supports the principles of the Fair Housing Act and the Equal Opportunity Act. Each office is independently owned and operated. Listing information is deemed reliable but not guaranteed accurate.