- California homes for sale
- Concord homes for sale
- Drasco homes for sale
- Francis homes for sale
- Giles homes for sale
- Grassey homes for sale
- Healing Springs homes for sale
- Heber homes for sale
- Heber Springs homes for sale
- McJester homes for sale
- Mountain homes for sale
- Pangburn homes for sale
- Peter Creek homes for sale
- Pickens homes for sale
- Prim homes for sale
- Sugar Loaf homes for sale
- Township 1 homes for sale
- Township 2 homes for sale
- Tumbling Shoals homes for sale
- Valley homes for sale
72581, AR - homes for sale
18 of 18 results displayed
- New
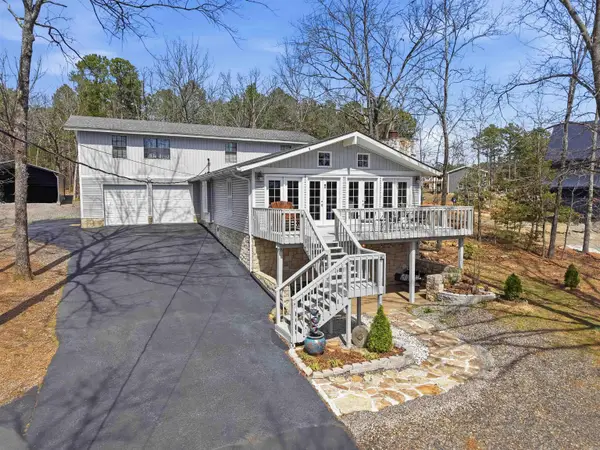 $559,900Active4 beds 3 baths3,092 sq. ft.
340 Belmont Acres Circle, Tumbling Shoals, AR 72581
MLS# 26010545Listed by: MCKENZIE REALTY GROUP - New
 $37,900Active0.76 Acres
000 Harrelson Road, Tumbling Shoals, AR 72581
MLS# 26010528Listed by: MCKENZIE REALTY GROUP - New
 $129,900Active3 beds 2 baths1,008 sq. ft.
49 Harrelson Road, Heber Springs, AR 72581
MLS# 26010531Listed by: MCKENZIE REALTY GROUP 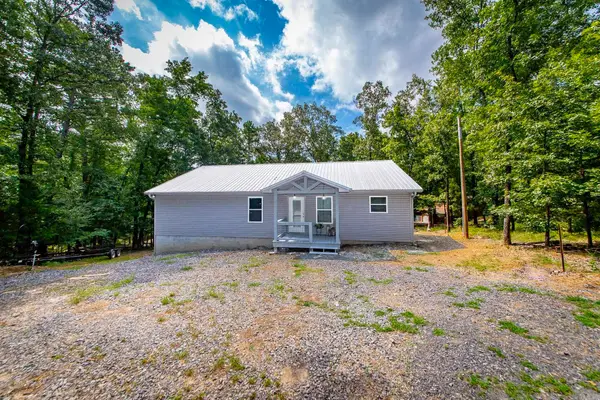 $319,000Active3 beds 2 baths1,248 sq. ft.
277 Highland Drive, Tumbling Shoals, AR 72581
MLS# 26008394Listed by: PORCHLIGHT REALTY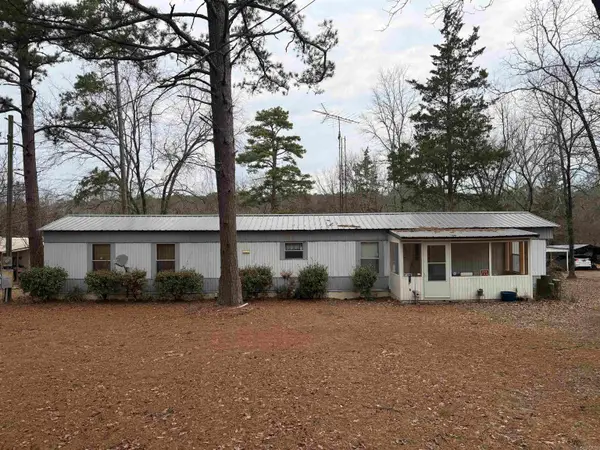 $85,000Active2 beds 2 baths1,134 sq. ft.
42 Lake Forest Estate Road, Tumbling Shoals, AR 72581
MLS# 26007685Listed by: VYLLA HOME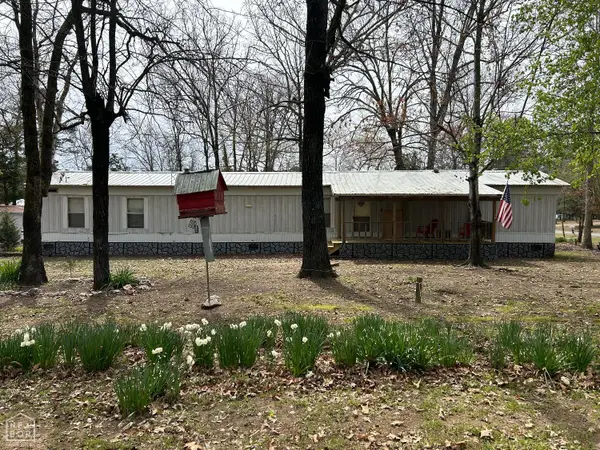 $159,900Active3 beds 2 baths1,280 sq. ft.
4 Starview Lane, Tumbling Shoals, AR 72581
MLS# 10127934Listed by: COLDWELL BANKER VILLAGE COMMUNITIES INC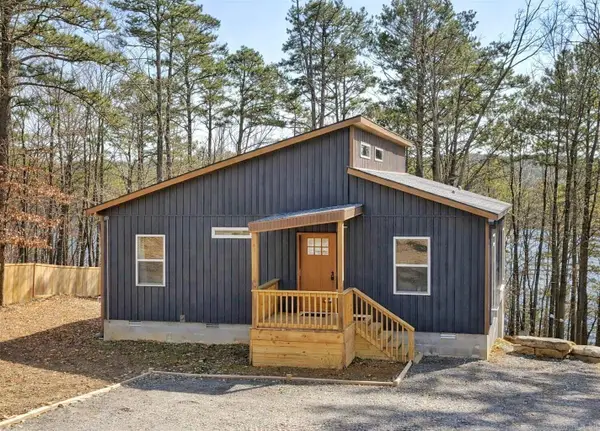 $449,900Active3 beds 2 baths1,250 sq. ft.
272 Highland Road, Tumbling Shoals, AR 72581
MLS# 26006825Listed by: IREALTY ARKANSAS - SHERWOOD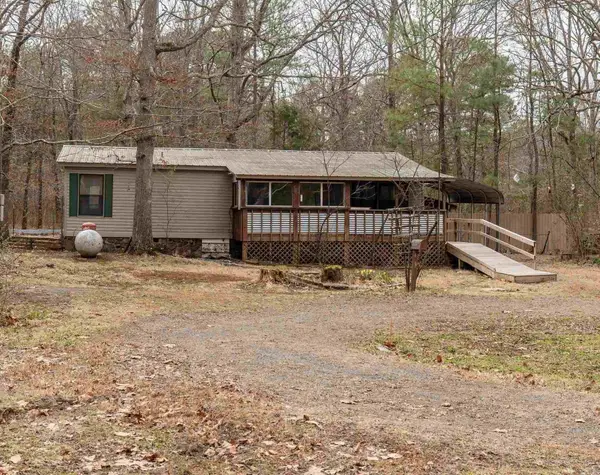 $167,500Active2 beds 3 baths1,440 sq. ft.
Address Withheld By Seller, Tumbling Shoals, AR 72581
MLS# 26006449Listed by: CRYE*LEIKE BROCK REAL ESTATE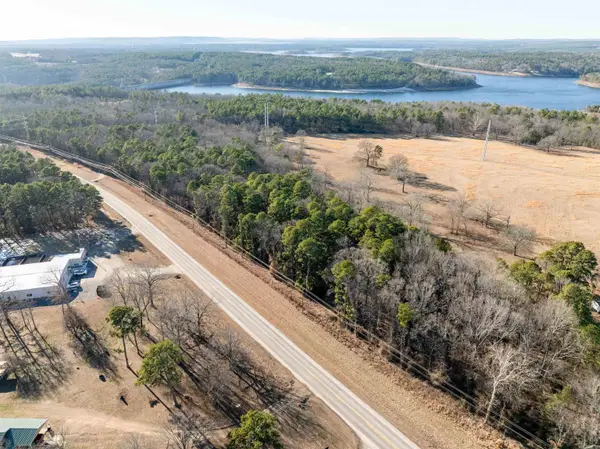 $360,000Active30 Acres
Address Withheld By Seller, Tumbling Shoals, AR 72581
MLS# 26005136Listed by: EXP REALTY $550,000Active2 beds 2 baths2,515 sq. ft.
949 Dekalb Road, Tumbling Shoals, AR 72581
MLS# 26002248Listed by: RE/MAX ADVANTAGE HEBER SPRINGS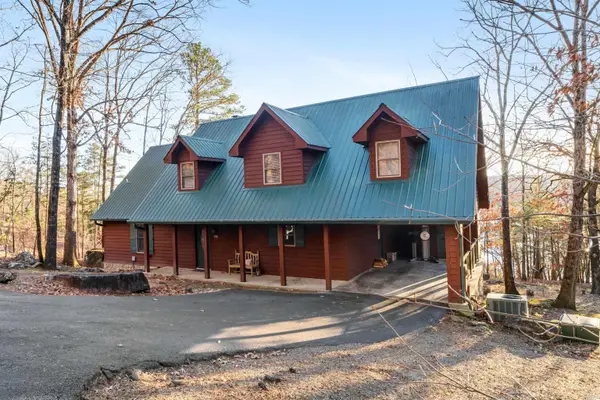 $699,000Active3 beds 3 baths2,038 sq. ft.
180 Lookout Dr., Tumbling Shoals, AR 72581
MLS# 26000271Listed by: RE/MAX ADVANTAGE HEBER SPRINGS $305,000Active3 beds 2 baths1,878 sq. ft.
399 Lake Forest Estates, Tumbling Shoals, AR 72581
MLS# 25049809Listed by: RE/MAX ADVANTAGE HEBER SPRINGS- New
 $299,000Active4 beds 3 baths2,408 sq. ft.
264 Harrelson Road, Tumbling Shoals, AR 72581
MLS# 26010530Listed by: MCKENZIE REALTY GROUP  $799,900Active5 beds 3 baths3,611 sq. ft.
249 Lookout Drive, Tumbling Shoals, AR 72581
MLS# 25047620Listed by: RE/MAX ADVANTAGE HEBER SPRINGS $595,000Active14.79 Acres
14.79 Acres Rocky Ridge Road, Heber Springs, AR 72581
MLS# 25036322Listed by: COLDWELL BANKER HARRIS MCHANEY & FAUCETTE $249,900Active3 beds 2 baths1,504 sq. ft.
1835 Heber Springs Road N, Heber Springs, AR 72543
MLS# 25046708Listed by: RE/MAX ADVANTAGE HEBER SPRINGS $159,000Active3 beds 1 baths1,507 sq. ft.
4 Persimmon Ln, Tumbling Shoals, AR 72581
MLS# 25045338Listed by: MCKIMMEY ASSOCIATES REALTORS NLR $185,000Active3 beds 2 baths2,041 sq. ft.
189 Wallace, Tumbling Shoals, AR 72581
MLS# 26004342Listed by: CRYE*LEIKE BROCK REAL ESTATE
Local realty services provided by:CENTURY 21 United, CENTURY 21 PORTFOLIO
Popular searches near 72581
Popular neighborhoods near 72581
- Capitol View, Little Rock homes for sale
- Diaz, Newport homes for sale
- Downtown Little Rock, Little Rock homes for sale
- Evergreen, Little Rock homes for sale
- Gap Creek, Sherwood homes for sale
- Hanger Hill, Little Rock homes for sale
- Heights, Little Rock homes for sale
- Hillcrest, Little Rock homes for sale
- Kingwood, Little Rock homes for sale
- Leawood, Little Rock homes for sale
- Macarthur Park, Little Rock homes for sale
- Meriwether, Little Rock homes for sale
- Newport, Newport homes for sale
- Pinnacle Valley, Little Rock homes for sale
- Pulaski Heights, Little Rock homes for sale
- River Market, Little Rock homes for sale
- River Ridge, Little Rock homes for sale
- Sturbridge, Little Rock homes for sale
- The Country Club of Arkansas, Maumelle homes for sale
- Tuckerman, Tuckerman homes for sale
Counties near Tumbling Shoals, 72581
- Baxter County homes for sale
- Cleburne County homes for sale
- Conway County homes for sale
- Faulkner County homes for sale
- Fulton County homes for sale
- Independence County homes for sale
- Izard County homes for sale
- Jackson County homes for sale
- Lawrence County homes for sale
- Lonoke County homes for sale
- Marion County homes for sale
- Pope County homes for sale
- Prairie County homes for sale
- Pulaski County homes for sale
- Searcy County homes for sale
- Sharp County homes for sale
- Stone County homes for sale
- Van Buren County homes for sale
- White County homes for sale
- Woodruff County homes for sale
Protect your home and budget from life's surprises with an Assurant Home Warranty, backed by a partner that supports you through every step of homeownership. Explore Plans.
©2026 Century 21 Real Estate LLC. All rights reserved. CENTURY 21®, the CENTURY 21 Logo and C21® are service marks owned by Century 21 Real Estate LLC. Century 21 Real Estate LLC fully supports the principles of the Fair Housing Act and the Equal Opportunity Act. Each office is independently owned and operated. Listing information is deemed reliable but not guaranteed accurate.