- Annville homes for sale
- Beattyville homes for sale
- Big Creek homes for sale
- Booneville homes for sale
- Burning Springs homes for sale
- Bush homes for sale
- East Bernstadt homes for sale
- Greenmount-Langnau homes for sale
- Livingston homes for sale
- Manchester homes for sale
- McKee homes for sale
- Oneida homes for sale
- Orlando homes for sale
- St Helens homes for sale
- Sandgap homes for sale
- Sibert-Hima homes for sale
- Southwest Lee homes for sale
- Sturgeon homes for sale
- Tyner homes for sale
- Wagersville-South Irvine homes for sale
40486, KY - homes for sale
8 of 8 results displayed
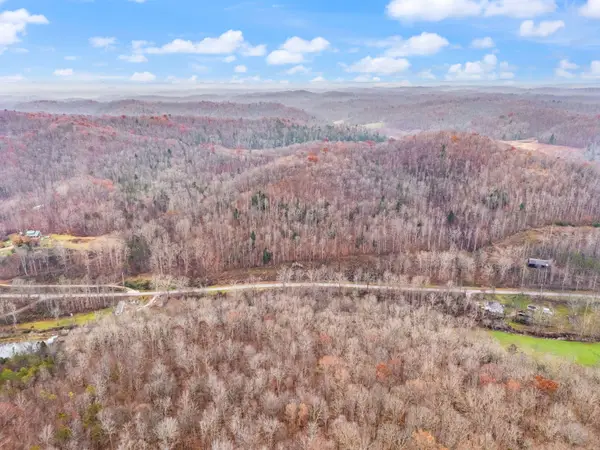 $89,000Active68 Acres
68 Acre Hwy. 1709, Tyner, KY 40486
MLS# 25506551Listed by: RE/MAX LAKETIME REALTY LONDON $205,000Pending3 beds 2 baths1,280 sq. ft.
7972 W Ky-30, Tyner, KY 40486
MLS# 25505131Listed by: SESTER & CO REALTY $329,000Active3 beds 2 baths1,600 sq. ft.
1052 Maulden Branch Road, Tyner, KY 40486
MLS# 25505061Listed by: RE/MAX LAKETIME REALTY LONDON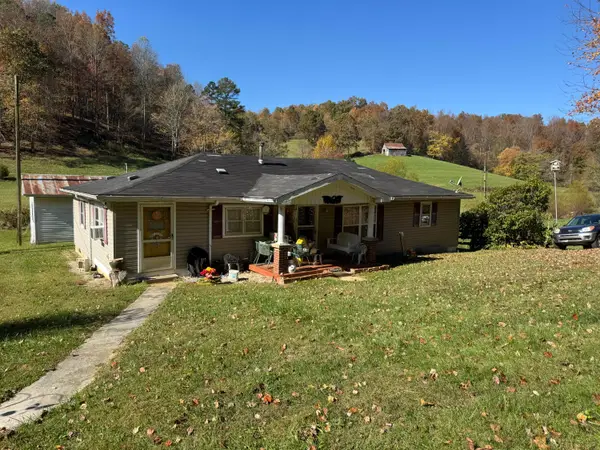 $329,000Pending3 beds 2 baths1,600 sq. ft.
1052 Maulden Branch Road, Tyner, KY 40486
MLS# 25504641Listed by: RE/MAX LAKETIME REALTY LONDON $49,900Active3 beds 1 baths986 sq. ft.
232 Crank Road #1, Tyner, KY 40486
MLS# 25504589Listed by: FIND KY HOMES REALTY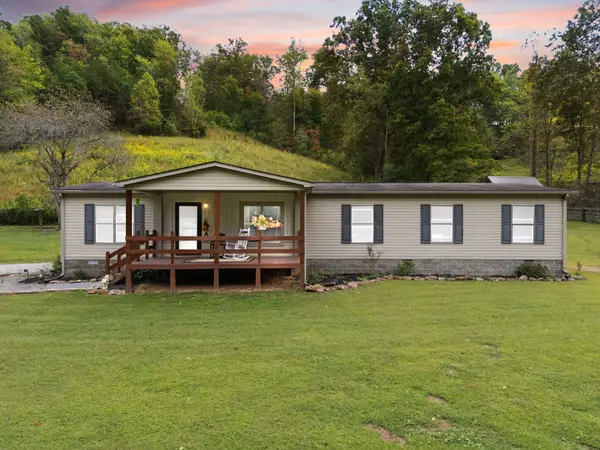 $224,900Pending4 beds 2 baths1,800 sq. ft.
22 Gregory Road, Tyner, KY 40486
MLS# 25501558Listed by: RE/MAX LAKETIME REALTY LONDON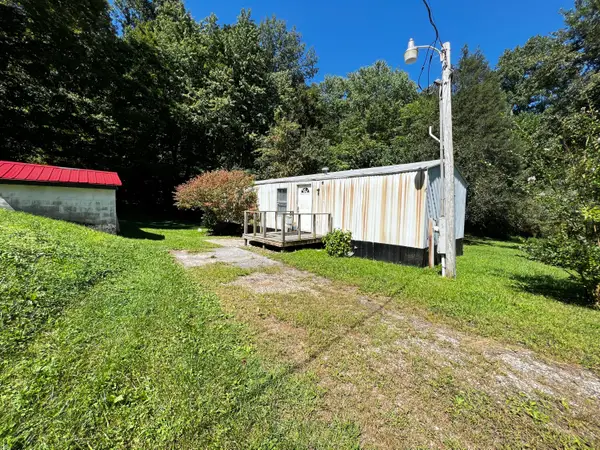 $35,000Pending2 beds 1 baths700 sq. ft.
916 Hwy 30 E., Tyner, KY 40486
MLS# 23018251Listed by: KELLER WILLIAMS LEGACY GROUP - LONDON $589,900Active2 beds 2 baths1,770 sq. ft.
13102 Us Highway 421 South, Tyner, KY 40486
MLS# 25015602Listed by: SALLIE DAVIDSON, REALTORS
Local realty services provided by:CENTURY 21 Pinnacle
Popular searches near 40486
Popular neighborhoods near 40486
- Autumn Ridge, Lexington homes for sale
- Belleau Wood, Lexington homes for sale
- Clays Ferry, Lexington homes for sale
- Creekside at Andover, Lexington homes for sale
- Cumberland Hill, Lexington homes for sale
- District 7, Lexington homes for sale
- District 8, Lexington homes for sale
- Dove Creek, Lexington homes for sale
- East Lake, Lexington homes for sale
- Ellerslie at Delong, Lexington homes for sale
- Gainesway, Lexington homes for sale
- Gleneagles, Lexington homes for sale
- Hunting Hills, Lexington homes for sale
- Lansdowne Merrick, Lexington homes for sale
- Liberty Area, Lexington homes for sale
- Meadow Creek, Lexington homes for sale
- Pinnacle, Lexington homes for sale
- River Park, Lexington homes for sale
- Southeastern Hills, Lexington homes for sale
- Waterford, Lexington homes for sale
Counties near Tyner, 40486
- Bell County homes for sale
- Breathitt County homes for sale
- Clay County homes for sale
- Estill County homes for sale
- Garrard County homes for sale
- Jackson County homes for sale
- Knox County homes for sale
- Laurel County homes for sale
- Lee County homes for sale
- Leslie County homes for sale
- Lincoln County homes for sale
- Madison County homes for sale
- Menifee County homes for sale
- Owsley County homes for sale
- Perry County homes for sale
- Powell County homes for sale
- Pulaski County homes for sale
- Rockcastle County homes for sale
- Whitley County homes for sale
- Wolfe County homes for sale
Protect your home and budget from life's surprises with an Assurant Home Warranty, backed by a partner that supports you through every step of homeownership. Explore Plans.
©2026 Century 21 Real Estate LLC. All rights reserved. CENTURY 21®, the CENTURY 21 Logo and C21® are service marks owned by Century 21 Real Estate LLC. Century 21 Real Estate LLC fully supports the principles of the Fair Housing Act and the Equal Opportunity Act. Each office is independently owned and operated. Listing information is deemed reliable but not guaranteed accurate.