- Brillion properties for sale
- Chilton properties for sale
- Cleveland properties for sale
- Elkhart Lake properties for sale
- Francis Creek properties for sale
- Glenbeulah properties for sale
- Hilbert properties for sale
- Howards Grove properties for sale
- Kiel properties for sale
- Kiel properties for sale
- Kossuth properties for sale
- Manitowoc properties for sale
- Meeme properties for sale
- Mosel properties for sale
- New Holstein properties for sale
- Reedsville properties for sale
- Rhine properties for sale
- Schleswig properties for sale
- Whitelaw properties for sale
- Woodville properties for sale
54245, WI - homes for sale
4 of 4 results displayed
- New
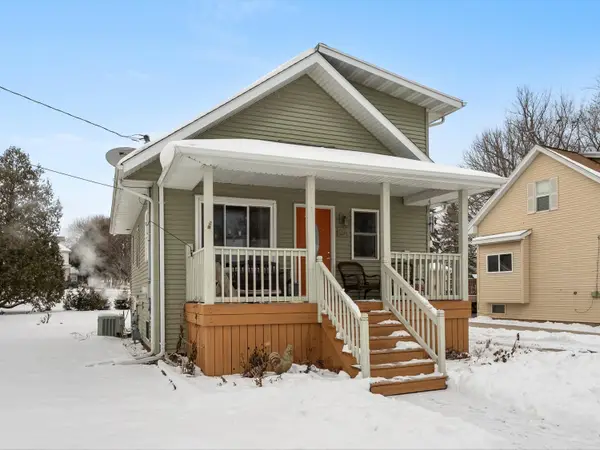 $185,000Active2 beds 2 baths990 sq. ft.
154 Mckinley St, Valders, WI 54245
MLS# 1944835Listed by: KELLER WILLIAMS - MANITOWOC  $399,000Pending4 beds 3 baths3,268 sq. ft.
415 S Adams St, Valders, WI 54245
MLS# 1941403Listed by: KELLER WILLIAMS - MANITOWOC $635,000Pending5 beds 4 baths4,094 sq. ft.
14025 Autumn Ridge Dr, Liberty, WI 54245
MLS# 1941049Listed by: KELLER WILLIAMS - MANITOWOC $339,900Pending4 beds 3 baths1,624 sq. ft.
354 Roosevelt St, Valders, WI 54245
MLS# 1927314Listed by: ACTION REALTY
Local realty services provided by:CENTURY 21 Aspire Group
The information being provided by Wisconsin Real Estate Exchange is for the consumer’s personal, non-commercial use and may not be used for any purpose other than to identify prospective properties consumers may be interested in purchasing. Information is supplied by seller and other third parties and has not been verified. 2025 Wisconsin Real Estate Exchange All rights reserved.
Popular searches near 54245
Popular neighborhoods near 54245
- Astor East River, Green Bay properties for sale
- Congress Field, Oshkosh properties for sale
- Downtown, Appleton properties for sale
- Erb Park, Appleton properties for sale
- Historic Central Neighborhood, Appleton properties for sale
- Historic Fourth Ward, Oshkosh properties for sale
- Huntley Houses, Appleton properties for sale
- Lumber River, Oshkosh properties for sale
- McAuliffe Park, Green Bay properties for sale
- Menominee South, Oshkosh properties for sale
- Midtown, Oshkosh properties for sale
- Oak Grove, Green Bay properties for sale
- River East, Oshkosh properties for sale
- Sacred Heart, Oshkosh properties for sale
- St. Bernadette Parish, Appleton properties for sale
- Sawyer, Oshkosh properties for sale
- Starlite, Green Bay properties for sale
- Stevens Park, Oshkosh properties for sale
- West Appleton, Appleton properties for sale
- Wilder Park, Green Bay properties for sale
Counties near Valders, 54245
- Brown County properties for sale
- Calumet County properties for sale
- Dodge County properties for sale
- Fond du Lac County properties for sale
- Green Lake County properties for sale
- Kewaunee County properties for sale
- Manitowoc County properties for sale
- Mason County properties for sale
- Milwaukee County properties for sale
- Oceana County properties for sale
- Oconto County properties for sale
- Outagamie County properties for sale
- Ozaukee County properties for sale
- Shawano County properties for sale
- Sheboygan County properties for sale
- Washington County properties for sale
- Waukesha County properties for sale
- Waupaca County properties for sale
- Waushara County properties for sale
- Winnebago County properties for sale
©2025 Century 21 Real Estate LLC. All rights reserved. CENTURY 21®, the CENTURY 21 Logo and C21® are service marks owned by Century 21 Real Estate LLC. Century 21 Real Estate LLC fully supports the principles of the Fair Housing Act and the Equal Opportunity Act. Each office is independently owned and operated. Listing information is deemed reliable but not guaranteed accurate.
©2025 Century 21 Real Estate LLC. All rights reserved. CENTURY 21®, the CENTURY 21 Logo and C21® are service marks owned by Century 21 Real Estate LLC. Century 21 Real Estate LLC fully supports the principles of the Fair Housing Act and the Equal Opportunity Act. Each office is independently owned and operated. Listing information is deemed reliable but not guaranteed accurate.