- Brodnax homes for sale
- Emporia homes for sale
- Freeman homes for sale
- Gaston Township homes for sale
- Gaston homes for sale
- Henrico homes for sale
- Lawrenceville homes for sale
- Littleton homes for sale
- Littleton Township homes for sale
- Meherrin homes for sale
- Powellton homes for sale
- River homes for sale
- Roanoke homes for sale
- Roanoke Rapids township homes for sale
- Roanoke Rapids homes for sale
- Sixpound homes for sale
- Skippers homes for sale
- South Rosemary homes for sale
- Totaro homes for sale
- Weldon Township homes for sale
23887, VA - homes for sale
2 of 2 results displayed
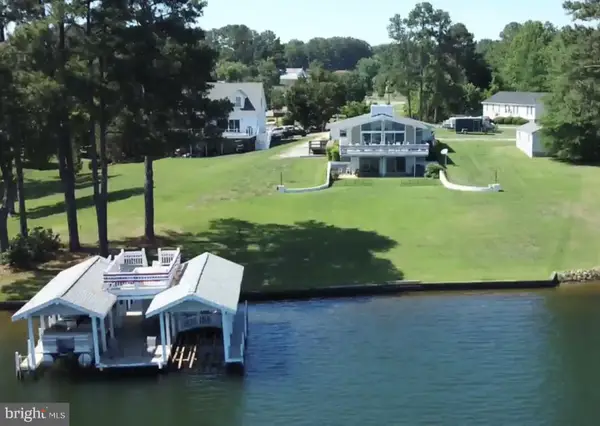 $1,100,000Active4 beds 3 baths2,000 sq. ft.
224 Kelly Drive, VALENTINES, VA 23887
MLS# VABW2000120Listed by: JIM BARB REALTY, INC. $136,000Pending46 Acres
Christanna Highway, Valentines, VA 23887
MLS# 59370Listed by: LANDVEST, INC.
Local realty services provided by:CENTURY 21 Dale Realty Co., CENTURY 21 Realty @ Home
Popular searches near 23887
Popular neighborhoods near 23887
- Bedford At Falls River, Raleigh homes for sale
- Breezewood, Raleigh homes for sale
- Brookbury, Richmond homes for sale
- Brookside Manor, Wilson homes for sale
- Cavalier Terrace, Wilson homes for sale
- Dewfield, Wilson homes for sale
- Elvie Street, Wilson homes for sale
- Five Points, Wilson homes for sale
- Fords Colony, Rocky Mount homes for sale
- Forest Hills, Wilson homes for sale
- Heritage, Wake Forest homes for sale
- Highland Creek, Raleigh homes for sale
- Jetstream Park, Wilson homes for sale
- Lake Royale, Louisburg homes for sale
- Northgreen Village, Rocky Mount homes for sale
- Old Wilson, Wilson homes for sale
- Wakefield Plantation, Raleigh homes for sale
- Washington Carver Heights, Wilson homes for sale
- Westwood, Wilson homes for sale
- Wilson Country Club, Wilson homes for sale
Counties near Valentines, 23887
- Brunswick County homes for sale
- Dinwiddie County homes for sale
- Edgecombe County homes for sale
- Emporia city County homes for sale
- Franklin County homes for sale
- Franklin city County homes for sale
- Greensville County homes for sale
- Halifax County homes for sale
- Hertford County homes for sale
- Lunenburg County homes for sale
- Mecklenburg County homes for sale
- Nash County homes for sale
- Northampton County homes for sale
- Nottoway County homes for sale
- Petersburg city County homes for sale
- Prince George County homes for sale
- Southampton County homes for sale
- Sussex County homes for sale
- Vance County homes for sale
- Warren County homes for sale
Protect your home and budget from life's surprises with an Assurant Home Warranty, backed by a partner that supports you through every step of homeownership. Explore Plans.
©2026 Century 21 Real Estate LLC. All rights reserved. CENTURY 21®, the CENTURY 21 Logo and C21® are service marks owned by Century 21 Real Estate LLC. Century 21 Real Estate LLC fully supports the principles of the Fair Housing Act and the Equal Opportunity Act. Each office is independently owned and operated. Listing information is deemed reliable but not guaranteed accurate.