- Burns homes for sale
- Chapmansboro homes for sale
- Charlotte homes for sale
- Clarksville homes for sale
- Cumberland City homes for sale
- Cumberland City homes for sale
- Cumberland Furnace homes for sale
- Cunningham homes for sale
- Dickson homes for sale
- Erin homes for sale
- Indian Mound homes for sale
- McEwen homes for sale
- Palmyra homes for sale
- Slayden homes for sale
- Southside homes for sale
- Tennessee Ridge homes for sale
- Vanleer homes for sale
- Waverly homes for sale
- White Bluff homes for sale
- Woodlawn homes for sale
37181, TN - homes for sale
19 of 19 results displayed
- New
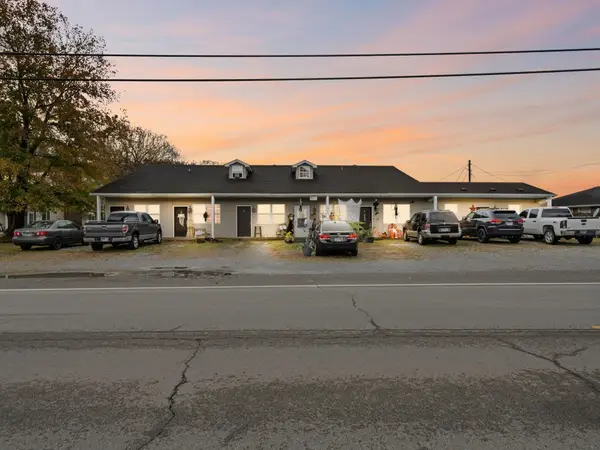 $1,225,000Active-- beds -- baths6,400 sq. ft.
4819 Highway 49 W, Vanleer, TN 37181
MLS# 3156068Listed by: THE REALTY ASSOCIATION - Coming Soon
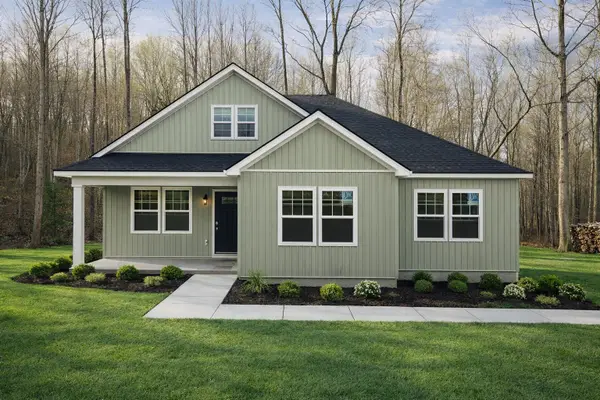 $419,900Coming Soon3 beds 2 baths
1863 Adams Rd, Charlotte, TN 37036
MLS# 3155536Listed by: ZACH TAYLOR REAL ESTATE 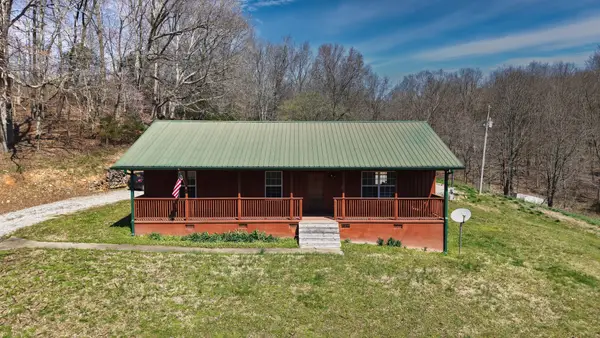 $349,900Active3 beds 2 baths1,356 sq. ft.
2300 Bear Creek Rd, Vanleer, TN 37181
MLS# 3155586Listed by: CHRIS DOTSON & ASSOCIATES- Coming Soon
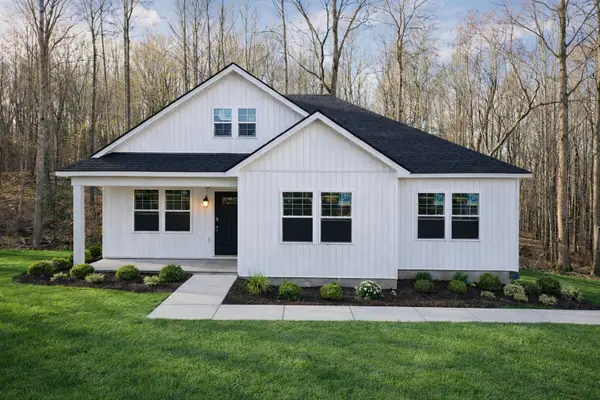 $419,900Coming Soon3 beds 2 baths
1855 Adams Rd, Charlotte, TN 37036
MLS# 3153100Listed by: ZACH TAYLOR REAL ESTATE  $540,000Active4 beds 2 baths1,876 sq. ft.
1147 Tonya Trl, Cumberland Furnace, TN 37051
MLS# 3149456Listed by: AVENUE REALTY GROUP $390,000Active3 beds 3 baths2,016 sq. ft.
5005 Highway 49 W, Vanleer, TN 37181
MLS# 3137400Listed by: LEGION REALTY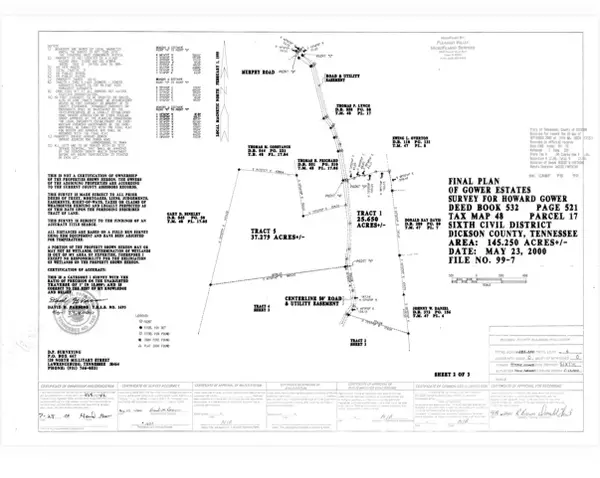 $450,000Active37.28 Acres
0 Tonya Trail, Cumberland Furnace, TN 37051
MLS# 3123755Listed by: TN REALTY COLLECTIVE $289,900Active3 beds 2 baths1,512 sq. ft.
664 Old Dry Hollow Rd, Vanleer, TN 37181
MLS# 3135131Listed by: CHRIS DOTSON & ASSOCIATES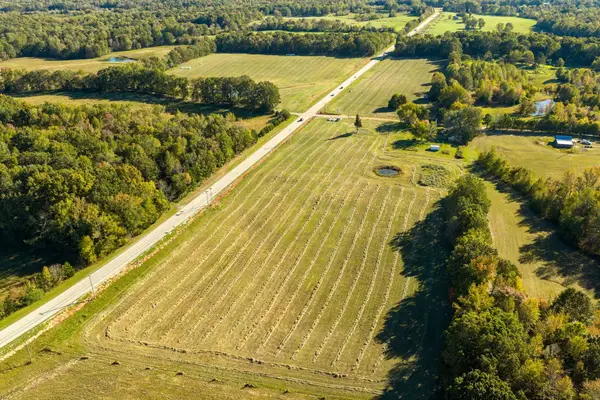 $345,000Active8.69 Acres
0 Sylvia Rd, Dickson, TN 37055
MLS# 3098487Listed by: PARKER PEERY PROPERTIES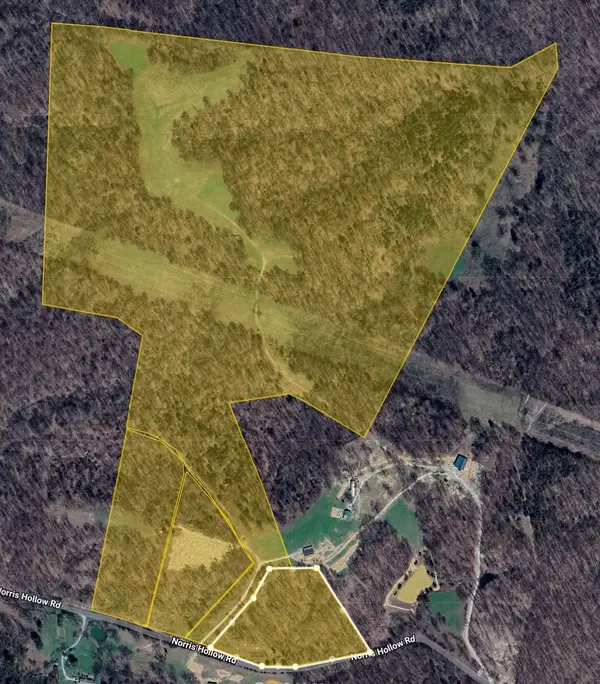 $1,250,000Active-- beds -- baths
900 Norris Hollow Rd, Vanleer, TN 37181
MLS# 3097466Listed by: BLUE DOOR REALTY GROUP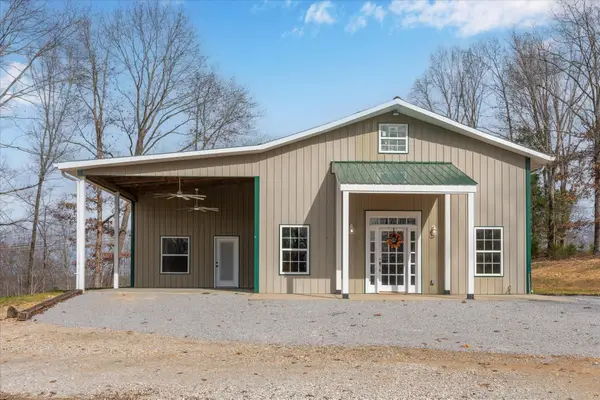 $517,000Active3 beds 2 baths2,100 sq. ft.
776 Norris Hollow Rd, Vanleer, TN 37181
MLS# 3061778Listed by: BENCHMARK REALTY, LLC $749,000Active3 beds 3 baths2,160 sq. ft.
1910 Cedar Creek Rd, Vanleer, TN 37181
MLS# 3111203Listed by: CRYE-LEIKE, INC., REALTORS $463,000Active3 beds 2 baths2,204 sq. ft.
1030 Upper Creek Rd, Vanleer, TN 37181
MLS# 2996721Listed by: BE HOME REALTY, LLC $874,900Active-- beds 1 baths
1150 Bell Hollow Rd, Vanleer, TN 37181
MLS# 2965160Listed by: THE BAKER BROKERAGE $160,000Active11.7 Acres
0 Upper Creek Rd, Vanleer, TN 37181
MLS# 2973380Listed by: THE BAKER BROKERAGE $633,000Active-- beds -- baths
3 Highway 49, Erin, TN 37061
MLS# 2888497Listed by: E4 REAL ESTATE GROUP, LLC $2,950,000Active-- beds -- baths
0 Highway 49, Erin, TN 37061
MLS# 2888432Listed by: E4 REAL ESTATE GROUP, LLC $709,900Active5 beds 4 baths4,044 sq. ft.
4122 Highway 49 West, Vanleer, TN 37181
MLS# 3139920Listed by: CHARLES WOODARD & ASSOCIATES $325,000Active-- beds -- baths
2 Yellow Creek Road, Vanleer, TN 37181
MLS# 2616062Listed by: KELLER WILLIAMS REALTY
Local realty services provided by:CENTURY 21 Premier
Popular searches near 37181
Popular neighborhoods near 37181
- Apple Hollow, Clarksville homes for sale
- Centerstone Village, Clarksville homes for sale
- Cumberland Hills, Clarksville homes for sale
- Ellington Chase, Clarksville homes for sale
- Glen Ellen Landing, Clarksville homes for sale
- Greenland Farms, Clarksville homes for sale
- Holly Point, Clarksville homes for sale
- North Park, Clarksville homes for sale
- Peachtree, Clarksville homes for sale
- Poplar Hill, Clarksville homes for sale
- Queen's Bluff, Clarksville homes for sale
- Rudolphtown, Clarksville homes for sale
- Sango Crossing, Clarksville homes for sale
- Somerset, Clarksville homes for sale
- South Ridge, Clarksville homes for sale
- Sugar Tree, Clarksville homes for sale
- The Villages, Clarksville homes for sale
- Treefield Woods, Clarksville homes for sale
- Virginia Hills, Clarksville homes for sale
- Wildwood West, Clarksville homes for sale
Counties near Vanleer, 37181
- Benton County homes for sale
- Calloway County homes for sale
- Cheatham County homes for sale
- Christian County homes for sale
- Davidson County homes for sale
- Dickson County homes for sale
- Henry County homes for sale
- Hickman County homes for sale
- Houston County homes for sale
- Humphreys County homes for sale
- Lewis County homes for sale
- Logan County homes for sale
- Maury County homes for sale
- Montgomery County homes for sale
- Perry County homes for sale
- Robertson County homes for sale
- Stewart County homes for sale
- Todd County homes for sale
- Trigg County homes for sale
- Williamson County homes for sale
Protect your home and budget from life's surprises with an Assurant Home Warranty, backed by a partner that supports you through every step of homeownership. Explore Plans.
©2026 Century 21 Real Estate LLC. All rights reserved. CENTURY 21®, the CENTURY 21 Logo and C21® are service marks owned by Century 21 Real Estate LLC. Century 21 Real Estate LLC fully supports the principles of the Fair Housing Act and the Equal Opportunity Act. Each office is independently owned and operated. Listing information is deemed reliable but not guaranteed accurate.