- Bellmont properties for sale
- Black Brook properties for sale
- Bloomingdale properties for sale
- Brighton properties for sale
- Duane properties for sale
- Franklin properties for sale
- Lake Clear properties for sale
- Loon Lake properties for sale
- Lyon Mountain properties for sale
- Merrill properties for sale
- Owls Head properties for sale
- Rainbow Lake properties for sale
- Redford properties for sale
- St Armand properties for sale
- Santa Clara properties for sale
- Saranac properties for sale
- Saranac Lake properties for sale
- Vermontville properties for sale
- Wilmington properties for sale
- Wilmington town properties for sale
12989, NY - homes for sale
28 of 28 results displayed
 $125,000Pending50.68 Acres
Lot 7 Daigneau Trail, Merrillsville, NY 12989
MLS# 206230Listed by: SANDY HAYES REALTY $485,000Pending3 beds 2 baths2,121 sq. ft.
66 Bass Lake Road, Loon Lake, NY 12989
MLS# 206110Listed by: ENGEL & VOLKERS LAKE PLACID REAL ESTATE $249,000Active2 beds 1 baths2,218 sq. ft.
1189 Fletcher Farm Road, Bloomingdale, NY 12913
MLS# 205982Listed by: RE/MAX NORTH COUNTRY $175,000Pending125 Acres
Lot 25 County Route 60, Merrillsville, NY 12989
MLS# 205972Listed by: SANDY HAYES REALTY $89,000Active2.1 Acres
25 Jaelyn Way, Vermontville, NY 12989
MLS# 205817Listed by: SAY REAL ESTATE $289,000Pending2 beds 1 baths1,920 sq. ft.
39 Oak Lane, Loon Lake, NY 12989
MLS# 205471Listed by: ENGEL & VOLKERS LAKE PLACID REAL ESTATE $198,000Active175 Acres
TBD Rock Street, Vermontville, NY 12989
MLS# 205397Listed by: LANDVEST, INC. $211,000Active59.3 Acres
954 Fletcher Farm Road, Vermontville, NY 12989
MLS# 204988Listed by: ENGEL & VOLKERS LAKE PLACID REAL ESTATE $225,000Active2 beds 1 baths792 sq. ft.
2837 County Rt 26, Vermontville, NY 12989
MLS# 204898Listed by: SAY REAL ESTATE $169,000Active1 beds 1 baths626 sq. ft.
3-7 Electric Avenue, Loon Lake, NY 12989
MLS# 204758Listed by: SAY REAL ESTATE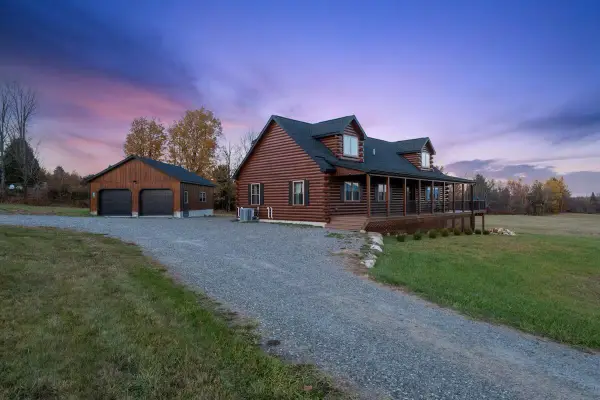 $1,095,000Pending5 beds 3 baths4,584 sq. ft.
80 Norman Ridge Road, Vermontville, NY 12989
MLS# 204719Listed by: BOB MILLER REAL ESTATE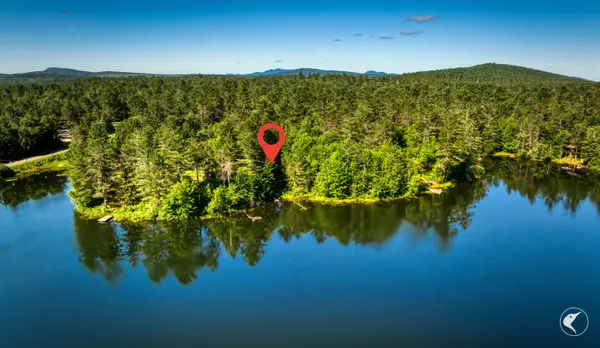 $299,900Active1 beds 1 baths640 sq. ft.
6 Kushaqua Mud Pond Rd Road, Onchiota, NY 12989
MLS# 204641Listed by: MERRILL L. THOMAS, INC.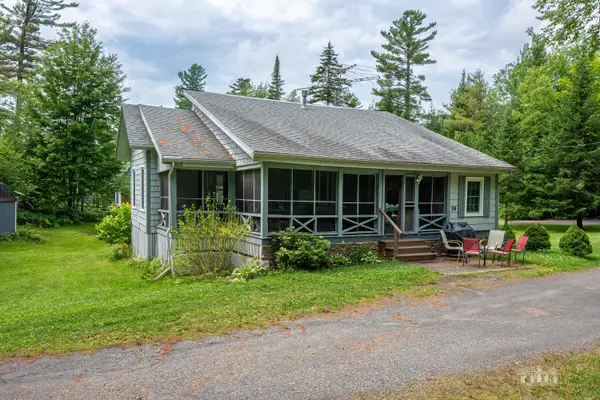 $299,000Pending3 beds 2 baths2,025 sq. ft.
39 Loon Lake Terrace Terrace, Vermontville, NY 12989
MLS# 204439Listed by: ENGEL & VOLKERS LAKE PLACID REAL ESTATE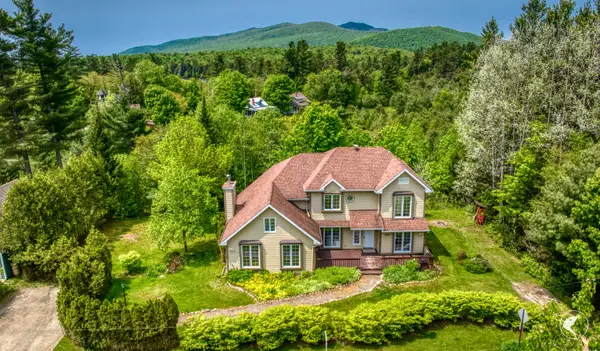 $559,000Active7 beds 4 baths3,622 sq. ft.
3368 County Route 26, Loon Lake, NY 12989
MLS# 204079Listed by: MERRILL L. THOMAS, INC.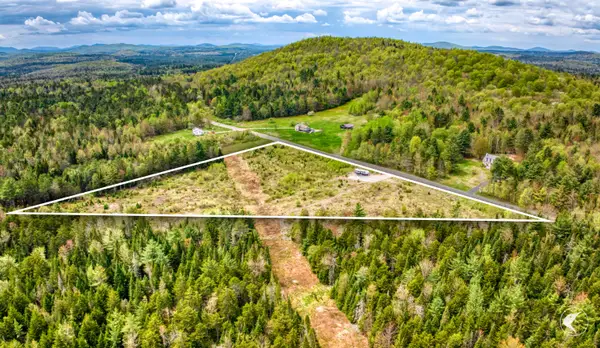 $174,000Active6.97 Acres
00 Fletcher Farm Road, Vermontville, NY 12989
MLS# 205665Listed by: ADIRONDACK PREMIER PROPERTIES BERKSHIRE HATHAWAY HOMESERVICE $489,900Active3.61 Acres
0 Eskerview Road, Saranac Lake, NY 12983
MLS# 203818Listed by: ADIRONDACK PREMIER PROPERTIES BERKSHIRE HATHAWAY HOMESERVICE $99,000Active8.6 Acres
55 Jaelyn Way, Vermontville, NY 12989
MLS# 203753Listed by: SAY REAL ESTATE $79,000Pending8.6 Acres
38 Jaelyn Way, Vermontville, NY 12989
MLS# 203756Listed by: SAY REAL ESTATE $69,000Pending6.7 Acres
28 Jaelyn Way, Vermontville, NY 12989
MLS# 203757Listed by: SAY REAL ESTATE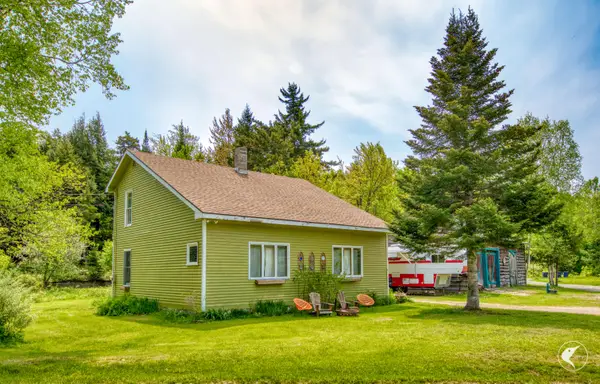 $349,500Active3 beds 2 baths1,472 sq. ft.
1 Oak Lane, Loon Lake, NY 12989
MLS# 203749Listed by: MERRILL L. THOMAS, INC.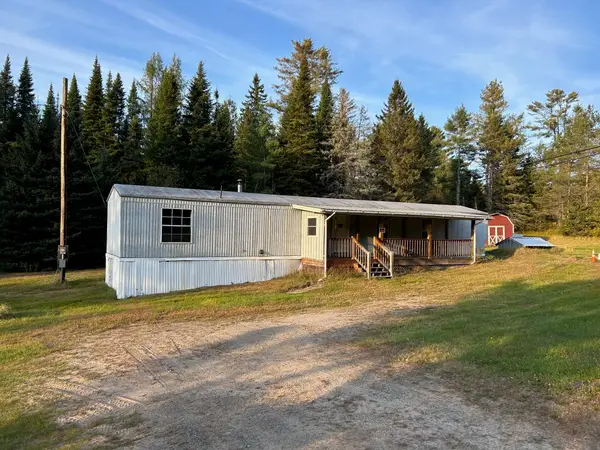 $65,000Pending3 beds 1 baths540 sq. ft.
231 Muzzy Road, Vermontville, NY 12989
MLS# 203195Listed by: MOUNTAIN RUN REALTY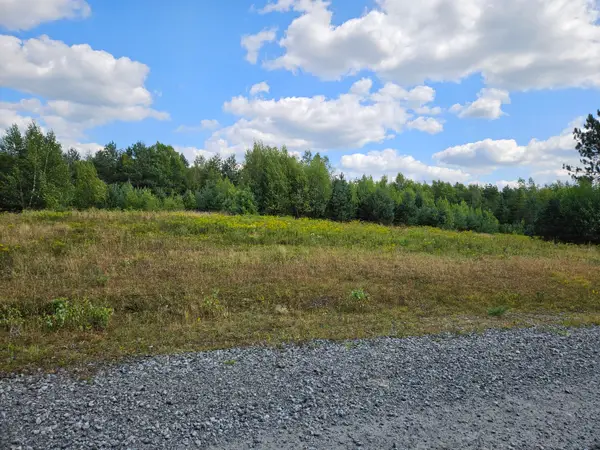 $50,000Active7.57 Acres
Lot 18 Daigneau Trail, Merrillsville, NY 12989
MLS# 203059Listed by: SANDY HAYES REALTY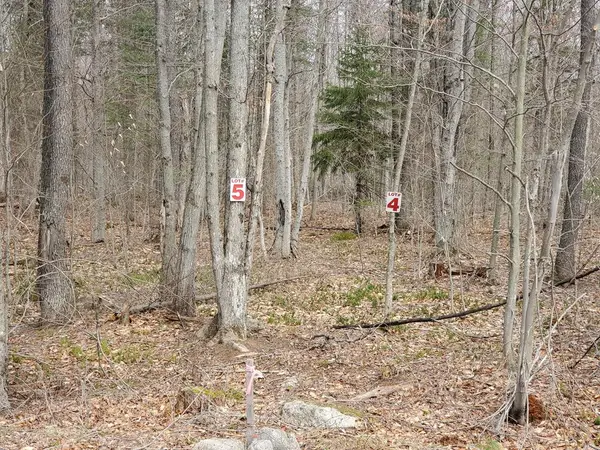 $95,000Active33.07 Acres
Lot 5 Daigneau Trail, Merrillsville, NY 12989
MLS# 131474Listed by: SANDY HAYES REALTY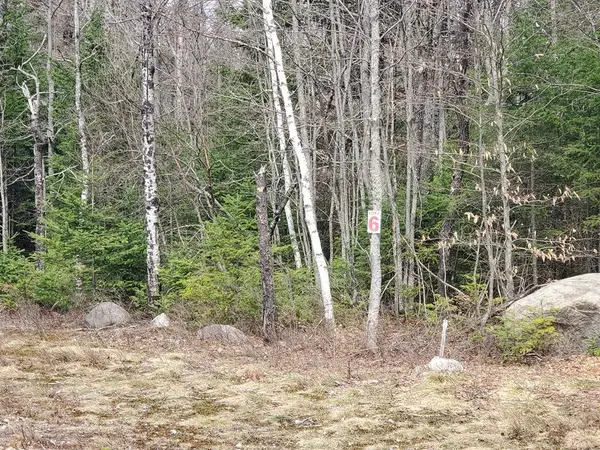 $90,000Active31.16 Acres
Lot 6 Daigneau Trail, Merrillsville, NY 12989
MLS# 131475Listed by: SANDY HAYES REALTY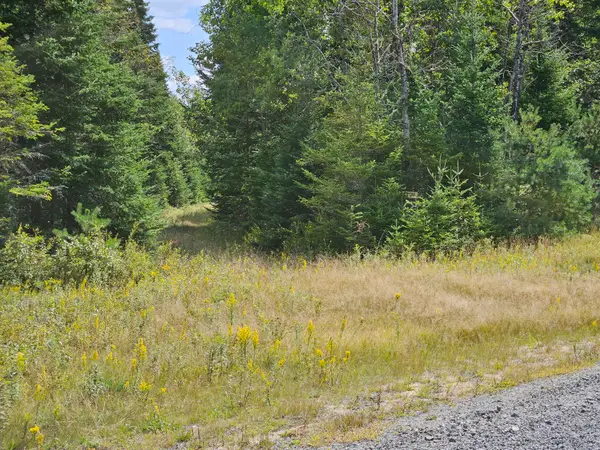 $50,000Active8.16 Acres
Lot 17 Daugneau Trail, Merrillsville, NY 12989
MLS# 203058Listed by: SANDY HAYES REALTY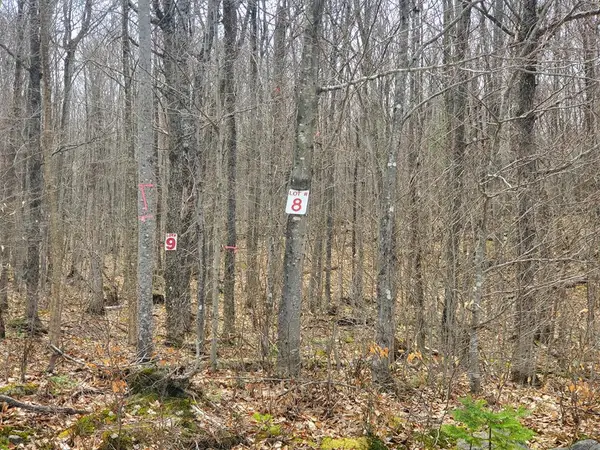 $175,000Pending69.6 Acres
Lot 8 Daigneau Trail, Merrillsville, NY 12989
MLS# 178507Listed by: SANDY HAYES REALTY $60,000Active5.86 Acres
Lot 2 Route 26, Loon Lake, NY 12989
MLS# 175536Listed by: ADIRONDACK PREMIER PROPERTIES BERKSHIRE HATHAWAY HOMESERVICE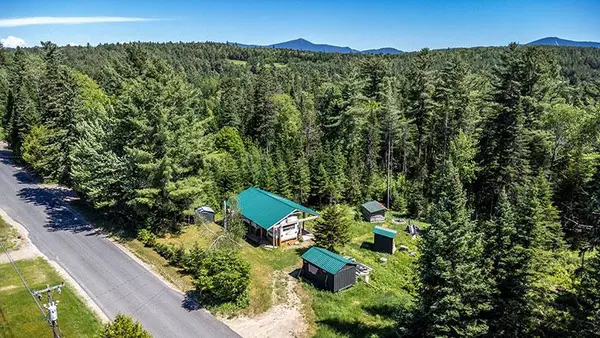 $98,000Active1 Acres
384 Swinyer, Vermontville, NY 12989
MLS# 176407Listed by: ADIRONDACK PREMIER PROPERTIES BERKSHIRE HATHAWAY HOMESERVICE
Local realty services provided by:CENTURY 21 TheOne
Popular searches near 12989
Popular neighborhoods near 12989
- Arrowhead Lake, Milton properties for sale
- Catamount, Milton properties for sale
- Central Burlington, Burlington properties for sale
- Downtown Burlington, Burlington properties for sale
- Lamoille, Milton properties for sale
- Milton Village Center, Milton properties for sale
- New North End, Burlington properties for sale
- Old North End, Burlington properties for sale
- Riverside, Burlington properties for sale
- Shelburne Center, Shelburne properties for sale
- South End, Burlington properties for sale
- Town Core, Milton properties for sale
- UVM, Burlington properties for sale
- West Milton, Milton properties for sale
Counties near Vermontville, 12989
- Addison County properties for sale
- Caledonia County properties for sale
- Chittenden County properties for sale
- Clinton County properties for sale
- Essex County properties for sale
- Franklin County properties for sale
- Franklin County properties for sale
- Fulton County properties for sale
- Grand Isle County properties for sale
- Hamilton County properties for sale
- Herkimer County properties for sale
- Lamoille County properties for sale
- Lewis County properties for sale
- Orange County properties for sale
- Orleans County properties for sale
- Rutland County properties for sale
- St. Lawrence County properties for sale
- Warren County properties for sale
- Washington County properties for sale
- Washington County properties for sale
©2025 Century 21 Real Estate LLC. All rights reserved. CENTURY 21®, the CENTURY 21 Logo and C21® are service marks owned by Century 21 Real Estate LLC. Century 21 Real Estate LLC fully supports the principles of the Fair Housing Act and the Equal Opportunity Act. Each office is independently owned and operated. Listing information is deemed reliable but not guaranteed accurate.
©2025 Century 21 Real Estate LLC. All rights reserved. CENTURY 21®, the CENTURY 21 Logo and C21® are service marks owned by Century 21 Real Estate LLC. Century 21 Real Estate LLC fully supports the principles of the Fair Housing Act and the Equal Opportunity Act. Each office is independently owned and operated. Listing information is deemed reliable but not guaranteed accurate.