- Alta Heights, Napa homes for sale
- Bel Aire, Napa homes for sale
- Browns Valley, Napa homes for sale
- Browns Valley Central, Napa homes for sale
- Browns Valley East, Napa homes for sale
- Browns Valley South, Napa homes for sale
- Browns Valley West, Napa homes for sale
- Central Napa, Napa homes for sale
- Downtown Napa, Napa homes for sale
- Fuller Park, Napa homes for sale
- Linda Vista, Napa homes for sale
- Napa Abajo, Napa homes for sale
- Pueblo Park, Napa homes for sale
- Shevland Ranch, Napa homes for sale
- Silverado Country Club, Napa homes for sale
- Springwood Estates, Napa homes for sale
- Terrace, Napa homes for sale
- Vineyard Estates, Napa homes for sale
- Von Uhlit Ranch, Napa homes for sale
- Westwood, Napa homes for sale
Vintage, Napa, CA - homes for sale
29 of 29 results displayed
- New
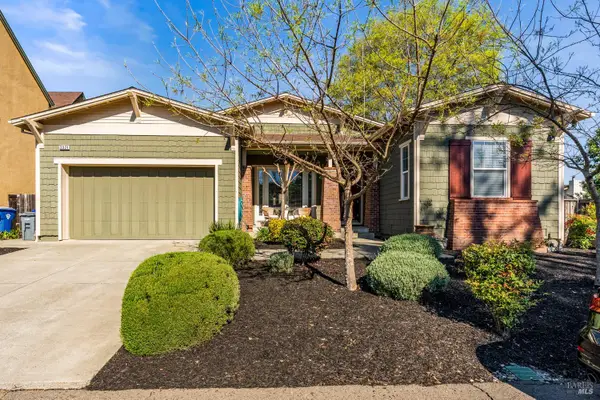
 $1,949,000Active4 beds 3 baths2,647 sq. ft.
215 Pheasant Court, Napa, CA 94558
MLS# 326024367Listed by: COMPASS - New
 $1,175,000Active3 beds 2 baths2,485 sq. ft.
3924 Jefferson Street, Napa, CA 94558
MLS# 326024260Listed by: VINTAGE SOTHEBY'S INTERNATIONAL REALTY - New
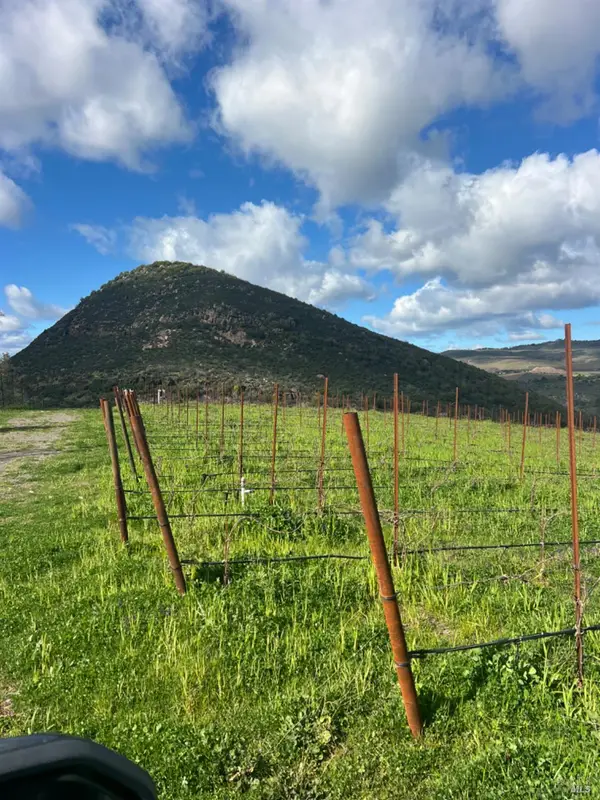 $5,500,000Active61.83 Acres
0 Soda Canyon Road, Napa, CA 94558
MLS# 326023675Listed by: JAMES KELLER, BROKER - New
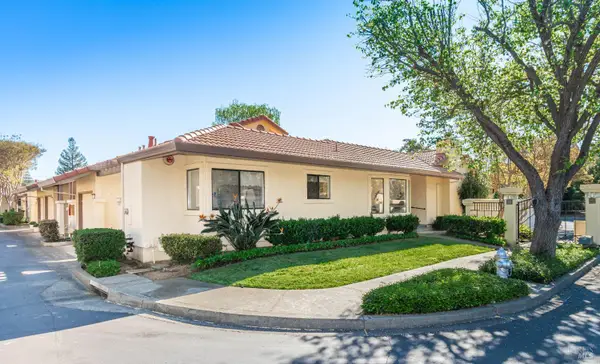 $696,000Active2 beds -- baths1,481 sq. ft.
80 Fountain Grove Circle, Napa, CA 94558
MLS# 326023787Listed by: CORCORAN ICON PROPERTIES - New
 $79,000Active0.23 Acres
0 Ridgecrest Drive, Napa, CA 94558
MLS# 326023229Listed by: RE/MAX GOLD 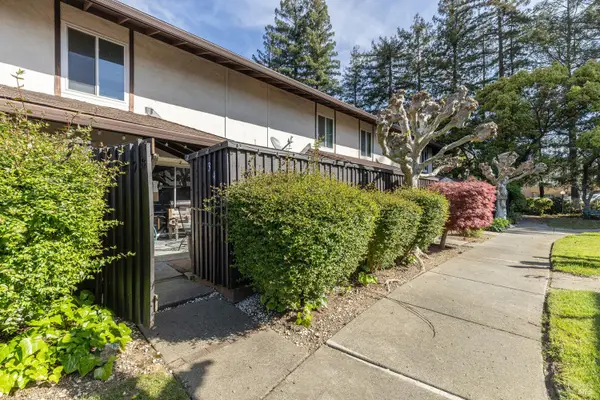 $399,000Active2 beds 2 baths958 sq. ft.
3478 Willis Drive, Napa, CA 94558
MLS# 326021049Listed by: RESERVE PROPERTIES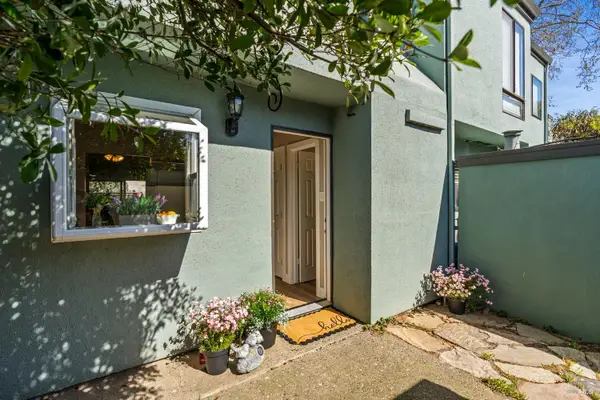 $495,000Active2 beds 2 baths970 sq. ft.
3482 Shelter Creek Drive, Napa, CA 94558
MLS# 326021009Listed by: VINTAGE SOTHEBY'S INTERNATIONAL REALTY $469,000Active2 beds 2 baths1,210 sq. ft.
3636 Shelter Creek Drive, Napa, CA 94558
MLS# 326018072Listed by: GOLDEN GATE SOTHEBY'S INTERNATIONAL REALTY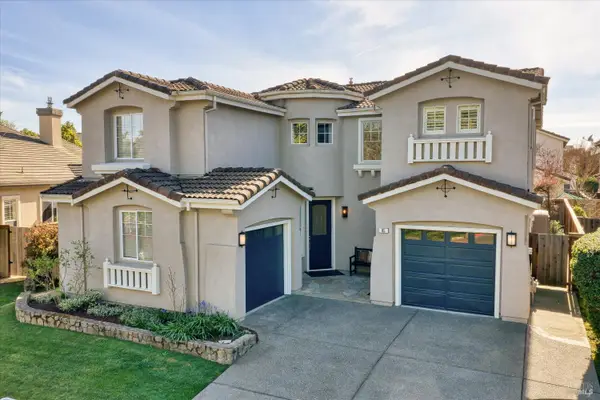 $1,125,000Active4 beds 4 baths2,820 sq. ft.
95 Summerbrooke Circle, Napa, CA 94558
MLS# 326017124Listed by: BERKSHIRE HATHAWAY $748,000Active3 beds 2 baths1,100 sq. ft.
3739 Parrett Avenue, Napa, CA 94558
MLS# 326017991Listed by: INTELLIGENT REALTY $575,000Active3 beds 2 baths1,350 sq. ft.
3552 Shelter Creek Drive, Napa, CA 94558
MLS# 326015168Listed by: L'AGENCE NAPA VALLEY $765,000Active2 beds 2 baths1,481 sq. ft.
69 Fountain Grove Circle, Napa, CA 94558
MLS# 326007431Listed by: MCALISTER REAL ESTATE INC. $1,149,000Active3 beds 3 baths1,983 sq. ft.
125 Valley Club Circle, Napa, CA 94558
MLS# 326015020Listed by: COLDWELL BANKER BROKERS OF THE VALLEY $599,000Active3 beds 2 baths1,218 sq. ft.
3429 Willis Drive, Napa, CA 94558
MLS# 326014529Listed by: COMPASS $1,070,000Active4 beds 4 baths2,820 sq. ft.
10 Summerbrooke Circle, Napa, CA 94558
MLS# 326010420Listed by: COMPASS $649,000Active3 beds 4 baths1,530 sq. ft.
113 Firefly Lane, Napa, CA 94558
MLS# 326002054Listed by: GOLDEN GATE SOTHEBY'S INTERNATIONAL REALTY $770,000Active2 beds 2 baths1,481 sq. ft.
77 Fountain Grove Circle, Napa, CA 94558
MLS# 326006145Listed by: COLDWELL BANKER BROKERS OF THE VALLEY $680,000Pending2 beds 2 baths1,470 sq. ft.
11 Fountain Grove Cir, Napa, CA 94558
MLS# 41122163Listed by: HOMESMART OPTIMA REALTY, INC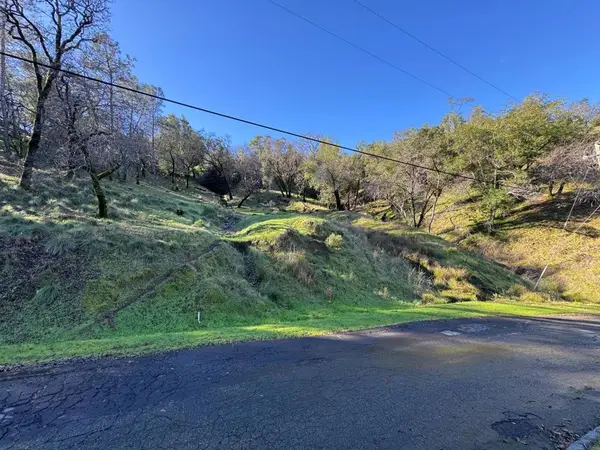 $27,500Active0.24 Acres
0 Redbud, Napa, CA 94558
MLS# ML82031087Listed by: RE/MAX GOLD REDWOOD SHORES. $910,000Active3 beds 3 baths1,660 sq. ft.
71 Valley Club Circle, Napa, CA 94558
MLS# 325101220Listed by: COMPASS $729,000Active3 beds 3 baths1,599 sq. ft.
36 Fountain Grove Circle, Napa, CA 94558
MLS# 325095235Listed by: NAPA RESIDENTIAL REALTY $525,000Active2 beds 2 baths1,081 sq. ft.
3476 Shelter Creek Drive, Napa, CA 94558
MLS# 325094386Listed by: BERKSHIRE HATHAWAY $650,000Pending3 beds 4 baths1,530 sq. ft.
111 Firefly Lane, Napa, CA 94558
MLS# 325091497Listed by: VANGUARD PROPERTIES $5,900,000Active12.5 Acres
0 Silverado Trail, Napa, CA 94558
MLS# 325079451Listed by: VINTAGE SOTHEBY'S INTERNATIONAL REALTY $500,000Active20 Acres
0 Mt Veeder Road, Napa, CA 94558
MLS# 325070403Listed by: COLDWELL BANKER BROKERS OF THE VALLEY $795,000Active3 beds 3 baths1,679 sq. ft.
39 Fountain Grove Circle, Napa, CA 94558
MLS# 325010705Listed by: NAPA RESIDENTIAL REALTY $1,099,000Active4 beds 3 baths2,414 sq. ft.
5 Blackberry Drive, Napa, CA 94558
MLS# 325083815Listed by: WINDERMERE NAPA VALLEY PROPERTIES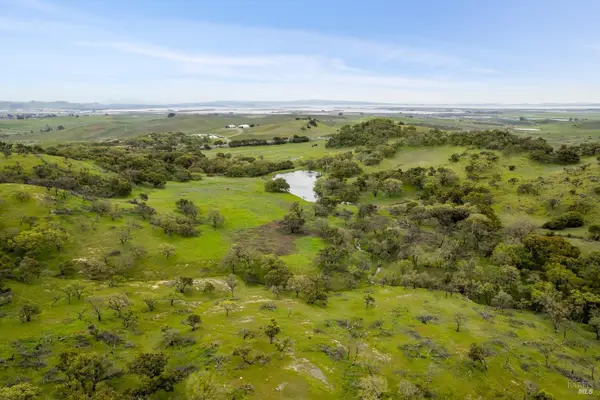 $5,500,000Active187 Acres
0 Highway 12, Napa, CA 94558
MLS# 326003254Listed by: SOTHEBY'S INTERNATIONAL REALTY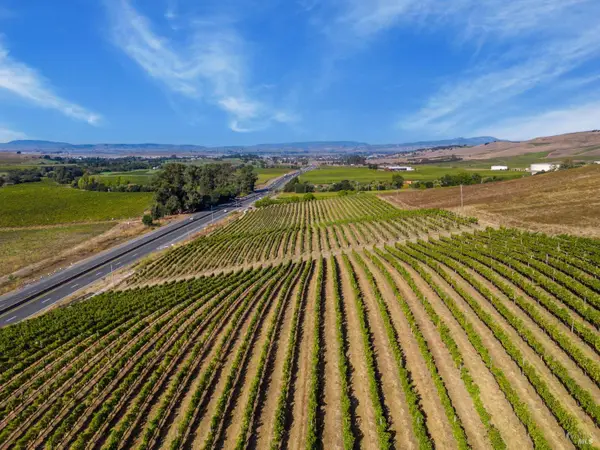 $1,350,000Active9.49 Acres
3800 Jameson Canyon Road, Napa, CA 94558
MLS# 325083956Listed by: MERGE REAL ESTATE
Local realty services provided by:CENTURY 21 Kobetz Realty, CENTURY 21 Sierra Properties, CENTURY 21 Fort Bragg Realty
The information being provided by Bay Area Real Estate Information Service is for the consumer's personal, non-commercial use and may not be used for any purpose other than to identify prospective properties consumer may be interested in purchasing. Any information relating to real estate for sale referenced on this web site comes from the Internet Data Exchange (IDX) program of the Bay Area Real Estate Information Service. CENTURY 21 Kobetz Realty is not a Multiple Listing Service (MLS), nor does it offer MLS access. This website is a service of CENTURY 21 Kobetz Realty, a broker participant of Bay Area Real Estate Information Service. This web site may reference real estate listing(s) held by a brokerage firm other than the broker and/or agent who owns this web site.
The accuracy of all information, regardless of source, including but not limited to open house information, square footages and lot sizes, is deemed reliable but not guaranteed and should be personally verified through personal inspection by and/or with the appropriate professionals. The data contained herein is copyrighted by Bay Area Real Estate Information Service and is protected by all applicable copyright laws. Any unauthorized dissemination of this information is in violation of copyright laws and is strictly prohibited.
Properties in listings may have been sold or may no longer be available.
Copyright 2026 Bay Area Real Estate Information Service. All rights reserved.
The information being provided by California Regional MLS (Southern California) is for the consumer's personal, non-commercial use and may not be used for any purpose other than to identify prospective properties consumer may be interested in purchasing. Any information relating to real estate for sale referenced on this web site comes from the Internet Data Exchange (IDX) program of the California Regional MLS (Southern California). CENTURY 21 Fort Bragg Realty is not a Multiple Listing Service (MLS), nor does it offer MLS access. This website is a service of CENTURY 21 Fort Bragg Realty, a broker participant of California Regional MLS (Southern California). This web site may reference real estate listing(s) held by a brokerage firm other than the broker and/or agent who owns this web site.
The accuracy of all information, regardless of source, including but not limited to open house information, square footages and lot sizes, is deemed reliable but not guaranteed and should be personally verified through personal inspection by and/or with the appropriate professionals. The data contained herein is copyrighted by California Regional MLS (Southern California) and is protected by all applicable copyright laws. Any unauthorized dissemination of this information is in violation of copyright laws and is strictly prohibited.
Copyright 2021 California Regional MLS (Southern California). All rights reserved.
Popular neighborhoods near Vintage, Napa, CA
Zip codes near Vintage, Napa, CA
- 94503 homes for sale
- 94508 homes for sale
- 94510 homes for sale
- 94533 homes for sale
- 94534 homes for sale
- 94558 homes for sale
- 94559 homes for sale
- 94574 homes for sale
- 94576 homes for sale
- 94589 homes for sale
- 94590 homes for sale
- 94591 homes for sale
- 94599 homes for sale
- 94951 homes for sale
- 94954 homes for sale
- 95442 homes for sale
- 95452 homes for sale
- 95476 homes for sale
- 95687 homes for sale
- 95688 homes for sale
Counties near Vintage, Napa, CA
- Alameda County homes for sale
- Amador County homes for sale
- Calaveras County homes for sale
- Colusa County homes for sale
- Contra Costa County homes for sale
- Glenn County homes for sale
- Lake County homes for sale
- Marin County homes for sale
- Napa County homes for sale
- Sacramento County homes for sale
- San Francisco County homes for sale
- San Joaquin County homes for sale
- San Mateo County homes for sale
- Santa Clara County homes for sale
- Santa Cruz County homes for sale
- Solano County homes for sale
- Sonoma County homes for sale
- Sutter County homes for sale
- Yolo County homes for sale
- Yuba County homes for sale
Protect your home and budget from life's surprises with an Assurant Home Warranty, backed by a partner that supports you through every step of homeownership. Explore Plans.
©2026 Century 21 Real Estate LLC. All rights reserved. CENTURY 21®, the CENTURY 21 Logo and C21® are service marks owned by Century 21 Real Estate LLC. Century 21 Real Estate LLC fully supports the principles of the Fair Housing Act and the Equal Opportunity Act. Each office is independently owned and operated. Listing information is deemed reliable but not guaranteed accurate.