- Bayview, San Francisco homes for sale
- Bayview Heights, San Francisco homes for sale
- Bernal Heights, San Francisco homes for sale
- Candlestick Point, San Francisco homes for sale
- Crocker, Daly City homes for sale
- Crocker-Amazon, San Francisco homes for sale
- Excelsior, San Francisco homes for sale
- Fairmount, San Francisco homes for sale
- Glen Park, San Francisco homes for sale
- Mission Terrace, San Francisco homes for sale
- Northeast Ridge, Brisbane homes for sale
- Outer Mission, San Francisco homes for sale
- Portola, San Francisco homes for sale
- Silver Terrace, San Francisco homes for sale
- Southeast, San Francisco homes for sale
- Southern Hills, Daly City homes for sale
- Sunny Vale Homestead, San Francisco homes for sale
- Sunnydale, San Francisco homes for sale
- Sunnyside, San Francisco homes for sale
- University Mound, San Francisco homes for sale
Visitacion Valley, San Francisco, CA - homes for sale
25 of 25 results displayed
- New
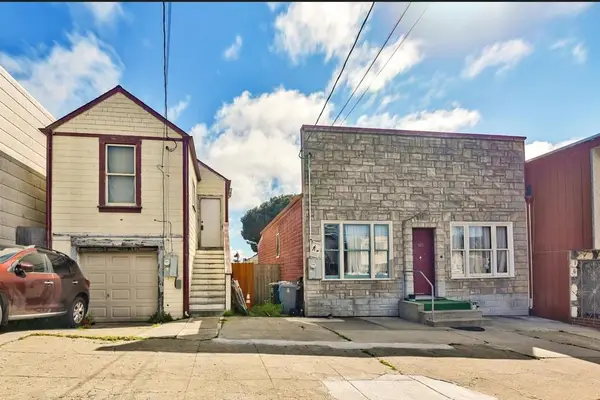 $1,200,000Active2 beds 1 baths855 sq. ft.
165 Peabody Street, San Francisco, CA 94134
MLS# ML82040717Listed by: DAVID G. ZIGAL, REALTOR - Open Tue, 2 to 4pmNew
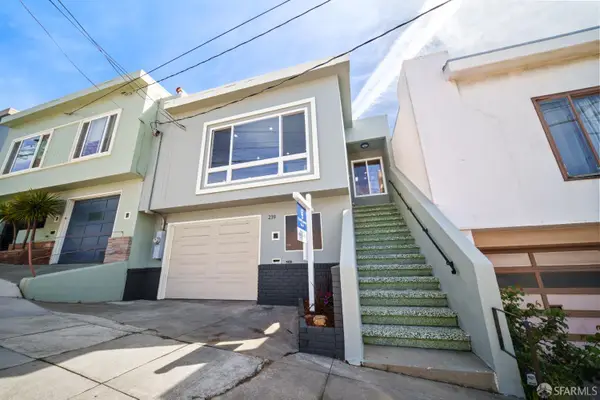 $829,000Active2 beds 1 baths1,100 sq. ft.
239 Sawyer Street, San Francisco, CA 94134
MLS# 426115989Listed by: COLDWELL BANKER REALTY - New
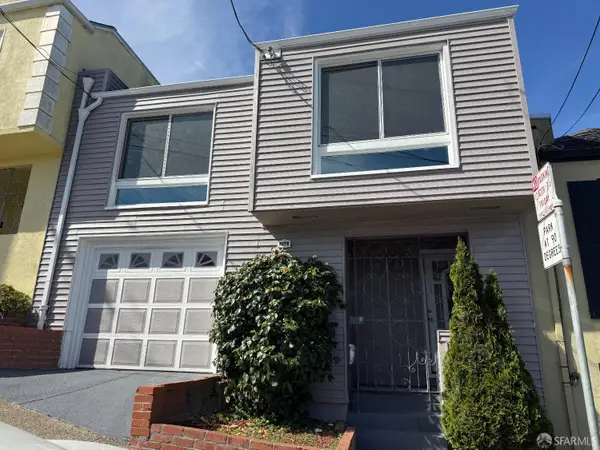 $1,099,000Active4 beds 2 baths1,064 sq. ft.
786 Colby Street, San Francisco, CA 94134
MLS# 426115257Listed by: CENTURY 21 MASTERS - New
 $1,200,000Active0 Acres
163 Peabody Street, San Francisco, CA 94134
MLS# ML82040747Listed by: DAVID G. ZIGAL, REALTOR 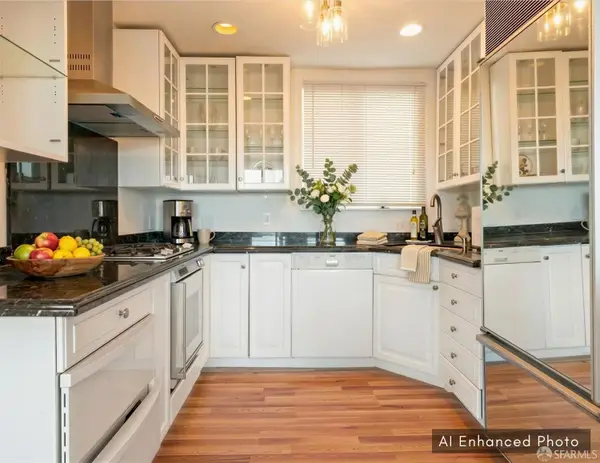 $888,000Active3 beds 2 baths1,493 sq. ft.
1033 Girard Street, San Francisco, CA 94134
MLS# 426107575Listed by: NEXTGEN PROPERTIES $450,000Active1 beds -- baths601 sq. ft.
163 Peabody Street, San Francisco, CA 94134
MLS# ML82038348Listed by: DAVID G. ZIGAL, REALTOR $1,285,000Active3 beds 4 baths1,997 sq. ft.
63 Lois Lane, San Francisco, CA 94134
MLS# ML82038191Listed by: COLDWELL BANKER REALTY $850,000Active4 beds 3 baths1,725 sq. ft.
1 Mccarthy Avenue, San Francisco, CA 94134
MLS# 426106041Listed by: KW ADVISORS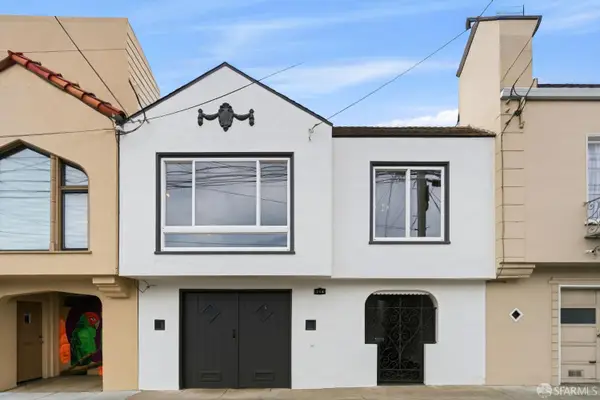 $1,038,000Pending2 beds 1 baths1,000 sq. ft.
115 Arleta Avenue, San Francisco, CA 94134
MLS# 426106096Listed by: PCH REALTORS $1,190,000Pending4 beds 3 baths2,031 sq. ft.
248 Ordway Street, San Francisco, CA 94134
MLS# 426109099Listed by: STERLING REAL ESTATE $1,395,000Active5 beds 4 baths2,600 sq. ft.
473 Leland Avenue, San Francisco, CA 94134
MLS# 426107431Listed by: COLDWELL BANKER REALTY $1,200,000Active4 beds 2 baths1,904 sq. ft.
112 Peabody Street, San Francisco, CA 94134
MLS# ML82036547Listed by: KW ADVISORS $799,000Pending2 beds 1 baths1,013 sq. ft.
1174 Bowdoin Street, San Francisco, CA 94134
MLS# 426105161Listed by: COMPASS $375,000Active0.08 Acres
3101 San Bruno Avenue, San Francisco, CA 94134
MLS# 426104881Listed by: ARFSTEN ENTERPRISES INC. $948,888Active3 beds 2 baths1,408 sq. ft.
44 Gillette Avenue, San Francisco, CA 94134
MLS# 426100250Listed by: CATALYST REAL ESTATE PROFESSIONALS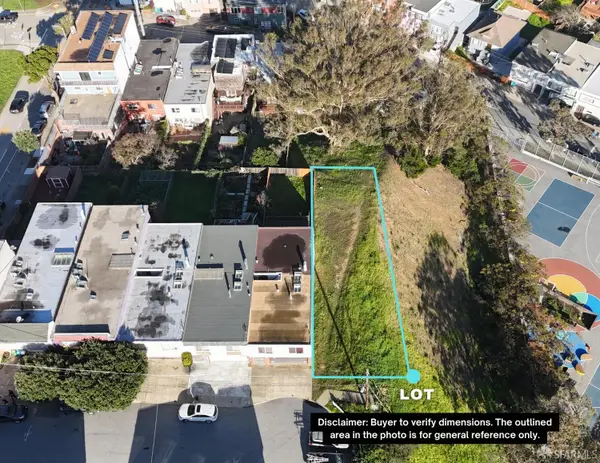 $479,000Active0.07 Acres
82 Delta Street, San Francisco, CA 94134
MLS# 426103043Listed by: NEXTGEN PROPERTIES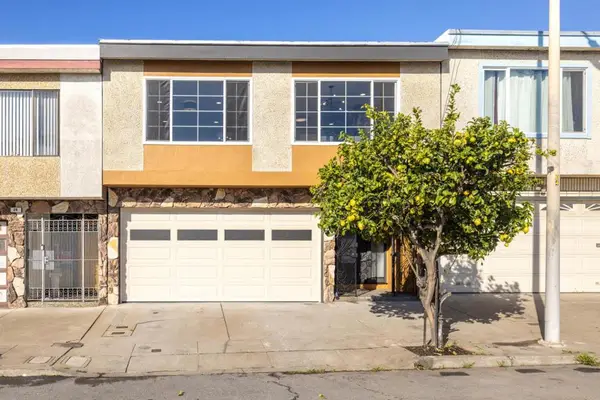 $1,295,000Pending4 beds 2 baths2,105 sq. ft.
24 Tomaso Court, San Francisco, CA 94134
MLS# ML82034002Listed by: EXP REALTY OF CALIFORNIA INC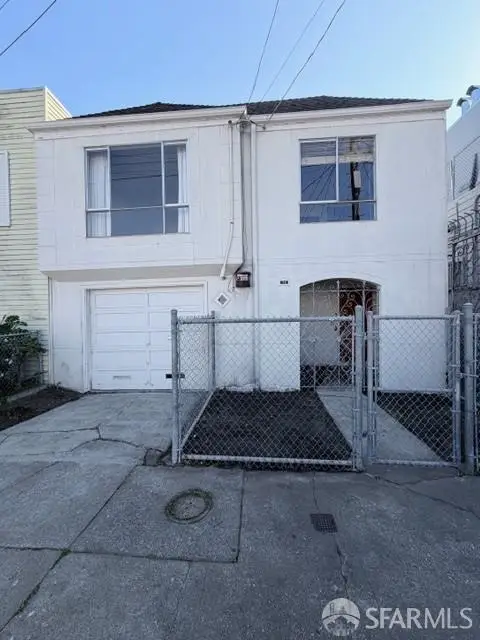 $748,000Pending2 beds 1 baths810 sq. ft.
77 Carrizal Street, San Francisco, CA 94134
MLS# 426101800Listed by: COLDWELL BANKER REALTY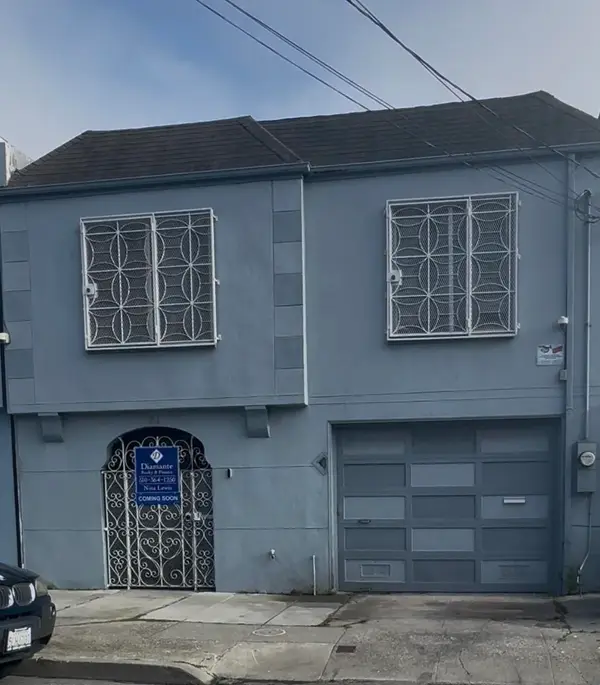 $875,000Pending2 beds 1 baths1,071 sq. ft.
81 Esquina, San Francisco, CA 94134
MLS# 41122115Listed by: DIAMANTE REALTY & FINANCE $908,900Active3 beds 2 baths1,412 sq. ft.
420 Harkness Avenue, San Francisco, CA 94134
MLS# 426098082Listed by: VYLLA HOME $749,000Pending2 beds 1 baths1,202 sq. ft.
73 Tioga Ave, San Francisco, CA 94134
MLS# 41119440Listed by: REAL BROKER $8,000,000Active0.44 Acres
2321 Geneva Avenue, Daly City, CA 94014
MLS# ML82028598Listed by: MARCUS & MILLICHAP $650,000Pending3 beds 3 baths1,350 sq. ft.
156 Garrison Avenue #156, San Francisco, CA 94134
MLS# ML82027541Listed by: PACIFIC COAST REAL ESTATE $688,000Active0.06 Acres
292 Arleta Avenue, San Francisco, CA 94134
MLS# 425086376Listed by: THESEUS REAL ESTATE $1,098,000Active3 beds 2 baths
1801 Geneva Avenue, San Francisco, CA 94134
MLS# 426096016Listed by: COLDWELL BANKER REALTY
Local realty services provided by:CENTURY 21 Village Realty, CENTURY 21 Baldini Real Estate, Inc., CENTURY 21 Sierra Properties, CENTURY 21 Select Real Estate, Inc., CENTURY 21 Kobetz Realty
The information being provided by California Regional MLS (Southern California) is for the consumer's personal, non-commercial use and may not be used for any purpose other than to identify prospective properties consumer may be interested in purchasing. Any information relating to real estate for sale referenced on this web site comes from the Internet Data Exchange (IDX) program of the California Regional MLS (Southern California). CENTURY 21 Village Realty is not a Multiple Listing Service (MLS), nor does it offer MLS access. This website is a service of CENTURY 21 Village Realty, a broker participant of California Regional MLS (Southern California). This web site may reference real estate listing(s) held by a brokerage firm other than the broker and/or agent who owns this web site.
The accuracy of all information, regardless of source, including but not limited to open house information, square footages and lot sizes, is deemed reliable but not guaranteed and should be personally verified through personal inspection by and/or with the appropriate professionals. The data contained herein is copyrighted by California Regional MLS (Southern California) and is protected by all applicable copyright laws. Any unauthorized dissemination of this information is in violation of copyright laws and is strictly prohibited.
Copyright 2021 California Regional MLS (Southern California). All rights reserved.
The information being provided by San Francisco Association of REALTORS is for the consumer's personal, non-commercial use and may not be used for any purpose other than to identify prospective properties consumer may be interested in purchasing. Any information relating to real estate for sale referenced on this web site comes from the Internet Data Exchange (IDX) program of the San Francisco Association of REALTORS. This web site may reference real estate listing(s) held by a brokerage firm other than the broker and/or agent who owns this web site. The accuracy of all information, regardless of source, including but not limited to open house information, square footages and lot sizes, is deemed reliable but not guaranteed and should be personally verified through personal inspection by and/or with the appropriate professionals. The data contained herein is copyrighted by San Francisco Association of REALTORS and is protected by all applicable copyright laws. Any unauthorized dissemination of this information is in violation of copyright laws and is strictly prohibited.
MetroList MLS 2026. This information is being provided by MetroList MLS. All measurements and calculations of area are approximate. Information provided by Seller/Other sources, not verified by Broker. All interested persons should independently verify accuracy of information. Provided properties may or may not be listed by the office/agent presenting the information. Data Updated: March 28, 2026. Information being provided is for consumers' personal, non-commercial use and may not be used for any purpose other than to identify prospective properties consumers may be interested in purchasing. Information deemed reliable but not guaranteed. Any offer of compensation is made only to Participants of MLS where the subject listing is filed and in accordance with such MLS's regulations or rules.
The information being provided by Bay Area Real Estate Information Service is for the consumer's personal, non-commercial use and may not be used for any purpose other than to identify prospective properties consumer may be interested in purchasing. Any information relating to real estate for sale referenced on this web site comes from the Internet Data Exchange (IDX) program of the Bay Area Real Estate Information Service. CENTURY 21 Kobetz Realty is not a Multiple Listing Service (MLS), nor does it offer MLS access. This website is a service of CENTURY 21 Kobetz Realty, a broker participant of Bay Area Real Estate Information Service. This web site may reference real estate listing(s) held by a brokerage firm other than the broker and/or agent who owns this web site.
The accuracy of all information, regardless of source, including but not limited to open house information, square footages and lot sizes, is deemed reliable but not guaranteed and should be personally verified through personal inspection by and/or with the appropriate professionals. The data contained herein is copyrighted by Bay Area Real Estate Information Service and is protected by all applicable copyright laws. Any unauthorized dissemination of this information is in violation of copyright laws and is strictly prohibited.
Properties in listings may have been sold or may no longer be available.
Copyright 2026 Bay Area Real Estate Information Service. All rights reserved.
Popular neighborhoods near Visitacion Valley, San Francisco, CA
Zip codes near Visitacion Valley, San Francisco, CA
- 94005 homes for sale
- 94014 homes for sale
- 94015 homes for sale
- 94080 homes for sale
- 94102 homes for sale
- 94103 homes for sale
- 94107 homes for sale
- 94110 homes for sale
- 94112 homes for sale
- 94114 homes for sale
- 94116 homes for sale
- 94117 homes for sale
- 94118 homes for sale
- 94122 homes for sale
- 94124 homes for sale
- 94127 homes for sale
- 94131 homes for sale
- 94132 homes for sale
- 94134 homes for sale
- 94158 homes for sale
Counties near Visitacion Valley, San Francisco, CA
- Alameda County homes for sale
- Contra Costa County homes for sale
- Lake County homes for sale
- Marin County homes for sale
- Napa County homes for sale
- Sacramento County homes for sale
- San Francisco County homes for sale
- San Joaquin County homes for sale
- San Mateo County homes for sale
- Santa Clara County homes for sale
- Santa Cruz County homes for sale
- Solano County homes for sale
- Sonoma County homes for sale
- Stanislaus County homes for sale
- Sutter County homes for sale
- Yolo County homes for sale
Protect your home and budget from life's surprises with an Assurant Home Warranty, backed by a partner that supports you through every step of homeownership. Explore Plans.
©2026 Century 21 Real Estate LLC. All rights reserved. CENTURY 21®, the CENTURY 21 Logo and C21® are service marks owned by Century 21 Real Estate LLC. Century 21 Real Estate LLC fully supports the principles of the Fair Housing Act and the Equal Opportunity Act. Each office is independently owned and operated. Listing information is deemed reliable but not guaranteed accurate.