- Bonsall homes for sale
- Camp Pendleton homes for sale
- Cardiff homes for sale
- Cardiff by the Sea homes for sale
- Carlsbad homes for sale
- Elfin Forest homes for sale
- Encinitas homes for sale
- Escondido homes for sale
- Fairbanks Ranch homes for sale
- Fallbrook homes for sale
- Harmony Grove homes for sale
- Hidden Meadows homes for sale
- Lake San Marcos homes for sale
- Oceanside homes for sale
- Oceanside-Escondido homes for sale
- Rancho Santa Fe homes for sale
- San Marcos homes for sale
- Solana Beach homes for sale
- Valley Center homes for sale
- Vista homes for sale
92083, CA - homes for sale
68 of 68 results displayed
- New
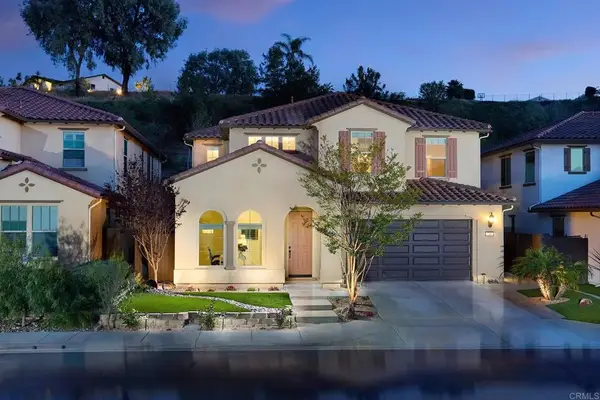 $1,239,000Active4 beds 3 baths3,368 sq. ft.
219 Flores Lane, Vista, CA 92083
MLS# NDP2603038Listed by: SHEA ADVANTAGE - New
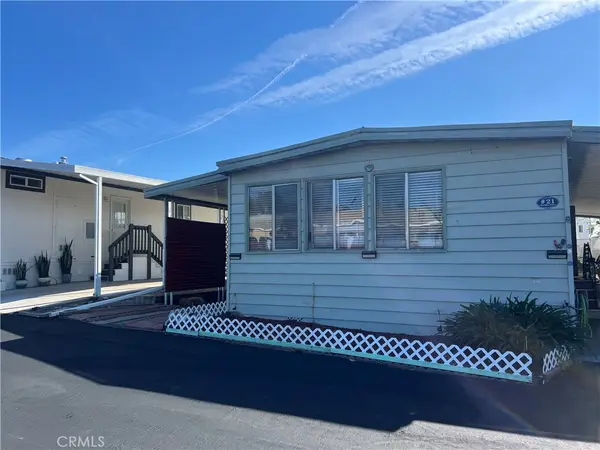 $109,000Active2 beds 2 baths820 sq. ft.
718 Sycamore Avenue #21, Vista, CA 92083
MLS# ND26066927Listed by: LEAH COLE REALTY - New
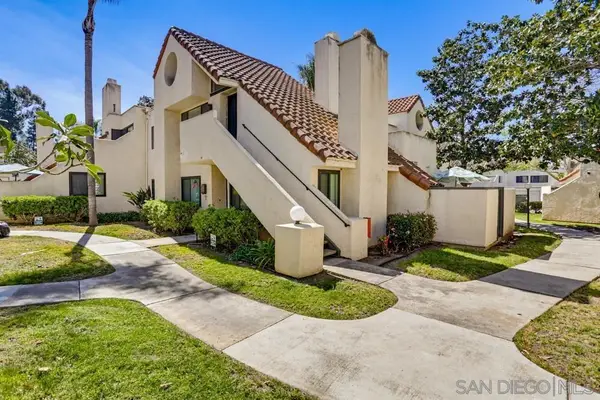
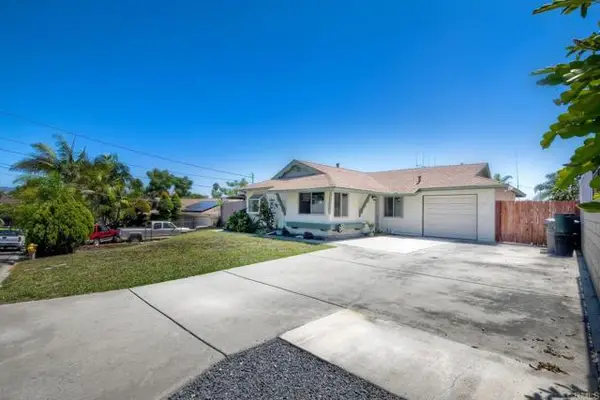 $749,000Active3 beds 2 baths968 sq. ft.
520 Starling Drive, Vista, CA 92083
MLS# CRNDP2602811Listed by: AARE - New
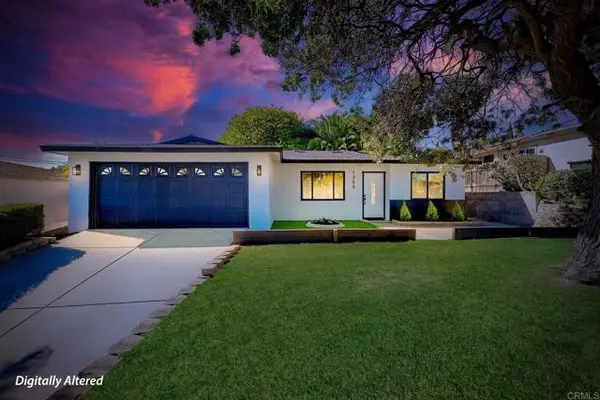 $799,999Active3 beds 2 baths1,177 sq. ft.
1350 Marabou Lane, Vista, CA 92083
MLS# CRNDP2602864Listed by: REAL BROKER - New
 $929,900Active4 beds 3 baths1,577 sq. ft.
527 Mynah Place, Vista, CA 92083
MLS# CRNDP2602888Listed by: COASTAL PREMIER PROPERTIES - Coming Soon
 $924,999Coming Soon4 beds 2 baths
Address Withheld By Seller, Vista, CA 92083
MLS# 260006887SDListed by: AARE - New
 $1,400,000Active0.87 Acres
801 W Vista, Vista, CA 92083
MLS# OC26062064Listed by: FIRST TEAM REAL ESTATE - New
 $499,900Active2 beds 2 baths828 sq. ft.
230 Diamond Way #147, Vista, CA 92083
MLS# 260006721SDListed by: SELECT CALIFORNIA HOMES - New
 $424,500Active1 beds 1 baths892 sq. ft.
333 N Melore Drive #D, Vista, CA 92083
MLS# 260006686SDListed by: CENTURY 21 AFFILIATED 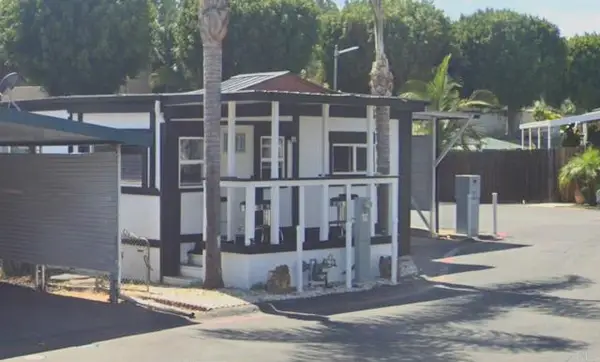 $312,990Pending3 beds 2 baths920 sq. ft.
400 N Melrose #18, Vista, CA 92083
MLS# CRNDP2602674Listed by: EXP REALTY OF SOUTHERN CA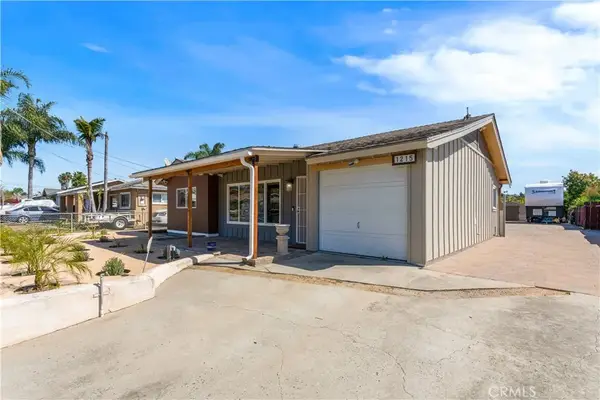 $849,000Pending3 beds 2 baths1,532 sq. ft.
1215 Lagan, Vista, CA 92083
MLS# ND26058908Listed by: THE DEWITT GROUP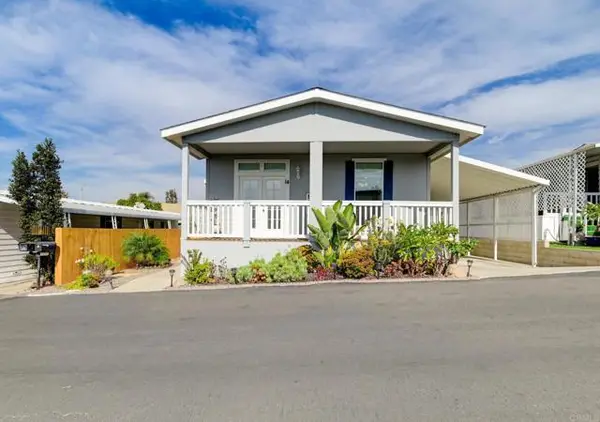 $298,900Active3 beds 2 baths1,368 sq. ft.
718 Sycamore Avenue #14, Vista, CA 92083
MLS# CRNDP2602518Listed by: PACIFIC HOMES $745,000Active3 beds 2 baths1,540 sq. ft.
1119 Cottontail Road, Vista, CA 92083
MLS# CRPTP2601967Listed by: HARRIS REALTY $485,000Active2 beds 2 baths1,172 sq. ft.
325 N Melrose Drive #A, Vista, CA 92083
MLS# NDP2602412Listed by: CENTURY 21 AFFILIATED $384,900Active3 beds 2 baths1,352 sq. ft.
1333 Olive Avenue #69, Vista, CA 92083
MLS# CRNDP2602395Listed by: LEAH COLE REALTY $949,000Active4 beds 3 baths1,536 sq. ft.
810 Anns Way, Vista, CA 92083
MLS# 260005901Listed by: COMPASS $59,000Pending2 beds 1 baths840 sq. ft.
718 Sycamore Avenue #23, Vista, CA 92083
MLS# CRNDP2601969Listed by: COLE REALTY & MORTGAGE $599,000Pending3 beds 3 baths1,365 sq. ft.
730 Silver Dr, Vista, CA 92083
MLS# CRPTP2601876Listed by: RISE REALTY $950,000Pending3 beds 2 baths1,604 sq. ft.
802 Bonita Dr, Vista, CA 92083
MLS# 260005648Listed by: REDFIN CORPORATION $510,000Active2 beds 2 baths1,152 sq. ft.
359 N Melrose Drive H, Vista, CA 92083
MLS# 260005639SDListed by: KELLER WILLIAMS SAN DIEGO METRO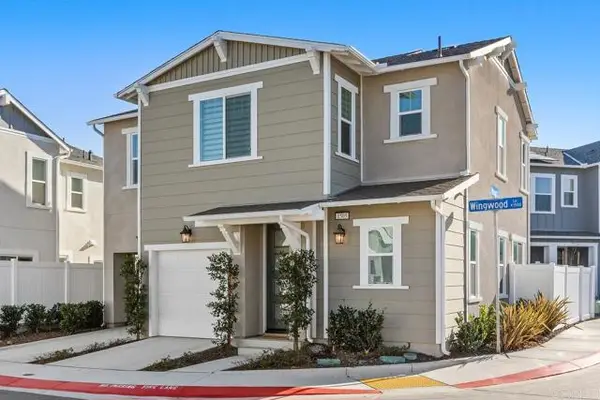 $894,999Active3 beds 3 baths1,801 sq. ft.
1505 Wingwood Lane, Vista, CA 92083
MLS# CRNDP2602174Listed by: SEO REALTY $319,900Pending2 beds 2 baths1,022 sq. ft.
245 W Bobier Drive #33, Vista, CA 92083
MLS# IV26038347Listed by: KELLER WILLIAMS RIVERSIDE CENT $875,000Active4 beds 3 baths1,959 sq. ft.
1521 Meriwood Way, Vista, CA 92083
MLS# 260005285Listed by: EXP REALTY OF SOUTHERN CALIFORNIA, INC.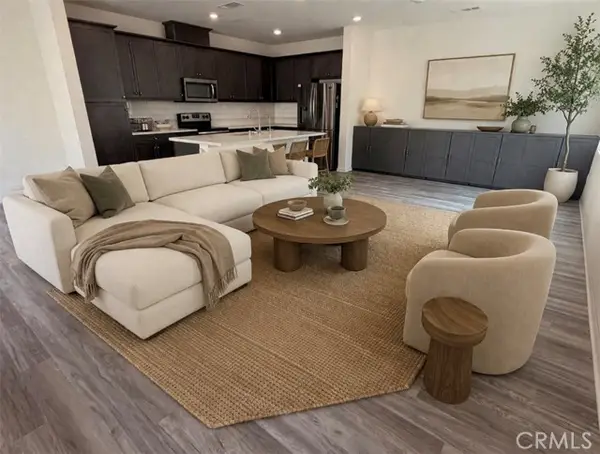 $775,000Active3 beds 3 baths1,913 sq. ft.
1357 Palo Verde, Vista, CA 92083
MLS# CRAR26047532Listed by: CA FLAT FEE LISTINGS, INC $1,450,000Active5 beds 4 baths3,381 sq. ft.
1517 Leonis Pl, Vista, CA 92083
MLS# 260005098Listed by: REAL BROKER $1,175,000Active5 beds 4 baths3,086 sq. ft.
683 Grant Ct, Vista, CA 92083
MLS# 260005061Listed by: COMPASS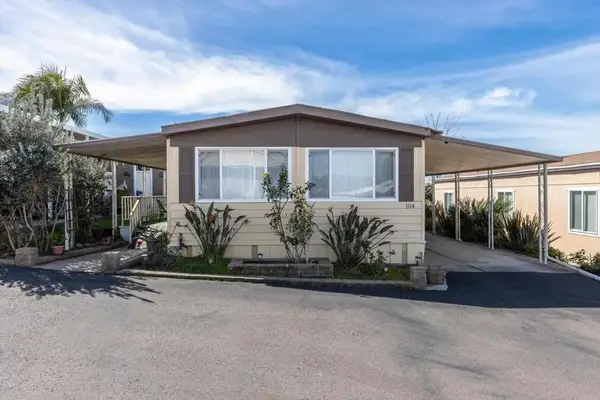 $139,000Active2 beds 2 baths1,140 sq. ft.
718 Sycamore #104, Vista, CA 92083
MLS# NDP2601892Listed by: LEAH COLE REALTY $16,000Active0 Acres
243 G-4, Unincorporated, CA 93535
MLS# SR24221347Listed by: WILLIAM RYAN REAL ESTATE BROKER $1,395,000Pending5 beds 5 baths3,543 sq. ft.
224 Flores Lane, Vista, CA 92083
MLS# NDP2601836Listed by: SHEA ADVANTAGE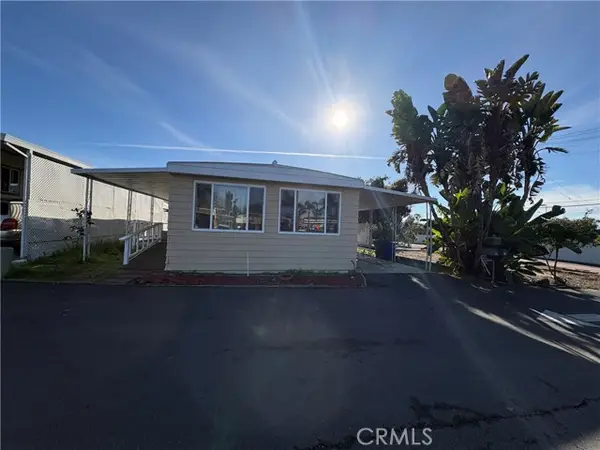 $160,000Active2 beds 2 baths1,224 sq. ft.
718 Sycamore Avenue #19, Vista, CA 92083
MLS# CRIG26040890Listed by: KW THE LAKES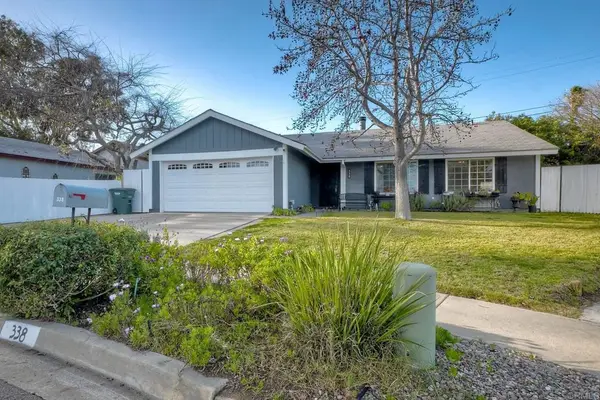 $899,000Pending4 beds 2 baths1,390 sq. ft.
338 Rancho Vista Place, Vista, CA 92083
MLS# NDP2601612Listed by: REALTY PLACE $234,900Pending1 beds 1 baths720 sq. ft.
245 W Bobier Dr #23, Vista, CA 92083
MLS# 260003833Listed by: THE REAL ESTATE SOLUTION $749,000Active3 beds 3 baths1,679 sq. ft.
1374 Palo Verde Way, Vista, CA 92083
MLS# CRNDP2601542Listed by: LILY FIELD REALTY $499,000Pending1 beds 1 baths856 sq. ft.
331 Windy Lane, Vista, CA 92083
MLS# CRNDP2601371Listed by: COMPASS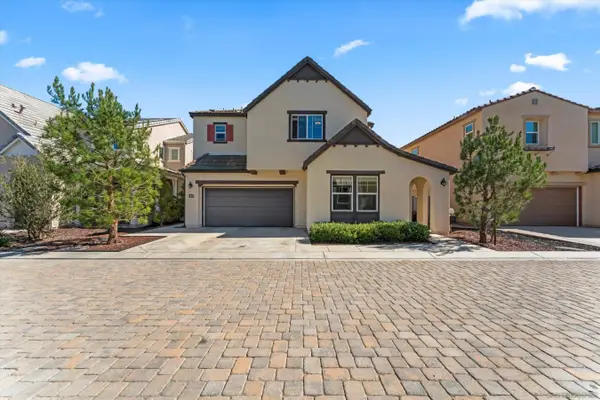 $1,194,900Active5 beds 4 baths3,086 sq. ft.
675 Grant Ct, Vista, CA 92083
MLS# 260003316Listed by: VIP PREMIER REALTY CORP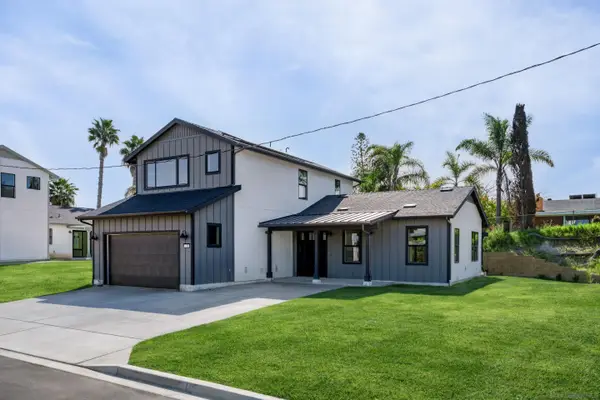 $1,095,000Active3 beds 3 baths2,006 sq. ft.
702 Passion Court, Vista, CA 92083
MLS# 260002982Listed by: DOLAN REALTY COMPANY $449,900Pending2 beds 2 baths1,172 sq. ft.
317 N Melrose Dr #G, Vista, CA 92083
MLS# 260002794SDListed by: REDFIN CORPORATION $319,000Active2 beds 2 baths1,456 sq. ft.
1333 E Olive Avenue #60, Vista, CA 92083
MLS# CRNDP2600931Listed by: LEAH COLE REALTY- New
 $799,999Active3 beds 2 baths1,177 sq. ft.
1350 Marabou Lane, Vista, CA 92083
MLS# NDP2602864Listed by: REAL BROKER  $995,000Active4 beds 3 baths2,202 sq. ft.
209 Journeys End, Vista, CA 92083
MLS# CRPTP2600730Listed by: COLDWELL BANKER WEST $255,000Active4 beds 2 baths1,128 sq. ft.
200 Olive Ave #101, Vista, CA 92083
MLS# 260002106Listed by: CA-RES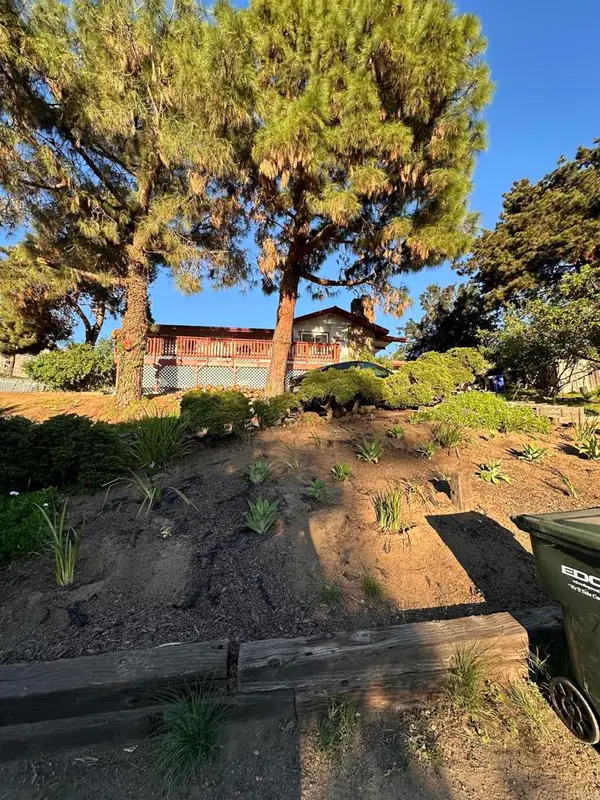 $795,000Active3 beds 2 baths1,476 sq. ft.
2430 Sunflower Ter, Vista, CA 92083
MLS# PTP2600689Listed by: COLDWELL BANKER REALTY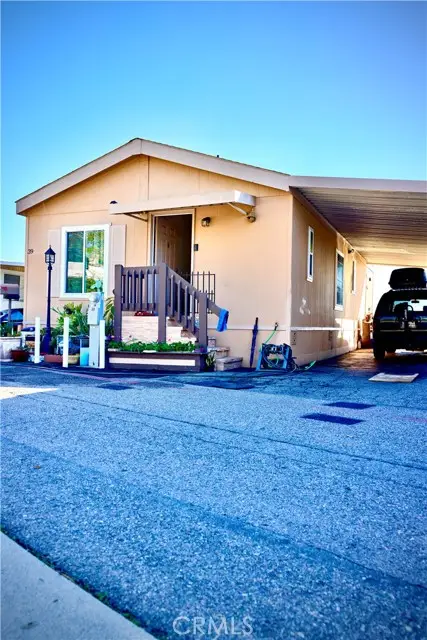 $329,000Active2 beds 2 baths862 sq. ft.
220 Camino Corto #39, Vista, CA 92083
MLS# CRSW26007499Listed by: LPT REALTY, INC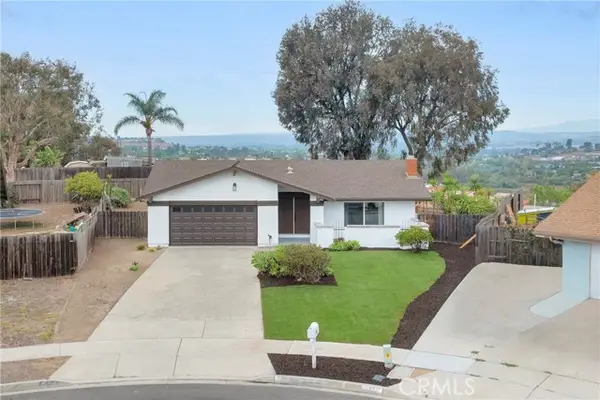 $964,000Pending4 beds 2 baths1,470 sq. ft.
1768 Henderson Court, Vista, CA 92083
MLS# CROC26008352Listed by: REAL BROKER $1,195,000Active5 beds 7 baths3,920 sq. ft.
467 Melrose Dr, Vista, CA 92083
MLS# 2600842Listed by: APARTMENT REALTY GROUP (ARG) $949,000Active4 beds 3 baths1,798 sq. ft.
648 Cocapah St, Vista, CA 92083
MLS# CRNDP2511536Listed by: LPT REALTY $143,000Active2 beds 2 baths1,224 sq. ft.
718 Sycamore Avenue #94, Vista, CA 92083
MLS# CRNDP2600196Listed by: MORGAN BROWN REAL ESTATE, INC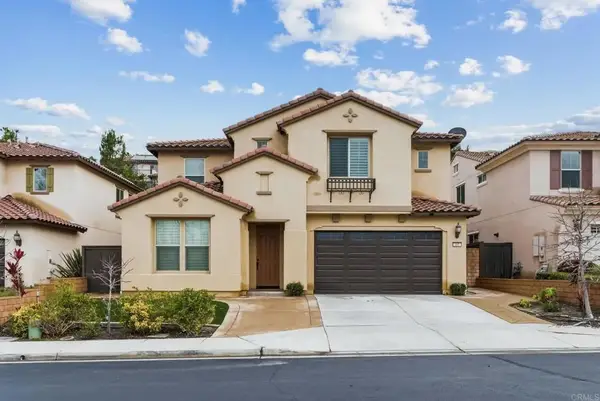 $1,454,990Active6 beds 4 baths4,200 sq. ft.
441 Adobe Estates Dr, Vista, CA 92083
MLS# NDP2600058Listed by: EXP REALTY OF SOUTHERN CA $149,000Active2 beds 2 baths1,368 sq. ft.
718 Sycamore #193, Vista, CA 92083
MLS# NDP2511318Listed by: LEAH COLE REALTY $425,000Active2 beds 2 baths940 sq. ft.
245 W Bobier Drive #90, Vista, CA 92083
MLS# CRNDP2511294Listed by: FIRST TEAM REAL ESTATE $459,000Active2 beds 2 baths1,172 sq. ft.
313 N Melrose #C, Vista, CA 92083
MLS# SW26059872Listed by: LPT REALTY, INC $3,250,000Active3.36 Acres
1351 S Santa Fe Avenue, Vista, CA 92084
MLS# CL25617403Listed by: KELLER WILLIAMS BEVERLY HILLS $1,050,000Active-- beds 2 baths
224 Astro Court, Vista, CA 92083
MLS# NDP2601421Listed by: ERA RANCH & SEA REALTY $825,000Active5 beds 3 baths1,751 sq. ft.
595 Copper Dr., Vista, CA 92083
MLS# 250043567Listed by: KELLER WILLIAMS REALTY $1,175,000Active0 Acres
326 Plumosa #11 and 13, Vista, CA 92083
MLS# 250041637Listed by: KELLER WILLIAMS REALTY $1,995,000Active3 beds 2 baths1,383 sq. ft.
323 Hill Dr, Vista, CA 92083
MLS# 250041272Listed by: COLDWELL BANKER REALTY $1,175,000Active3 beds 2 baths1,508 sq. ft.
326 Plumosa Ave, Vista, CA 92083
MLS# 250039174Listed by: KELLER WILLIAMS REALTY $1,299,000Active5 beds 4 baths3,206 sq. ft.
1245 Phillips Street, Vista, CA 92083
MLS# CRSW26022382Listed by: REDFIN CORPORATION $149,900Active2 beds 2 baths1,176 sq. ft.
718 Sycamore Avenue #109, Vista, CA 92083
MLS# CRNDP2600050Listed by: LEAH COLE REALTY $1,450,000Active5 beds 4 baths3,381 sq. ft.
1517 Leonis Pl, Vista, CA 92083
MLS# 260005098SDListed by: REAL BROKER $349,900Pending2 beds 2 baths960 sq. ft.
1333 Olive Avenue #37, Vista, CA 92083
MLS# CRNDP2508261Listed by: SAN DIEGO REAL ESTATE & LOANS $8,400,000Active5 beds 5 baths18,195 sq. ft.
628 W California Ave, Vista, CA 92083
MLS# 250036922Listed by: DAVID SANTISTEVAN $316,000Pending0 Acres
0 Allea Lane, Vista, CA 92083
MLS# 250035534Listed by: MOUNTAIN TRUST REALTY SERVICES $11,750,000Active-- beds -- baths27,168 sq. ft.
380 Plymouth Dr, Vista, CA 92083
MLS# 250031535Listed by: BRIDGEPOINT REALTY INC $446,000Pending2 beds 2 baths972 sq. ft.
955 Postal Way #58, Vista, CA 92083
MLS# NDP2600667Listed by: EXP REALTY OF CALIFORNIA, INC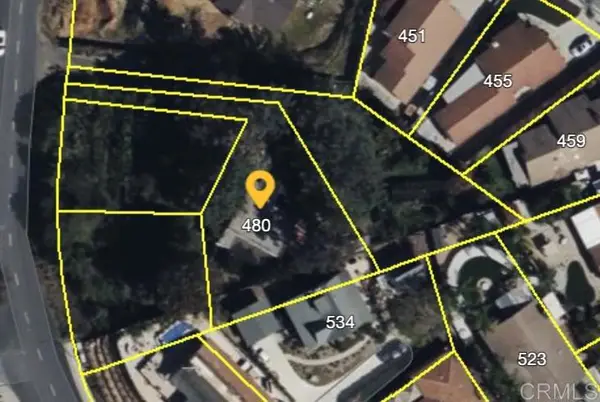 $1,995,000Active3 beds 2 baths1,400 sq. ft.
480 Rancho Vista Road, Vista, CA 92083
MLS# NDP2600108Listed by: COLDWELL BANKER REALTY $4,750,000Pending8 Acres
0 Primrose & Lobelia, Vista, CA 92084
MLS# 230006000SDListed by: COMPASS $4,750,000Pending0 Acres
000 Primrose & Lobelia #000, Vista, CA 92084
MLS# 230006000Listed by: COMPASS
Local realty services provided by:CENTURY 21 Affiliated, CENTURY 21 Epic, CENTURY 21 Sierra Properties
This information is deemed reliable but not guaranteed. You should rely on this information only to decide whether or not to further investigate a particular property. BEFORE MAKING ANY OTHER DECISION, YOU SHOULD PERSONALLY INVESTIGATE THE FACTS (e.g. square footage and lot size) with the assistance of an appropriate professional. You may use this information only to identify properties you may be interested in investigating further. All uses except for personal, non-commercial use in accordance with the foregoing purpose are prohibited. Redistribution or copying of this information, any photographs or video tours is strictly prohibited. This information is derived from the Internet Data Exchange (IDX) service provided by San Diego MLS®. Displayed property listings may be held by a brokerage firm other than the broker and/or agent responsible for this display. The information and any photographs and video tours and the compilation from which they are derived is protected by copyright. Compilation © 2020 San Diego MLS®, Inc.
The information being provided by California Regional MLS (Southern California) is for the consumer's personal, non-commercial use and may not be used for any purpose other than to identify prospective properties consumer may be interested in purchasing. Any information relating to real estate for sale referenced on this web site comes from the Internet Data Exchange (IDX) program of the California Regional MLS (Southern California). CENTURY 21 Epic is not a Multiple Listing Service (MLS), nor does it offer MLS access. This website is a service of CENTURY 21 Epic, a broker participant of California Regional MLS (Southern California). This web site may reference real estate listing(s) held by a brokerage firm other than the broker and/or agent who owns this web site.
The accuracy of all information, regardless of source, including but not limited to open house information, square footages and lot sizes, is deemed reliable but not guaranteed and should be personally verified through personal inspection by and/or with the appropriate professionals. The data contained herein is copyrighted by California Regional MLS (Southern California) and is protected by all applicable copyright laws. Any unauthorized dissemination of this information is in violation of copyright laws and is strictly prohibited.
Copyright 2021 California Regional MLS (Southern California). All rights reserved.
Popular searches near 92083
Popular neighborhoods near 92083
- Calavera Hills, Carlsbad homes for sale
- Guajome, Oceanside homes for sale
- Ivey Ranch / Rancho Del Oro, Oceanside homes for sale
- Jeffries Ranch, Oceanside homes for sale
- Kelly Ranch, Carlsbad homes for sale
- Kew Gardens, Vista homes for sale
- Lake, Oceanside homes for sale
- Mira Costa, Oceanside homes for sale
- Ocean Hills, Oceanside homes for sale
- Ocean Hills Country Club, Oceanside homes for sale
- Oceana, Oceanside homes for sale
- Orleavo Heights, Vista homes for sale
- Peacock, Oceanside homes for sale
- Rancho Carlsbad, Carlsbad homes for sale
- Rancho Vista Estates, Vista homes for sale
- Robertson Ranch, Carlsbad homes for sale
- Shadowridge, Vista homes for sale
- Tamarack Point, Carlsbad homes for sale
- The Foothills, Carlsbad homes for sale
- Tri-City, Oceanside homes for sale
Protect your home and budget from life's surprises with an Assurant Home Warranty, backed by a partner that supports you through every step of homeownership. Explore Plans.
©2026 Century 21 Real Estate LLC. All rights reserved. CENTURY 21®, the CENTURY 21 Logo and C21® are service marks owned by Century 21 Real Estate LLC. Century 21 Real Estate LLC fully supports the principles of the Fair Housing Act and the Equal Opportunity Act. Each office is independently owned and operated. Listing information is deemed reliable but not guaranteed accurate.