- Albright, Durham homes for sale
- Anderson St., Durham homes for sale
- Central Park, Durham homes for sale
- Cleveland - Holloway, Durham homes for sale
- Colonial Village, Durham homes for sale
- Croasdaile, Durham homes for sale
- Downtown Durham, Durham homes for sale
- Duke Park, Durham homes for sale
- Lyon Park, Durham homes for sale
- Morehead Hill, Durham homes for sale
- Northgate Park, Durham homes for sale
- Old North Durham, Durham homes for sale
- Old West Durham, Durham homes for sale
- Omah Street, Durham homes for sale
- Scarsdale Village, Durham homes for sale
- Southside, Durham homes for sale
- Stadium Heights, Durham homes for sale
- Trinity Park, Durham homes for sale
- Warehouse District, Durham homes for sale
- Watts Hospital, Durham homes for sale
Walltown, Durham, NC - homes for sale
14 of 14 results displayed
 $445,000Pending3 beds 2 baths1,299 sq. ft.
1009 Berkeley Street, Durham, NC 27705
MLS# 10154292Listed by: URBAN DURHAM REALTY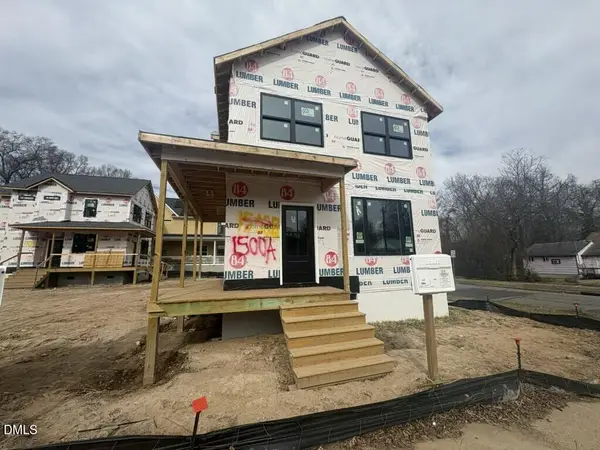 $600,000Active3 beds 3 baths1,200 sq. ft.
1500-A Englewood Avenue, Durham, NC 27705
MLS# 10150968Listed by: COLDWELL BANKER HPW $225,000Active2 beds 2 baths600 sq. ft.
1308d Sedgefield Street #Unit A, Durham, NC 27705
MLS# 10150961Listed by: EXP REALTY LLC $379,900Active3 beds 3 baths1,826 sq. ft.
1023 Blissful Waters Street, Durham, NC 27703
MLS# 10149353Listed by: FATHOM REALTY NC, LLC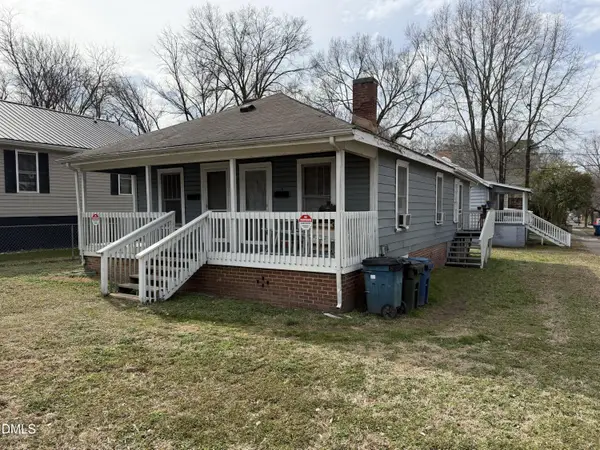 $425,000Active3 beds 3 baths1,795 sq. ft.
927 Berkeley Street, Durham, NC 27705
MLS# 10148665Listed by: DEATON INVESTMENT REAL ESTATE $274,900Active3 beds 1 baths996 sq. ft.
1708 Forest Road, Durham, NC 27705
MLS# 10142185Listed by: PROVIDENCE REALTY GROUP LLC $347,000Active2 beds 2 baths1,170 sq. ft.
1019 Sedgefield Street, Durham, NC 27705
MLS# 10136743Listed by: FRASHER WHALEY REALTY GROUP $387,000Pending2 beds 2 baths1,557 sq. ft.
1015 Sedgefield Street, Durham, NC 27705
MLS# 10136745Listed by: FRASHER WHALEY REALTY GROUP $358,000Active2 beds 2 baths1,182 sq. ft.
1020 Sedgefield Street, Durham, NC 27705
MLS# 10136746Listed by: FRASHER WHALEY REALTY GROUP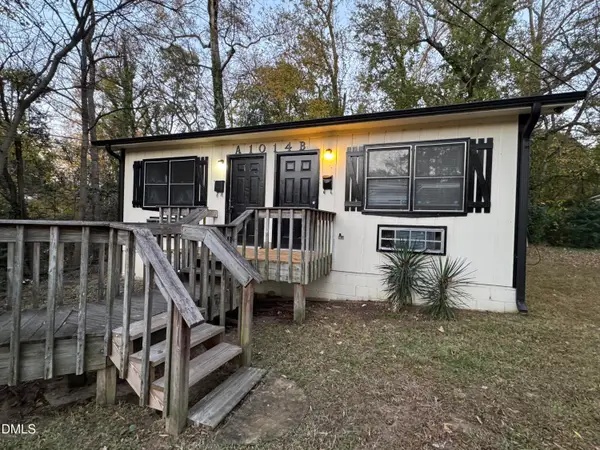 $349,900Active2 beds 2 baths900 sq. ft.
1014 Sedgefield Street, Durham, NC 27705
MLS# 10142865Listed by: PARADIGM PROPERTIES LLC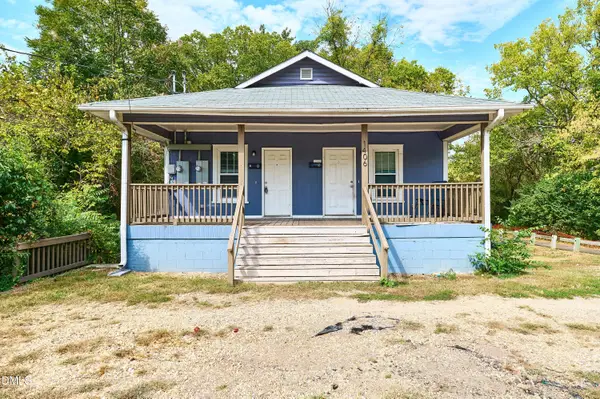 $498,000Active6 beds 4 baths3,080 sq. ft.
1406 W Club Boulevard #A & B, Durham, NC 27705
MLS# 10131391Listed by: EXP REALTY LLC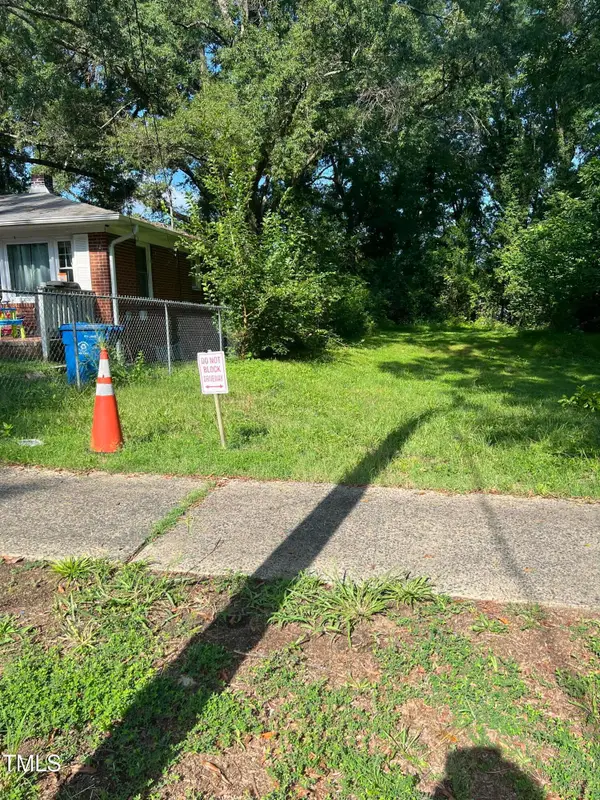 $260,000Pending0.17 Acres
919 Sedgefield Street, Durham, NC 27705
MLS# 10117652Listed by: EXP REALTY LLC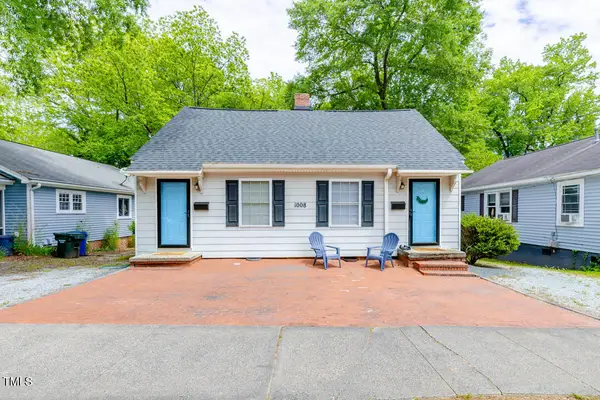 $414,900Pending2 beds 2 baths1,260 sq. ft.
1008 Clarendon Street, Durham, NC 27705
MLS# 10113709Listed by: CITYPLAT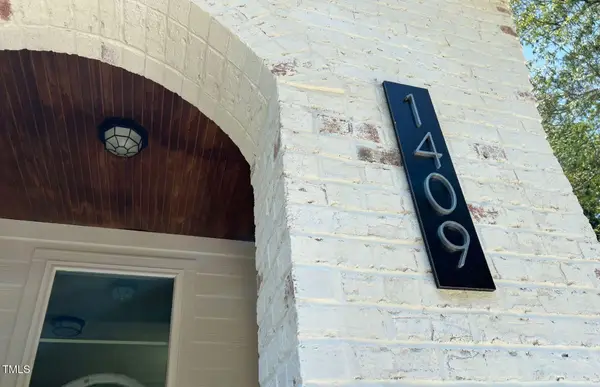 $989,000Pending5 beds 5 baths3,460 sq. ft.
1409 Sedgefield Street, Durham, NC 27705
MLS# 10126773Listed by: CHANTICLEER PROPERTIES LLC
Local realty services provided by:CENTURY 21 Triangle Group
Listings marked with a Doorify MLS icon are provided courtesy of the Doorify MLS, of North Carolina, Internet Data Exchange Database. Brokers make an effort to deliver accurate information, but buyers should independently verify any information on which they will rely in a transaction. The listing broker shall not be responsible for any typographical errors, misinformation, or misprints, and they shall be held totally harmless from any damages arising from reliance upon this data. This data is provided exclusively for consumers’ personal, non-commercial use. Copyright 2026 Doorify MLS of North Carolina. All rights reserved.
Popular neighborhoods near Walltown, Durham, NC
Zip codes near Walltown, Durham, NC
- 27243 homes for sale
- 27278 homes for sale
- 27503 homes for sale
- 27510 homes for sale
- 27513 homes for sale
- 27514 homes for sale
- 27517 homes for sale
- 27519 homes for sale
- 27522 homes for sale
- 27560 homes for sale
- 27613 homes for sale
- 27617 homes for sale
- 27701 homes for sale
- 27703 homes for sale
- 27704 homes for sale
- 27705 homes for sale
- 27707 homes for sale
- 27709 homes for sale
- 27712 homes for sale
- 27713 homes for sale
Counties near Walltown, Durham, NC
- Alamance County homes for sale
- Caswell County homes for sale
- Chatham County homes for sale
- Danville city County homes for sale
- Durham County homes for sale
- Franklin County homes for sale
- Granville County homes for sale
- Guilford County homes for sale
- Halifax County homes for sale
- Harnett County homes for sale
- Johnston County homes for sale
- Lee County homes for sale
- Nash County homes for sale
- Orange County homes for sale
- Person County homes for sale
- Randolph County homes for sale
- Rockingham County homes for sale
- Vance County homes for sale
- Wake County homes for sale
- Warren County homes for sale
Protect your home and budget from life's surprises with an Assurant Home Warranty, backed by a partner that supports you through every step of homeownership. Explore Plans.
©2026 Century 21 Real Estate LLC. All rights reserved. CENTURY 21®, the CENTURY 21 Logo and C21® are service marks owned by Century 21 Real Estate LLC. Century 21 Real Estate LLC fully supports the principles of the Fair Housing Act and the Equal Opportunity Act. Each office is independently owned and operated. Listing information is deemed reliable but not guaranteed accurate.